

principles_of_economics_gregory_mankiw
.pdfCHAPTER 4 THE MARKET FORCES OF SUPPLY AND DEMAND |
75 |
SUPPLY
We now turn to the other side of the market and examine the behavior of sellers. The quantity supplied of any good or service is the amount that sellers are willing and able to sell. Once again, to focus our thinking, let’s consider the market for ice cream and look at the factors that determine the quantity supplied.
WHAT DETERMINES THE QUANTITY
AN INDIVIDUAL SUPPLIES?
Imagine that you are running Student Sweets, a company that produces and sells ice cream. What determines the quantity of ice cream you are willing to produce and offer for sale? Here are some possible answers.
Price The price of ice cream is one determinant of the quantity supplied. When the price of ice cream is high, selling ice cream is profitable, and so the quantity supplied is large. As a seller of ice cream, you work long hours, buy many icecream machines, and hire many workers. By contrast, when the price of ice cream is low, your business is less profitable, and so you will produce less ice cream. At an even lower price, you may choose to go out of business altogether, and your quantity supplied falls to zero.
Because the quantity supplied rises as the price rises and falls as the price falls, we say that the quantity supplied is positively related to the price of the good. This relationship between price and quantity supplied is called the law of supply: Other things equal, when the price of a good rises, the quantity supplied of the good also rises.
Input Prices To produce its output of ice cream, Student Sweets uses various inputs: cream, sugar, flavoring, ice-cream machines, the buildings in which the ice cream is made, and the labor of workers to mix the ingredients and operate the machines. When the price of one or more of these inputs rises, producing ice cream is less profitable, and your firm supplies less ice cream. If input prices rise substantially, you might shut down your firm and supply no ice cream at all. Thus, the supply of a good is negatively related to the price of the inputs used to make the good.
Technology The technology for turning the inputs into ice cream is yet another determinant of supply. The invention of the mechanized ice-cream machine, for example, reduced the amount of labor necessary to make ice cream. By reducing firms’ costs, the advance in technology raised the supply of ice cream.
Expectations The amount of ice cream you supply today may depend on your expectations of the future. For example, if you expect the price of ice cream to rise in the future, you will put some of your current production into storage and supply less to the market today.
quantity supplied
the amount of a good that sellers are willing and able to sell
law of supply
the claim that, other things equal, the quantity supplied of a good rises when the price of the good rises
76 |
PART TWO SUPPLY AND DEMAND I: HOW MARKETS WORK |
supply schedule
a table that shows the relationship between the price of a good and the quantity supplied
supply cur ve
a graph of the relationship between the price of a good and the quantity supplied
Table 4-4
BEN’S SUPPLY SCHEDULE. The
supply schedule shows the quantity supplied at each price.
Figur e 4-5
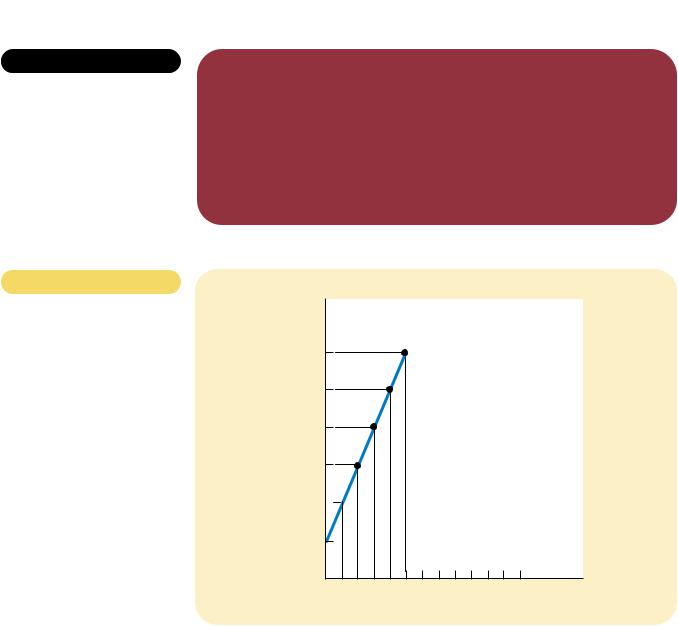
BEN’S SUPPLY CURVE. This
supply curve, which graphs the supply schedule in Table 4-4, shows how the quantity supplied of the good changes as its price varies. Because a higher price increases the quantity supplied, the supply curve slopes upward.
THE SUPPLY SCHEDULE AND THE SUPPLY CURVE
Consider how the quantity supplied varies with the price, holding input prices, technology, and expectations constant. Table 4-4 shows the quantity supplied by Ben, an ice-cream seller, at various prices of ice cream. At a price below $1.00, Ben does not supply any ice cream at all. As the price rises, he supplies a greater and greater quantity. This table is called the supply schedule.
Figure 4-5 graphs the relationship between the quantity of ice cream supplied and the price. The curve relating price and quantity supplied is called the supply curve. The supply curve slopes upward because, ceteris paribus, a higher price means a greater quantity supplied.
PRICE OF ICE-CREAM CONE |
QUANTITY OF CONES SUPPLIED |
|
|
$0.00 |
0 |
0.50 |
0 |
1.00 |
1 |
1.50 |
2 |
2.00 |
3 |
2.50 |
4 |
3.00 |
5 |
Price of
Ice-Cream
Cone
$3.00
2.50
2.00
1.50
1.00 
0.50
0 1 2 3 4 5 6 7 8 9 10 11 12 Quantity of
Ice-Cream Cones

CHAPTER 4 THE MARKET FORCES OF SUPPLY AND DEMAND |
77 |
MARKET SUPPLY VERSUS INDIVIDUAL SUPPLY
Just as market demand is the sum of the demands of all buyers, market supply is the sum of the supplies of all sellers. Table 4-5 shows the supply schedules for two ice-cream producers—Ben and Jerry. At any price, Ben’s supply schedule tells us the quantity of ice cream Ben supplies, and Jerry’s supply schedule tells us the quantity of ice cream Jerry supplies. The market supply is the sum of the two individual supplies.
Market supply depends on all those factors that influence the supply of individual sellers, such as the prices of inputs used to produce the good, the available technology, and expectations. In addition, the supply in a market depends on the number of sellers. (If Ben or Jerry were to retire from the ice-cream business, the supply in the market would fall.) The supply schedules in Table 4-5 show what happens to quantity supplied as the price varies while all the other variables that determine quantity supplied are held constant.
Figure 4-6 shows the supply curves that correspond to the supply schedules in Table 4-5. As with demand curves, we sum the individual supply curves horizontally to obtain the market supply curve. That is, to find the total quantity supplied at any price, we add the individual quantities found on the horizontal axis of the individual supply curves. The market supply curve shows how the total quantity supplied varies as the price of the good varies.
SHIFTS IN THE SUPPLY CURVE
Suppose that the price of sugar falls. How does this change affect the supply of ice cream? Because sugar is an input into producing ice cream, the fall in the price of sugar makes selling ice cream more profitable. This raises the supply of ice cream: At any given price, sellers are now willing to produce a larger quantity. Thus, the supply curve for ice cream shifts to the right.
Whenever there is a change in any determinant of supply, other than the good’s price, the supply curve shifts. As Figure 4-7 shows, any change that raises quantity supplied at every price shifts the supply curve to the right. Similarly, any change that reduces the quantity supplied at every price shifts the supply curve to the left.
PRICE OF ICE-CREAM CONE |
BEN |
|
JERRY |
|
MARKET |
|
|
|
|
|
|
$0.00 |
0 |
|
0 |
|
0 |
0.50 |
0 |
|
0 |
|
0 |
1.00 |
1 |
|
0 |
|
1 |
1.50 |
2 |
|
2 |
|
4 |
2.00 |
3 |
|
4 |
|
7 |
2.50 |
4 |
|
6 |
|
10 |
3.00 |
5 |
|
8 |
|
13 |
Table 4-5
INDIVIDUAL AND MARKET
SUPPLY SCHEDULES. The
quantity supplied in a market is the sum of the quantities supplied by all the sellers.
78 |
PART TWO |
|
SUPPLY AND DEMAND I: HOW MARKETS WORK |
|
|
|
|
|
|
|
|
|
|||||||||||||||||||||
|
|
|
|
|
|
|
|
|
|
|
Ben’s Supply |
|
|
|
Jerry’s Supply |
||||||||||||||||||
|
Price of |
|
|
|
|
|
|
|
|
|
|
|
|
|
|
|
|
Price of |
|
|
|
|
|
|
|
|
|
|
|
|
|
|
|
|
|
|
|
|
|
|
|
|
|
|
|
|
|
|
|
|
|
|
|
|
|
|
|
|
|
|
|
|
|
|
|||
|
|
|
|
|
|
|
|
|
|
|
|
|
|
|
|
|
|
|
|
|
|
|
|
|
|
|
|
|
|
|
|
||
|
Ice-Cream |
|
|
|
|
|
|
|
|
|
|
|
|
|
|
|
|
Ice-Cream |
|
|
|
|
|
|
|
|
|
|
|
|
|
|
|
|
Cone |
|
|
|
|
|
|
|
|
|
|
|
|
|
|
|
|
Cone |
|
|
|
|
|
|
|
|
|
|
|
|
|
|
|
|
$3.00 |
|
|
|
|
|
|
|
|
|
|
|
|
|
|
|
|
$3.00 |
|
|
|
|
|
|
|
|
|
|
|
|
|
|
|
|
|
|
|
|
|
|
|
|
|
|
|
|
|
|
|
|
|
|
|
|
|
|
|
|
|
|
|
|
|
|
|
||
|
2.50 |
|
|
|
|
|
|
|
|
|
|
|
|
|
|
|
|
2.50 |
|
|
|
|
|
|
|
|
|
|
|
|
|
|
|
|
|
|
|
|
|
|
|
|
|
|
|
|
|
|
|
|
|
|
|
|
|
|
|
|
|
|
|
|
|
|
|
||
|
2.00 |
|
|
|
|
|
|
|
|
|
|
|
|
|
|
|
|
2.00 |
|
|
|
|
|
|
|
|
|
|
|
|
|
|
|
|
|
|
|
|
|
|
|
|
|
|
|
|
|
|
|
|
|
|
|
|
|
|
|
|
|
|
|
|
|
|
|
||
|
1.50 |
|
|
|
|
|
|
|
|
|
|
|
|
|
|
|
|
1.50 |
|
|
|
|
|
|
|
|
|
|
|
|
|
|
|
|
|
|
|
|
|
|
|
|
|
|
|
|
|
|
|
|
|
|
|
|
|
|
|
|
|
|
|
|
|
|
|
||
|
1.00 |
|
|
|
|
|
|
|
|
|
|
|
|
|
|
|
|
1.00 |
|
|
|
|
|
|
|
|
|
|
|
|
|
|
|
|
|
|
|
|
|
|
|
|
|
|
|
|
|
|
|
|
|
|
|
|
|
|
|
|
|
|
|
|
|
|
|
||
|
0.50 |
|
|
|
|
|
|
|
|
|
|
|
|
|
|
|
|
0.50 |
|
|
|
|
|
|
|
|
|
|
|
|
|
|
|
|
|
|
|
|
|
|
|
|
|
|
|
|
|
|
|
|
|
|
|
|
|
|
|
|
|
|
|
|
|
|
|
||
|
|
|
|
|
|
|
|
|
|
|
|
|
|
|
|
|
|
|
|
|
|
|
|
|
|
|
|
|
|
|
|
|
|
|
|
|
|
|
|
|
|
|
|
|
|
|
|
|
|
|
|
|
|
|
|
|
|
|
|
|
|
|
|
|
|
|
|
|
0 1 2 |
3 4 5 6 7 8 9 10 11 12 Quantity of |
0 1 2 3 4 |
5 6 7 8 9 10 11 12 Quantity of |
|||||||||||||||||||||||||||||
|
|
|
|
|
|
|
|
|
|
|
|
|
|
|
|
Ice-Cream Cones |
|
|
|
|
|
|
|
|
|
|
|
|
|
|
Ice-Cream Cones |
||
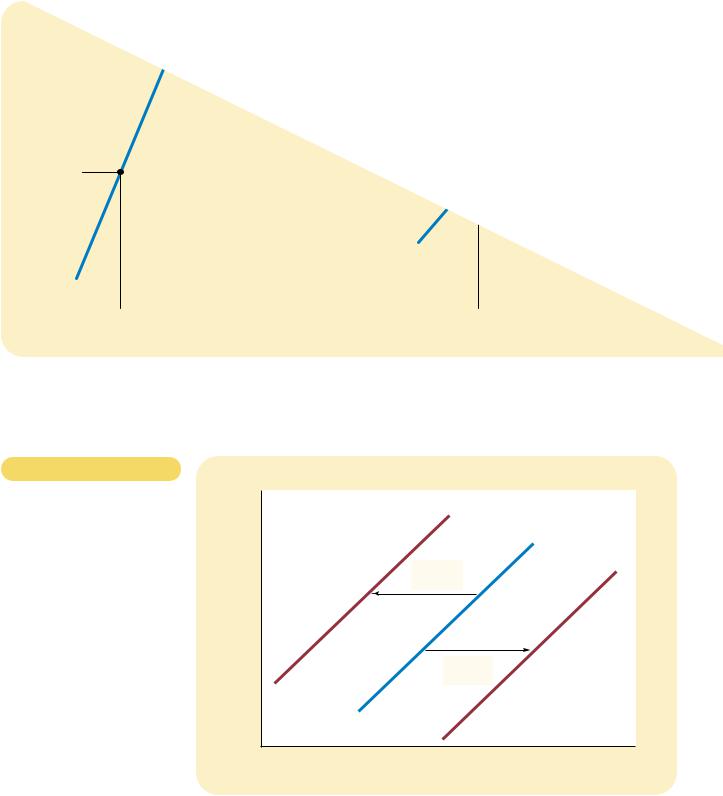
Figur e 4-7
SHIFTS IN THE SUPPLY CURVE.
Any change that raises the quantity that sellers wish to produce at a given price shifts the supply curve to the right. Any change that lowers the quantity that sellers wish to produce at a given price shifts the supply curve to the left.
Price of |
|
|
Ice-Cream |
Supply curve, S3 |
|
Cone |
|
Supply |
|
|
curve, S1 |
|
|
Supply |
|
Decrease |
curve, S2 |
|
|
|
|
in supply |
|
|
Increase |
|
|
in supply |
|
0 |
Quantity of |
|
Ice-Cream Cones |

CHAPTER 4 THE MARKET FORCES OF SUPPLY AND DEMAND |
79 |
|
Market Supply |
Figur e 4-6 |
|
Price of
Ice-Cream
Cone
$3.00
2.50
2.00
1.50
1.00
0.50
0 1 2 3 4 5 6 7 8 |
9 10 11 12 Quantity of |
( 3 4) |
Ice-Cream Cones |
MARKET SUPPLY AS THE SUM OF
INDIVIDUAL SUPPLIES. The
market supply curve is found by adding horizontally the individual supply curves. At a price of $2, Ben supplies 3 icecream cones, and Jerry supplies 4 ice-cream cones. The quantity supplied in the market at this price is 7 cones.
VARIABLES THAT AFFECT |
|
QUANTITY SUPPLIED |
A CHANGE IN THIS VARIABLE . . . |
|
|
Price |
Represents a movement along the supply curve |
Input prices |
Shifts the supply curve |
Technology |
Shifts the supply curve |
Expectations |
Shifts the supply curve |
Number of sellers |
Shifts the supply curve |
Table 4-6
THE DETERMINANTS OF QUANTITY SUPPLIED. This table
lists the variables that can influence the quantity supplied in a market. Notice the special role that price plays: A change in the price represents a movement along the supply curve, whereas a change in one of the other variables shifts the supply curve.
Table 4-6 lists the variables that determine the quantity supplied in a market and how a change in the variable affects the supply curve. Once again, price plays a special role in the table. Because price is on the vertical axis when we graph a supply curve, a change in price does not shift the curve but represents a movement along it. By contrast, when there is a change in input prices, technology, expectations, or the number of sellers, the quantity supplied at each price changes; this is represented by a shift in the supply curve.
In summary, the supply curve shows what happens to the quantity supplied of a good when its price varies, holding constant all other determinants of quantity supplied. When one of these other determinants changes, the supply curve shifts.
80 |
PART TWO SUPPLY AND DEMAND I: HOW MARKETS WORK |
QUICK QUIZ: List the determinants of the quantity of pizza supplied.
Make up an example of a supply schedule for pizza, and graph the implied supply curve. Give an example of something that would shift this supply curve. Would a change in the price of pizza shift this supply curve?
SUPPLY AND DEMAND TOGETHER
equilibrium
a situation in which supply and demand have been brought into balance
equilibrium price
the price that balances supply and demand
equilibrium quantity the quantity supplied and the
quantity demanded when the price has adjusted to balance supply and demand
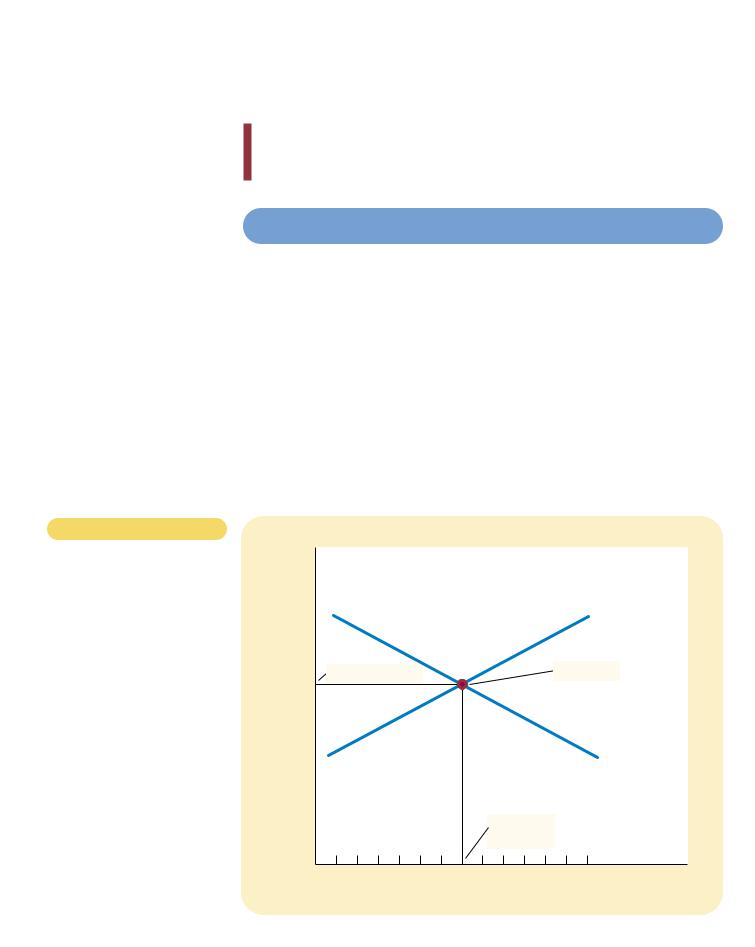
Figur e 4-8
THE EQUILIBRIUM OF SUPPLY
AND DEMAND. The equilibrium is found where the supply and demand curves intersect. At the equilibrium price, the quantity supplied equals the quantity demanded. Here the equilibrium price is $2: At this price, 7 icecream cones are supplied, and
7 ice-cream cones are demanded.
Having analyzed supply and demand separately, we now combine them to see how they determine the quantity of a good sold in a market and its price.
EQUILIBRIUM
Figure 4-8 shows the market supply curve and market demand curve together. Notice that there is one point at which the supply and demand curves intersect; this point is called the market’s equilibrium. The price at which these two curves cross is called the equilibrium price, and the quantity is called the equilibrium quantity. Here the equilibrium price is $2.00 per cone, and the equilibrium quantity is 7 ice-cream cones.
Price of
Ice-Cream
Cone
Supply
Equilibrium price |
Equilibrium |
$2.00
Demand
Equilibrium quantity
0 1 2 3 4 5 6 7 8 9 10 11 12 13 |
Quantity of |
|
Ice-Cream Cones |
CHAPTER 4 THE MARKET FORCES OF SUPPLY AND DEMAND |
81 |
equilibrium price, the quantity of the good that buyers are willing and able to buy exactly balances the quantity that sellers are willing and able to sell. The equilibrium price is sometimes called the market-clearing price because, at this price, everyone in the market has been satisfied: Buyers have bought all they want to buy, and sellers have sold all they want to sell.
The actions of buyers and sellers naturally move markets toward the equilibrium of supply and demand. To see why, consider what happens when the market price is not equal to the equilibrium price.
Suppose first that the market price is above the equilibrium price, as in panel
(a)of Figure 4-9. At a price of $2.50 per cone, the quantity of the good supplied (10 cones) exceeds the quantity demanded (4 cones). There is a surplus of the good: Suppliers are unable to sell all they want at the going price. When there is a surplus in the ice-cream market, for instance, sellers of ice cream find their freezers increasingly full of ice cream they would like to sell but cannot. They respond to the surplus by cutting their prices. Prices continue to fall until the market reaches the equilibrium.
Suppose now that the market price is below the equilibrium price, as in panel
(b)of Figure 4-9. In this case, the price is $1.50 per cone, and the quantity of the good demanded exceeds the quantity supplied. There is a shortage of the good: Demanders are unable to buy all they want at the going price. When a shortage occurs in the ice-cream market, for instance, buyers have to wait in long lines for a chance to buy one of the few cones that are available. With too many buyers chasing too few goods, sellers can respond to the shortage by raising their prices without losing sales. As prices rise, the market once again moves toward the equilibrium.
Thus, the activities of the many buyers and sellers automatically push the market price toward the equilibrium price. Once the market reaches its equilibrium, all buyers and sellers are satisfied, and there is no upward or downward pressure on the price. How quickly equilibrium is reached varies from market to market, depending on how quickly prices adjust. In most free markets, however, surpluses and shortages are only temporary because prices eventually move toward their equilibrium levels. Indeed, this phenomenon is so pervasive that it is sometimes called the law of supply and demand: The price of any good adjusts to bring the supply and demand for that good into balance.
surplus
a situation in which quantity supplied is greater than quantity demanded
shor tage
a situation in which quantity demanded is greater than quantity supplied
law of supply and demand the claim that the price of any good adjusts to bring the supply and demand for that good into balance
THREE STEPS TO ANALYZING CHANGES IN EQUILIBRIUM
So far we have seen how supply and demand together determine a market’s equilibrium, which in turn determines the price of the good and the amount of the good that buyers purchase and sellers produce. Of course, the equilibrium price and quantity depend on the position of the supply and demand curves. When some event shifts one of these curves, the equilibrium in the market changes. The analysis of such a change is called comparative statics because it involves comparing two static situations—an old and a new equilibrium.
When analyzing how some event affects a market, we proceed in three steps. First, we decide whether the event shifts the supply curve, the demand curve, or in some cases both curves. Second, we decide whether the curve shifts to the right or to the left. Third, we use the supply-and-demand diagram to examine how the
82 |
PART TWO SUPPLY AND DEMAND I: HOW MARKETS WORK |
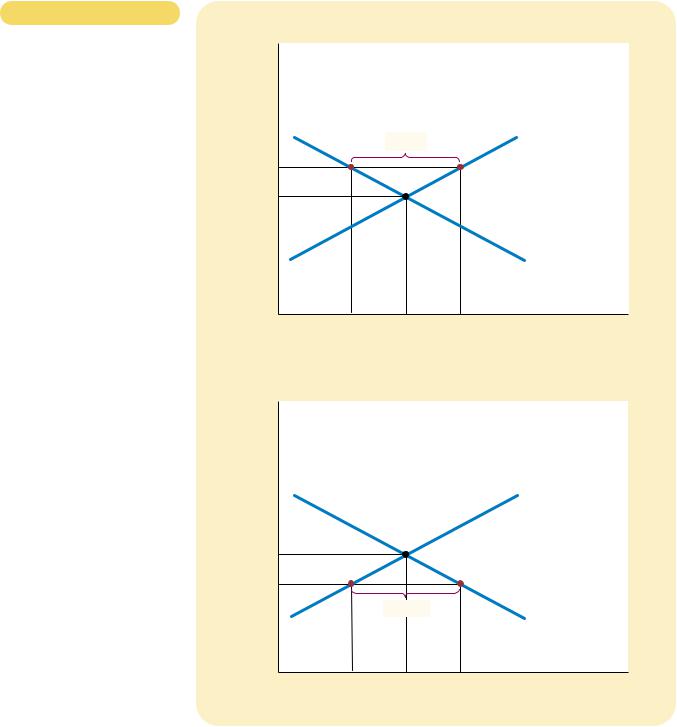
Figur e 4-9
MARKETS NOT IN EQUILIBRIUM.
In panel (a), there is a surplus. Because the market price of $2.50 is above the equilibrium price, the quantity supplied (10 cones) exceeds the quantity demanded (4 cones). Suppliers try to increase sales by cutting the price of a cone, and this moves the price toward its equilibrium level. In panel (b), there is a shortage. Because the market price of $1.50 is below the equilibrium price, the quantity demanded (10 cones) exceeds the quantity supplied (4 cones). With too many buyers chasing too few goods, suppliers can take advantage of the shortage by raising the price. Hence, in both cases, the price adjustment moves the market toward the equilibrium of supply and demand.
(a) Excess Supply
Price of
Ice-Cream
Cone
Surplus |
Supply |
|
$2.50
2.00
Demand
0 |
4 |
7 |
10 |
Quantity of |
|
Quantity |
|
Quantity |
Ice-Cream Cones |
|
demanded |
|
supplied |
|
(b) Excess Demand
Price of
Ice-Cream
Cone
Supply
$2.00
1.50
Shortage
Demand
0 |
4 |
7 |
10 |
Quantity of |
|
Quantity |
|
Quantity |
Ice-Cream Cones |
|
supplied |
|
demanded |
|
CHAPTER 4 THE MARKET FORCES OF SUPPLY AND DEMAND |
83 |
shift affects the equilibrium price and quantity. Table 4-7 summarizes these three steps. To see how this recipe is used, let’s consider various events that might affect the market for ice cream.
Example: A Change in Demand Suppose that one summer the weather is very hot. How does this event affect the market for ice cream? To answer this question, let’s follow our three steps.
1.The hot weather affects the demand curve by changing people’s taste for ice cream. That is, the weather changes the amount of ice cream that people want to buy at any given price. The supply curve is unchanged because the weather does not directly affect the firms that sell ice cream.
2.Because hot weather makes people want to eat more ice cream, the demand curve shifts to the right. Figure 4-10 shows this increase in demand as the
shift in the demand curve from D1 to D2. This shift indicates that the quantity of ice cream demanded is higher at every price.
3.As Figure 4-10 shows, the increase in demand raises the equilibrium price from $2.00 to $2.50 and the equilibrium quantity from 7 to 10 cones. In other words, the hot weather increases the price of ice cream and the quantity of ice cream sold.
Shifts in Curves versus Movements along Curves Notice that when hot weather drives up the price of ice cream, the quantity of ice cream that firms supply rises, even though the supply curve remains the same. In this case, economists say there has been an increase in “quantity supplied” but no change in “supply.”
1.Decide whether the event shifts the supply curve or demand curve (or perhaps both).
2.Decide which direction the curve shifts.
3.Use the supply-and-demand diagram to see how the shift changes the equilibrium.
Table 4-7
A THREE-STEP PROGRAM FOR
ANALYZING CHANGES IN
EQUILIBRIUM
84 |
PART TWO SUPPLY AND DEMAND I: HOW MARKETS WORK |
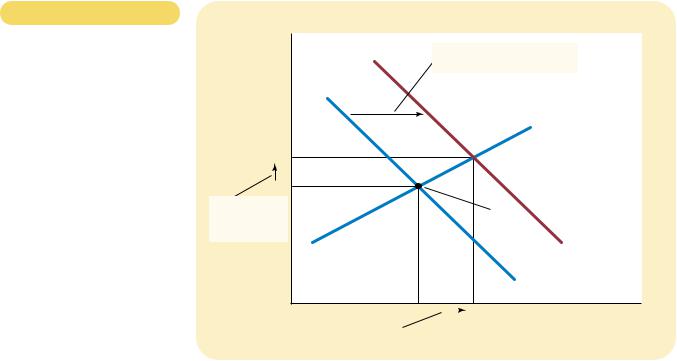
Figur e 4-10
HOW AN INCREASE IN DEMAND
AFFECTS THE EQUILIBRIUM. An
event that raises quantity demanded at any given price shifts the demand curve to the right. The equilibrium price and the equilibrium quantity both rise. Here, an abnormally hot summer causes buyers to demand more ice cream. The demand curve shifts from D1 to D2, which causes the equilibrium price to rise from $2.00 to $2.50 and the equilibrium quantity to rise from 7 to 10 cones.
Price of
Ice-Cream
Cone
$2.50
2.00
2. . . . resulting in a higher price . . .
1. Hot weather increases
the demand for ice cream . . .
Supply
 New equilibrium
Initial equilibrium
D2
D1
0 |
7 |
|
10 |
Quantity of |
|
|
|||||
|
3. . . . and a higher |
|
|
|
Ice-Cream Cones |
|
quantity sold. |
|
|
|
|
|
|
|
|
|
|
“Supply” refers to the position of the supply curve, whereas the “quantity supplied” refers to the amount suppliers wish to sell. In this example, supply does not change because the weather does not alter firms’ desire to sell at any given price. Instead, the hot weather alters consumers’ desire to buy at any given price and thereby shifts the demand curve. The increase in demand causes the equilibrium price to rise. When the price rises, the quantity supplied rises. This increase in quantity supplied is represented by the movement along the supply curve.
To summarize, a shift in the supply curve is called a “change in supply,” and a shift in the demand curve is called a “change in demand.” A movement along a fixed supply curve is called a “change in the quantity supplied,” and a movement along a fixed demand curve is called a “change in the quantity demanded.”
Example: A Change in Supply Suppose that, during another summer, an earthquake destroys several ice-cream factories. How does this event affect the market for ice cream? Once again, to answer this question, we follow our three steps.
1.The earthquake affects the supply curve. By reducing the number of sellers, the earthquake changes the amount of ice cream that firms produce and sell at any given price. The demand curve is unchanged because the earthquake does not directly change the amount of ice cream households wish to buy.
2.The supply curve shifts to the left because, at every price, the total amount that firms are willing and able to sell is reduced. Figure 4-11 illustrates this decrease in supply as a shift in the supply curve from S1 to S2.