

principles_of_economics_gregory_mankiw
.pdfCHAPTER 2 THINKING LIKE AN ECONOMIST |
23 |
are not actual human bodies, and no one would mistake the model for a real person. These models are stylized, and they omit many details. Yet despite this lack of realism—indeed, because of this lack of realism—studying these models is useful for learning how the human body works.
Economists also use models to learn about the world, but instead of being made of plastic, they are most often composed of diagrams and equations. Like a biology teacher’s plastic model, economic models omit many details to allow us to see what is truly important. Just as the biology teacher’s model does not include all of the body’s muscles and capillaries, an economist’s model does not include every feature of the economy.
As we use models to examine various economic issues throughout this book, you will see that all the models are built with assumptions. Just as a physicist begins the analysis of a falling marble by assuming away the existence of friction, economists assume away many of the details of the economy that are irrelevant for studying the question at hand. All models—in physics, biology, or economics— simplify reality in order to improve our understanding of it.
OUR FIRST MODEL: THE CIRCULAR-FLOW DIAGRAM
The economy consists of millions of people engaged in many activities—buying, selling, working, hiring, manufacturing, and so on. To understand how the economy works, we must find some way to simplify our thinking about all these activities. In other words, we need a model that explains, in general terms, how the economy is organized and how participants in the economy interact with one another.
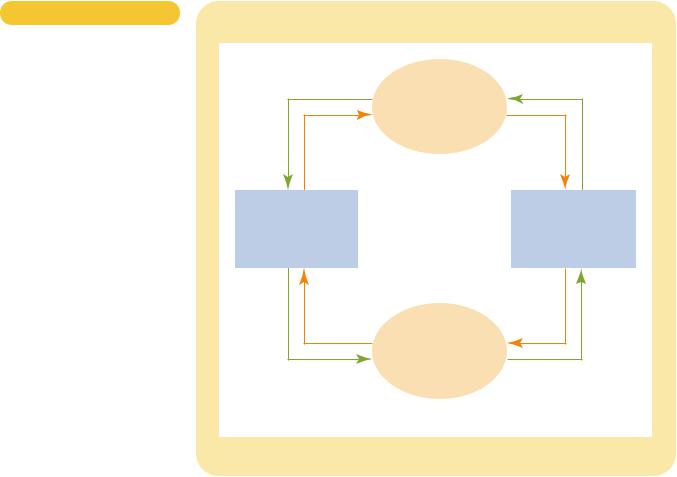
Figure 2-1 presents a visual model of the economy, called a circular-flow diagram. In this model, the economy has two types of decisionmakers—house- holds and firms. Firms produce goods and services using inputs, such as labor, land, and capital (buildings and machines). These inputs are called the factors of production. Households own the factors of production and consume all the goods and services that the firms produce.
Households and firms interact in two types of markets. In the markets for goods and services, households are buyers and firms are sellers. In particular, households buy the output of goods and services that firms produce. In the markets for the factors of production, households are sellers and firms are buyers. In these markets, households provide firms the inputs that the firms use to produce goods and services. The circular-flow diagram offers a simple way of organizing all the economic transactions that occur between households and firms in the economy.
The inner loop of the circular-flow diagram represents the flows of goods and services between households and firms. The households sell the use of their labor, land, and capital to the firms in the markets for the factors of production. The firms then use these factors to produce goods and services, which in turn are sold to households in the markets for goods and services. Hence, the factors of production flow from households to firms, and goods and services flow from firms to households.
The outer loop of the circular-flow diagram represents the corresponding flow of dollars. The households spend money to buy goods and services from the firms. The firms use some of the revenue from these sales to pay for the factors of
cir cular-flow diagram
a visual model of the economy that shows how dollars flow through markets among households and firms
24 PART ONE INTRODUCTION
Figur e 2-1
THE CIRCULAR FLOW. This
diagram is a schematic representation of the organization of the economy. Decisions are made by households and firms. Households and firms interact in the markets for goods and services (where households are buyers and firms are sellers) and in the markets for the factors of production (where firms are buyers and households are sellers). The outer set of arrows shows the flow of dollars, and the inner set of arrows shows the corresponding flow of goods and services.
|
|
MARKETS |
|
|
Revenue |
|
FOR |
Spending |
|
|
GOODS AND SERVICES |
|
||
Goods |
• |
Firms sell |
Goods and |
|
• Households buy |
||||
and services |
services |
|||
|
|
|||
sold |
|
|
bought |
|
FIRMS
•Produce and sell goods and services
•Hire and use factors of production
Inputs for production
Wages, rent, and profit
MARKETS
FOR
FACTORS OF PRODUCTION
•Households sell
•Firms buy
HOUSEHOLDS
•Buy and consume goods and services
•Own and sell factors of production
Labor, land, and capital
Income
 Flow of goods and services
 Flow of dollars
production, such as the wages of their workers. What’s left is the profit of the firm owners, who themselves are members of households. Hence, spending on goods and services flows from households to firms, and income in the form of wages, rent, and profit flows from firms to households.
Let’s take a tour of the circular flow by following a dollar bill as it makes its way from person to person through the economy. Imagine that the dollar begins at a household, sitting in, say, your wallet. If you want to buy a cup of coffee, you take the dollar to one of the economy’s markets for goods and services, such as your local Starbucks coffee shop. There you spend it on your favorite drink. When the dollar moves into the Starbucks cash register, it becomes revenue for the firm. The dollar doesn’t stay at Starbucks for long, however, because the firm uses it to buy inputs in the markets for the factors of production. For instance, Starbucks might use the dollar to pay rent to its landlord for the space it occupies or to pay the wages of its workers. In either case, the dollar enters the income of some household and, once again, is back in someone’s wallet. At that point, the story of the economy’s circular flow starts once again.
The circular-flow diagram in Figure 2-1 is one simple model of the economy. It dispenses with details that, for some purposes, are significant. A more complex
CHAPTER 2 THINKING LIKE AN ECONOMIST |
25 |
and realistic circular-flow model would include, for instance, the roles of government and international trade. Yet these details are not crucial for a basic understanding of how the economy is organized. Because of its simplicity, this circular-flow diagram is useful to keep in mind when thinking about how the pieces of the economy fit together.
OUR SECOND MODEL: THE PRODUCTION
POSSIBILITIES FRONTIER
Most economic models, unlike the circular-flow diagram, are built using the tools |
|
of mathematics. Here we consider one of the simplest such models, called the pro- |
|
duction possibilities frontier, and see how this model illustrates some basic eco- |
|
nomic ideas. |
|
Although real economies produce thousands of goods and services, let’s imag- |
|
ine an economy that produces only two goods—cars and computers. Together the |
|
car industry and the computer industry use all of the economy’s factors of pro- |
|
duction. The production possibilities frontier is a graph that shows the various |
production possibilities |
combinations of output—in this case, cars and computers—that the economy can |
frontier |
possibly produce given the available factors of production and the available pro- |
a graph that shows the combinations |
duction technology that firms can use to turn these factors into output. |
of output that the economy can |
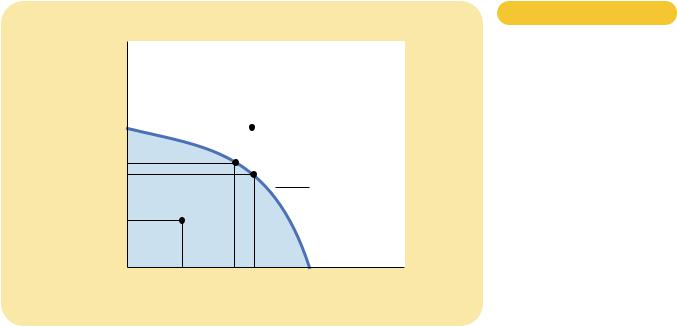
Figure 2-2 is an example of a production possibilities frontier. In this economy, |
possibly produce given the available |
if all resources were used in the car industry, the economy would produce 1,000 |
factors of production and the |
cars and no computers. If all resources were used in the computer industry, the |
available production technology |
economy would produce 3,000 computers and no cars. The two end points of |
|
the production possibilities frontier represent these extreme possibilities. If the |
|
Quantity of
Computers
Produced
3,000 |
D |
|
2,200 |
C |
|
A |
||
2,000 |
||
|
Production possibilities
frontier
1,000 B
Figur e 2-2
THE PRODUCTION POSSIBILITIES
FRONTIER. The production possibilities frontier shows the combinations of output—in this case, cars and computers—that the economy can possibly produce. The economy can produce any combination on or inside the frontier. Points outside the frontier are not feasible given the economy’s resources.
0 |
300 |
600 700 |
1,000 |
Quantity of |
|
|
|
|
Cars Produced |

26 PART ONE INTRODUCTION
economy were to divide its resources between the two industries, it could produce 700 cars and 2,000 computers, shown in the figure by point A. By contrast, the outcome at point D is not possible because resources are scarce: The economy does not have enough of the factors of production to support that level of output. In other words, the economy can produce at any point on or inside the production possibilities frontier, but it cannot produce at points outside the frontier.
An outcome is said to be efficient if the economy is getting all it can from the scarce resources it has available. Points on (rather than inside) the production possibilities frontier represent efficient levels of production. When the economy is producing at such a point, say point A, there is no way to produce more of one good without producing less of the other. Point B represents an inefficient outcome. For some reason, perhaps widespread unemployment, the economy is producing less than it could from the resources it has available: It is producing only 300 cars and 1,000 computers. If the source of the inefficiency were eliminated, the economy could move from point B to point A, increasing production of both cars (to 700) and computers (to 2,000).
One of the Ten Principles of Economics discussed in Chapter 1 is that people face tradeoffs. The production possibilities frontier shows one tradeoff that society faces. Once we have reached the efficient points on the frontier, the only way of getting more of one good is to get less of the other. When the economy moves from point A to point C, for instance, society produces more computers but at the expense of producing fewer cars.
Another of the Ten Principles of Economics is that the cost of something is what you give up to get it. This is called the opportunity cost. The production possibilities frontier shows the opportunity cost of one good as measured in terms of the other good. When society reallocates some of the factors of production from the car industry to the computer industry, moving the economy from point A to point C, it gives up 100 cars to get 200 additional computers. In other words, when the economy is at point A, the opportunity cost of 200 computers is 100 cars.
Notice that the production possibilities frontier in Figure 2-2 is bowed outward. This means that the opportunity cost of cars in terms of computers depends on how much of each good the economy is producing. When the economy is using most of its resources to make cars, the production possibilities frontier is quite steep. Because even workers and machines best suited to making computers are being used to make cars, the economy gets a substantial increase in the number of computers for each car it gives up. By contrast, when the economy is using most of its resources to make computers, the production possibilities frontier is quite flat. In this case, the resources best suited to making computers are already in the computer industry, and each car the economy gives up yields only a small increase in the number of computers.
The production possibilities frontier shows the tradeoff between the production of different goods at a given time, but the tradeoff can change over time. For example, if a technological advance in the computer industry raises the number of computers that a worker can produce per week, the economy can make more computers for any given number of cars. As a result, the production possibilities frontier shifts outward, as in Figure 2-3. Because of this economic growth, society might move production from point A to point E, enjoying more computers and more cars.
The production possibilities frontier simplifies a complex economy to highlight and clarify some basic ideas. We have used it to illustrate some of the

CHAPTER 2 THINKING LIKE AN ECONOMIST |
27 |
Quantity of
Computers
Produced
4,000
3,000
2,100
2,000
A
Figur e 2-3
A SHIFT IN THE PRODUCTION
POSSIBILITIES FRONTIER. An
economic advance in the computer industry shifts the production possibilities frontier outward, increasing the number of cars and computers the economy can produce.
0 |
700 750 1,000 |
Quantity of |
|
|
Cars Produced |
concepts mentioned briefly in Chapter 1: scarcity, efficiency, tradeoffs, opportunity cost, and economic growth. As you study economics, these ideas will recur in various forms. The production possibilities frontier offers one simple way of thinking about them.
MICROECONOMICS AND MACROECONOMICS
Many subjects are studied on various levels. Consider biology, for example. Molecular biologists study the chemical compounds that make up living things. Cellular biologists study cells, which are made up of many chemical compounds and, at the same time, are themselves the building blocks of living organisms. Evolutionary biologists study the many varieties of animals and plants and how species change gradually over the centuries.
Economics is also studied on various levels. We can study the decisions of individual households and firms. Or we can study the interaction of households and firms in markets for specific goods and services. Or we can study the operation of the economy as a whole, which is just the sum of the activities of all these decisionmakers in all these markets.
The field of economics is traditionally divided into two broad subfields. Microeconomics is the study of how households and firms make decisions and how they interact in specific markets. Macroeconomics is the study of economywide phenomena. A microeconomist might study the effects of rent control on housing in New York City, the impact of foreign competition on the U.S. auto industry, or the effects of compulsory school attendance on workers’ earnings. A
micr oeconomics
the study of how households and firms make decisions and how they interact in markets
macr oeconomics the study of economy-wide
phenomena, including inflation, unemployment, and economic growth

28 PART ONE INTRODUCTION
macroeconomist might study the effects of borrowing by the federal government, the changes over time in the economy’s rate of unemployment, or alternative policies to raise growth in national living standards.
Microeconomics and macroeconomics are closely intertwined. Because changes in the overall economy arise from the decisions of millions of individuals, it is impossible to understand macroeconomic developments without considering the associated microeconomic decisions. For example, a macroeconomist might study the effect of a cut in the federal income tax on the overall production of goods and services. To analyze this issue, he or she must consider how the tax cut affects the decisions of households about how much to spend on goods and services.
Despite the inherent link between microeconomics and macroeconomics, the two fields are distinct. In economics, as in biology, it may seem natural to begin with the smallest unit and build up. Yet doing so is neither necessary nor always the best way to proceed. Evolutionary biology is, in a sense, built upon molecular biology, since species are made up of molecules. Yet molecular biology and evolutionary biology are separate fields, each with its own questions and its own methods. Similarly, because microeconomics and macroeconomics address different questions, they sometimes take quite different approaches and are often taught in separate courses.
QUICK QUIZ: In what sense is economics like a science? Draw a production possibilities frontier for a society that produces food and clothing. Show an efficient point, an inefficient point, and an infeasible point. Show the effects of a drought. Define microeconomics and macroeconomics.
THE ECONOMIST AS POLICY ADVISER
Often economists are asked to explain the causes of economic events. Why, for example, is unemployment higher for teenagers than for older workers? Sometimes economists are asked to recommend policies to improve economic outcomes. What, for instance, should the government do to improve the economic well-being of teenagers? When economists are trying to explain the world, they are scientists. When they are trying to help improve it, they are policy advisers.
POSITIVE VERSUS NORMATIVE ANALYSIS
To help clarify the two roles that economists play, we begin by examining the use of language. Because scientists and policy advisers have different goals, they use language in different ways.
For example, suppose that two people are discussing minimum-wage laws. Here are two statements you might hear:
POLLY: Minimum-wage laws cause unemployment.
NORMA: The government should raise the minimum wage.

CHAPTER 2 THINKING LIKE AN ECONOMIST |
29 |
Ignoring for now whether you agree with these statements, notice that Polly and Norma differ in what they are trying to do. Polly is speaking like a scientist: She is making a claim about how the world works. Norma is speaking like a policy adviser: She is making a claim about how she would like to change the world.
In general, statements about the world are of two types. One type, such as Polly’s, is positive. Positive statements are descriptive. They make a claim about how the world is. A second type of statement, such as Norma’s, is normative. Normative statements are prescriptive. They make a claim about how the world ought to be.
A key difference between positive and normative statements is how we judge their validity. We can, in principle, confirm or refute positive statements by examining evidence. An economist might evaluate Polly’s statement by analyzing data on changes in minimum wages and changes in unemployment over time. By contrast, evaluating normative statements involves values as well as facts. Norma’s statement cannot be judged using data alone. Deciding what is good or bad policy is not merely a matter of science. It also involves our views on ethics, religion, and political philosophy.
Of course, positive and normative statements may be related. Our positive views about how the world works affect our normative views about what policies are desirable. Polly’s claim that the minimum wage causes unemployment, if true, might lead us to reject Norma’s conclusion that the government should raise the minimum wage. Yet our normative conclusions cannot come from positive analysis alone. Instead, they require both positive analysis and value judgments.
As you study economics, keep in mind the distinction between positive and normative statements. Much of economics just tries to explain how the economy works. Yet often the goal of economics is to improve how the economy works. When you hear economists making normative statements, you know they have crossed the line from scientist to policy adviser.
ECONOMISTS IN WASHINGTON
President Harry Truman once said that he wanted to find a one-armed economist. When he asked his economists for advice, they always answered, “On the one hand, . . . . On the other hand, . . . .”
Truman was right in realizing that economists’ advice is not always straightforward. This tendency is rooted in one of the Ten Principles of Economics in Chapter 1: People face tradeoffs. Economists are aware that tradeoffs are involved in most policy decisions. A policy might increase efficiency at the cost of equity. It might help future generations but hurt current generations. An economist who says that all policy decisions are easy is an economist not to be trusted.
Truman was also not alone among presidents in relying on the advice of economists. Since 1946, the president of the United States has received guidance from the Council of Economic Advisers, which consists of three members and a staff of several dozen economists. The council, whose offices are just a few steps from the White House, has no duty other than to advise the president and to write the annual Economic Report of the President.
The president also receives input from economists in many administrative departments. Economists at the Department of Treasury help design tax policy. Economists at the Department of Labor analyze data on workers and those looking for
positive statements claims that attempt to describe the world as it is
normative statements claims that attempt to prescribe how the world should be

30 PART ONE INTRODUCTION
“Let’s switch. I’ll make the policy, you implement it, and he’ll explain it.”
work in order to help formulate labor-market policies. Economists at the Department of Justice help enforce the nation’s antitrust laws.
Economists are also found outside the administrative branch of government. To obtain independent evaluations of policy proposals, Congress relies on the advice of the Congressional Budget Office, which is staffed by economists. The Federal Reserve, the quasi-governmental institution that sets the nation’s monetary policy, employs hundreds of economists to analyze economic developments in the United States and throughout the world. Table 2-1 lists the Web sites of some of these agencies.
The influence of economists on policy goes beyond their role as advisers: Their research and writings often affect policy indirectly. Economist John Maynard Keynes offered this observation:
The ideas of economists and political philosophers, both when they are right and when they are wrong, are more powerful than is commonly understood. Indeed, the world is ruled by little else. Practical men, who believe themselves to be quite exempt from intellectual influences, are usually the slaves of some defunct economist. Madmen in authority, who hear voices in the air, are distilling their frenzy from some academic scribbler of a few years back.
Table 2-1
WEB SITES. Here are the Web sites for a few of the government agencies that are responsible for collecting economic data and making economic policy.
Department of Commerce |
www.doc.gov |
Bureau of Labor Statistics |
www.bls.gov |
Congressional Budget Office |
www.cbo.gov |
Federal Reserve Board |
www.federalreserve.gov |

CHAPTER 2 THINKING LIKE AN ECONOMIST |
31 |
Although these words were written in 1935, they remain true today. Indeed, the “academic scribbler” now influencing public policy is often Keynes himself.
QUICK QUIZ: Give an example of a positive statement and an example of a normative statement. Name three parts of government that regularly rely on advice from economists.
WHY ECONOMISTS DISAGREE
“If all economists were laid end to end, they would not reach a conclusion.” This quip from George Bernard Shaw is revealing. Economists as a group are often criticized for giving conflicting advice to policymakers. President Ronald Reagan once joked that if the game Trivial Pursuit were designed for economists, it would have 100 questions and 3,000 answers.
Why do economists so often appear to give conflicting advice to policymakers? There are two basic reasons:
Economists may disagree about the validity of alternative positive theories about how the world works.
Economists may have different values and, therefore, different normative views about what policy should try to accomplish.
Let’s discuss each of these reasons.
DIFFERENCES IN SCIENTIFIC JUDGMENTS
Several centuries ago, astronomers debated whether the earth or the sun was at the center of the solar system. More recently, meteorologists have debated whether the earth is experiencing “global warming” and, if so, why. Science is a search for understanding about the world around us. It is not surprising that as the search continues, scientists can disagree about the direction in which truth lies.
Economists often disagree for the same reason. Economics is a young science, and there is still much to be learned. Economists sometimes disagree because they have different hunches about the validity of alternative theories or about the size of important parameters.
For example, economists disagree about whether the government should levy taxes based on a household’s income or its consumption (spending). Advocates of a switch from the current income tax to a consumption tax believe that the change would encourage households to save more, because income that is saved would not be taxed. Higher saving, in turn, would lead to more rapid growth in productivity and living standards. Advocates of the current income tax believe that household saving would not respond much to a change in the tax laws. These two groups of economists hold different normative views about the tax system because they have different positive views about the responsiveness of saving to tax incentives.
32 PART ONE INTRODUCTION
DIFFERENCES IN VALUES
Suppose that Peter and Paul both take the same amount of water from the town well. To pay for maintaining the well, the town taxes its residents. Peter has income of $50,000 and is taxed $5,000, or 10 percent of his income. Paul has income of $10,000 and is taxed $2,000, or 20 percent of his income.
Is this policy fair? If not, who pays too much and who pays too little? Does it matter whether Paul’s low income is due to a medical disability or to his decision to pursue a career in acting? Does it matter whether Peter’s high income is due to a large inheritance or to his willingness to work long hours at a dreary job?
These are difficult questions on which people are likely to disagree. If the town hired two experts to study how the town should tax its residents to pay for the well, we would not be surprised if they offered conflicting advice.
This simple example shows why economists sometimes disagree about public policy. As we learned earlier in our discussion of normative and positive analysis, policies cannot be judged on scientific grounds alone. Economists give conflicting advice sometimes because they have different values. Perfecting the science of economics will not tell us whether it is Peter or Paul who pays too much.
PERCEPTION VERSUS REALITY
Because of differences in scientific judgments and differences in values, some disagreement among economists is inevitable. Yet one should not overstate the amount of disagreement. In many cases, economists do offer a united view.
Table 2-2 contains ten propositions about economic policy. In a survey of economists in business, government, and academia, these propositions were endorsed by an overwhelming majority of respondents. Most of these propositions would fail to command a similar consensus among the general public.
The first proposition in the table is about rent control. For reasons we will discuss in Chapter 6, almost all economists believe that rent control adversely affects the availability and quality of housing and is a very costly way of helping the most needy members of society. Nonetheless, many city governments choose to ignore the advice of economists and place ceilings on the rents that landlords may charge their tenants.
The second proposition in the table concerns tariffs and import quotas. For reasons we will discuss in Chapter 3 and more fully in Chapter 9, almost all economists oppose such barriers to free trade. Nonetheless, over the years, the president and Congress have chosen to restrict the import of certain goods. In 1993 the North American Free Trade Agreement (NAFTA), which reduced barriers to trade among the United States, Canada, and Mexico, passed Congress, but only by a narrow margin, despite overwhelming support from economists. In this case, economists did offer united advice, but many members of Congress chose to ignore it.
Why do policies such as rent control and import quotas persist if the experts are united in their opposition? The reason may be that economists have not yet convinced the general public that these policies are undesirable. One purpose of this book is to make you understand the economist’s view of these and other subjects and, perhaps, to persuade you that it is the right one.