

principles_of_economics_gregory_mankiw
.pdfPrice of
Ice-Cream
Cone
$2.50
2.00
2. . . . resulting in a higher price . . .
0
CHAPTER 4 THE MARKET FORCES OF SUPPLY AND DEMAND |
85 |
1. An earthquake reduces
the supply of ice cream . . .
S2
S1
New  equilibrium
 Initial equilibrium
|
|
|
|
Demand |
4 |
|
7 |
|
Quantity of |
|
||||
|
|
|
3. . . . and a lower |
Ice-Cream Cones |
|
|
|
quantity sold. |
|
|
|
|
|
|
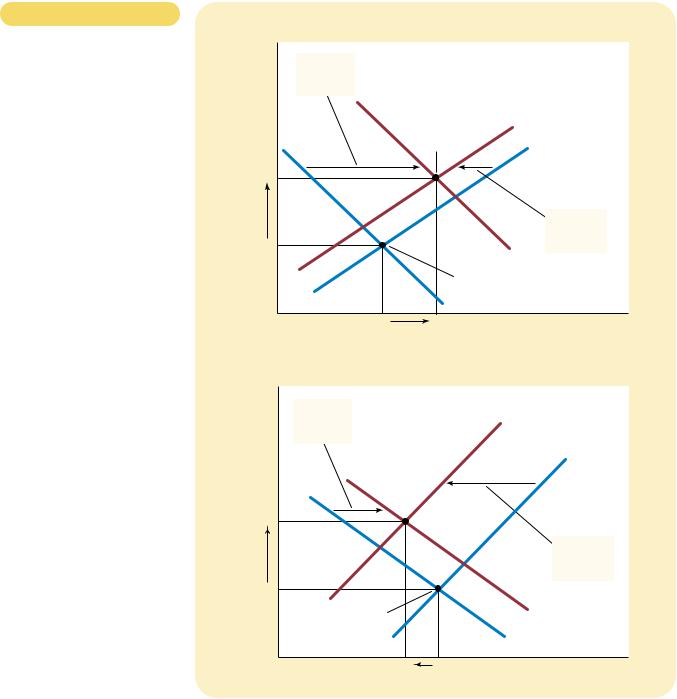
Figur e 4-11
HOW A DECREASE IN SUPPLY
AFFECTS THE EQUILIBRIUM.
An event that reduces quantity supplied at any given price shifts the supply curve to the left. The equilibrium price rises, and the equilibrium quantity falls. Here, an earthquake causes sellers to supply less ice cream. The supply curve shifts from S1 to S2, which causes the equilibrium price to rise from $2.00 to $2.50 and the equilibrium quantity to fall from 7 to 4 cones.
3.As Figure 4-11 shows, the shift in the supply curve raises the equilibrium price from $2.00 to $2.50 and lowers the equilibrium quantity from 7 to 4 cones. As a result of the earthquake, the price of ice cream rises, and the quantity of ice cream sold falls.
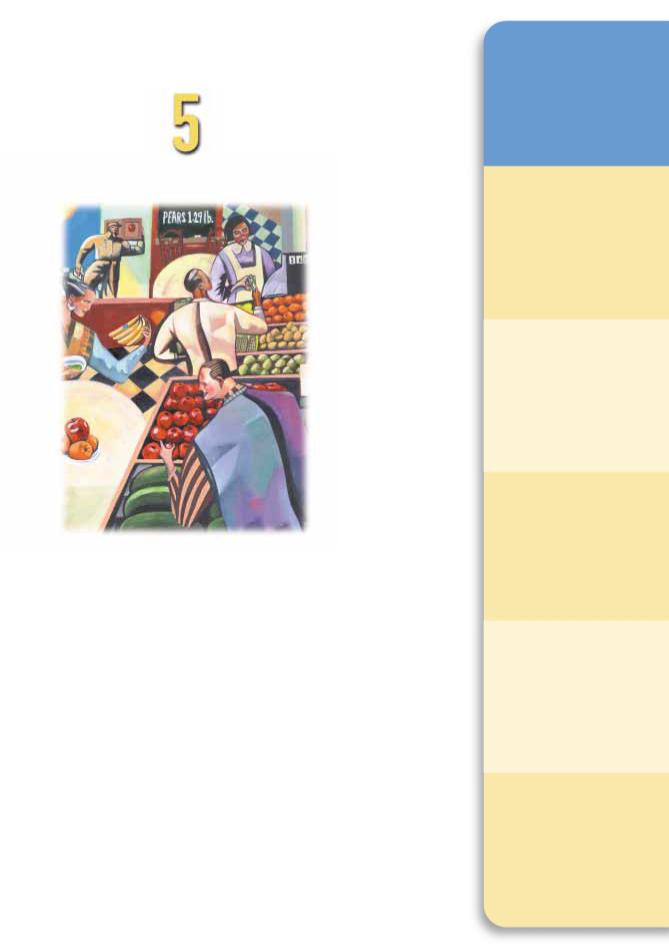
Example: A Change in Both Supply and Demand Now suppose that the hot weather and the earthquake occur at the same time. To analyze this combination of events, we again follow our three steps.
1.We determine that both curves must shift. The hot weather affects the demand curve because it alters the amount of ice cream that households want to buy at any given price. At the same time, the earthquake alters the supply curve because it changes the amount of ice cream that firms want to sell at any given price.
2.The curves shift in the same directions as they did in our previous analysis: The demand curve shifts to the right, and the supply curve shifts to the left. Figure 4-12 illustrates these shifts.
3.As Figure 4-12 shows, there are two possible outcomes that might result, depending on the relative size of the demand and supply shifts. In both cases, the equilibrium price rises. In panel (a), where demand increases substantially while supply falls just a little, the equilibrium quantity also rises. By contrast, in panel (b), where supply falls substantially while demand rises just a little, the equilibrium quantity falls. Thus, these events certainly raise the price of ice cream, but their impact on the amount of ice cream sold is ambiguous.
86 |
PART TWO SUPPLY AND DEMAND I: HOW MARKETS WORK |
Figur e 4-12
A SHIFT IN BOTH SUPPLY AND
DEMAND. Here we observe a simultaneous increase in demand and decrease in supply. Two outcomes are possible. In panel (a), the equilibrium price
rises from P1 to P2, and the equilibrium quantity rises from Q1 to Q2. In panel (b), the equilibrium price again rises
from P1 to P2, but the equilibrium quantity falls from Q1 to Q2.
|
(a) Price Rises, Quantity Rises |
|
||
Price of |
|
|
|
|
Ice-Cream |
Large |
|
|
|
Cone |
|
|
|
|
increase in |
|
|
|
|
|
|
|
|
|
|
demand |
|
|
|
|
|
|
S2 |
|
|
|
|
New |
|
|
|
equilibrium |
S1 |
|
P2 |
|
|
|
|
|
|
|
|
Small |
|
|
|
|
decrease in |
P1 |
|
|
D2 |
supply |
|
|
|
|
|
|
|
|
Initial equilibrium |
|
|
|
|
D1 |
|
0 |
Q1 |
|
Q2 |
Quantity of |
|
|
|
|
Ice-Cream Cones |
|
(b) Price Rises, Quantity Falls |
|
||
Price of |
|
|
|
|
Ice-Cream |
Small |
|
|
|
Cone |
|
S2 |
|
|
increase in |
|
|
||
|
|
|
|
|
|
demand |
|
|
|
|
|
|
|
S1 |
P2 |
|
|
New equilibrium |
|
|
|
|
|
Large |
|
|
|
|
decrease in |
|
|
|
|
supply |
P1 |
|
|
|
|
|
Initial equilibrium |
|
|
D2 |
|
|
|
D1 |
|
0 |
|
Q2 |
Q1 |
Quantity of |
|
|
|
|
Ice-Cream Cones |
Summar y We have just seen three examples of how to use supply and demand curves to analyze a change in equilibrium. Whenever an event shifts the supply curve, the demand curve, or perhaps both curves, you can use these tools to predict how the event will alter the amount sold in equilibrium and the price at which the

CHAPTER 4 THE MARKET FORCES OF SUPPLY AND DEMAND |
87 |
|
|
|
|
IN THE NEWS
Mother Nature Shifts
the Supply Curve
since a 10-day freeze in 1990. Farmers frantically ran wind and irrigation machines overnight to keep trees warm, but officials pronounced a near total loss in the valley, and said perhaps half of the state’s orange crop was lost as well. . . .
California grows about 80 percent of the nation’s oranges eaten as fruit, and 90 percent of lemons, and wholesalers said the retail prices of oranges could triple in the next few days. The price of lemons was certain to rise as well, but the price of orange juice should
be less affected because most juice oranges are grown in Florida.
In some California markets, wholesalers reported that the price of navel oranges had increased to 90 cents a pound on Wednesday from 35 cents on Tuesday.
SOURCE: The New York Times, December 25, 1998, p. A1.
|
|
|
|
|
|
|
|
|
|
|
|
|
Table 4-8 |
|
|
NO CHANGE |
AN INCREASE |
A DECREASE |
|
|
|
|
|
WHAT HAPPENS TO PRICE AND |
|||
|
|
IN SUPPLY |
IN SUPPLY |
IN SUPPLY |
|
|
|
NO CHANGE IN DEMAND |
P same |
P down |
P up |
|
QUANTITY WHEN SUPPLY OR |
|
|
DEMAND SHIFTS? |
||||
|
|
Q same |
Q up |
Q down |
|
|
|
|
|
|
|||
|
AN INCREASE IN DEMAND |
P up |
P ambiguous |
P up |
|
|
|
|
Q up |
Q up |
Q ambiguous |
|
|
|
A DECREASE IN DEMAND |
P down |
P down |
P ambiguous |
|
|
|
|
Q down |
Q ambiguous |
Q down |
|
|
|
|
|
|
|
|
|
good is sold. Table 4-8 shows the predicted outcome for any combination of shifts in the two curves. To make sure you understand how to use the tools of supply and demand, pick a few entries in this table and make sure you can explain to yourself why the table contains the prediction it does.

88 |
PART TWO SUPPLY AND DEMAND I: HOW MARKETS WORK |
QUICK QUIZ: Analyze what happens to the market for pizza if the price of tomatoes rises. Analyze what happens to the market for pizza if the price of hamburgers falls.
CONCLUSION: HOW PRICES ALLOCATE RESOURCES
This chapter has analyzed supply and demand in a single market. Although our discussion has centered around the market for ice cream, the lessons learned here apply in most other markets as well. Whenever you go to a store to buy something, you are contributing to the demand for that item. Whenever you look for a job, you are contributing to the supply of labor services. Because supply and demand are such pervasive economic phenomena, the model of supply and demand is a powerful tool for analysis. We will be using this model repeatedly in the following chapters.
One of the Ten Principles of Economics discussed in Chapter 1 is that markets are usually a good way to organize economic activity. Although it is still too early to judge whether market outcomes are good or bad, in this chapter we have begun to see how markets work. In any economic system, scarce resources have to be allocated among competing uses. Market economies harness the forces of supply and demand to serve that end. Supply and demand together determine the prices of the economy’s many different goods and services; prices in turn are the signals that guide the allocation of resources.
For example, consider the allocation of beachfront land. Because the amount of this land is limited, not everyone can enjoy the luxury of living by the beach. Who gets this resource? The answer is: whoever is willing and able to pay the price. The price of beachfront land adjusts until the quantity of land demanded exactly balances the quantity supplied. Thus, in market economies, prices are the mechanism for rationing scarce resources.
Similarly, prices determine who produces each good and how much is produced. For instance, consider farming. Because we need food to survive, it is crucial that some people work on farms. What determines who is a farmer and who is not? In a free society, there is no government planning agency making this decision and ensuring an adequate supply of food. Instead, the allocation of workers to farms is based on the job decisions of millions of workers. This decentralized system works well because these decisions depend on prices. The prices of food and the wages of farmworkers (the price of their labor) adjust to ensure that enough people choose to be farmers.
If a person had never seen a market economy in action, the whole idea might seem preposterous. Economies are large groups of people engaged in many interdependent activities. What prevents decentralized decisionmaking from degenerating into chaos? What coordinates the actions of the millions of people with their varying abilities and desires? What ensures that what needs to get done does in fact get done? The answer, in a word, is prices. If market economies are guided by an invisible hand, as Adam Smith famously suggested, then the price system is the baton that the invisible hand uses to conduct the economic orchestra.

CHAPTER 4 THE MARKET FORCES OF SUPPLY AND DEMAND |
89 |
“Two dollars.” |
“—and seventy-five cents.” |
Summar y
Economists use the model of supply and demand to analyze competitive markets. In a competitive market, there are many buyers and sellers, each of whom has little or no influence on the market price.
The demand curve shows how the quantity of a good demanded depends on the price. According to the law of demand, as the price of a good falls, the quantity demanded rises. Therefore, the demand curve slopes downward.
In addition to price, other determinants of the quantity demanded include income, tastes, expectations, and the prices of substitutes and complements. If one of these other determinants changes, the demand curve shifts.
The supply curve shows how the quantity of a good supplied depends on the price. According to the law of supply, as the price of a good rises, the quantity supplied rises. Therefore, the supply curve slopes upward.
In addition to price, other determinants of the quantity supplied include input prices, technology, and expectations. If one of these other determinants changes, the supply curve shifts.
The intersection of the supply and demand curves determines the market equilibrium. At the equilibrium
price, the quantity demanded equals the quantity supplied.
The behavior of buyers and sellers naturally drives markets toward their equilibrium. When the market price is above the equilibrium price, there is a surplus of the good, which causes the market price
to fall. When the market price is below the equilibrium price, there is a shortage, which causes the market price to rise.
To analyze how any event influences a market, we use the supply-and-demand diagram to examine how the event affects the equilibrium price and quantity. To do this we follow three steps. First, we decide whether the event shifts the supply curve or the demand curve (or both). Second, we decide which direction the curve shifts. Third, we compare the new equilibrium with the old equilibrium.
In market economies, prices are the signals that guide economic decisions and thereby allocate scarce resources. For every good in the economy, the price ensures that supply and demand are in balance. The equilibrium price then determines how much of the good buyers choose to purchase and how much sellers choose to produce.

90 PART TWO SUPPLY AND DEMAND I: HOW MARKETS WORK
|
Key Concepts |
|
|
|
|
market, p. 66 |
supply curve, p. 76 |
|
competitive market, p. 66 |
equilibrium, p. 80 |
|
quantity demanded, p. 67 |
equilibrium price, p. 80 |
|
law of demand, p. 68 |
equilibrium quantity, p. 80 |
|
normal good, p. 68 |
surplus, p. 81 |
|
inferior good, p. 68 |
shortage, p. 81 |
|
substitutes, p. 68 |
of supply and demand, p. 81 |
|
|
|
|
|
Questions for Review |
|
|
|
|
1.What is a competitive market? types of markets other than markets.
2.What determines the quantity of demand?
3.What are the demand schedule and how are they related? Why slope downward?
4.Does a change in consumers’ along the demand curve or a shift Does a change in price lead to a demand curve or a shift in the
5.Popeye’s income declines and, more spinach. Is spinach an good? What happens to Popeye’s spinach?
6.What determines the quantity of supply?
schedule and the supply curve, and Why does the supply curve slope
producers’ technology lead to a supply curve or a shift in the a change in price lead to a supply curve or a shift in the
of a market. Describe the forces toward its equilibrium.
complements because they are often When the price of beer rises, what
demand, quantity supplied, and the price in the market for
prices in market economies.
Problems and Applications
1.Explain each of the following statements using supply- and-demand diagrams.
a.When a cold snap hits Florida, the price of orange juice rises in supermarkets throughout the country.
b.When the weather turns warm in New England every summer, the prices of hotel rooms in Caribbean resorts plummet.
c.When a war breaks out in the Middle East, the price of gasoline rises, while the price of a used Cadillac falls.
2.“An increase in the demand for notebooks raises the quantity of notebooks demanded, but not the quantity supplied.” Is this statement true or false? Explain.
3.Consider the market for minivans. For each of the events listed here, identify which of the determinants of demand or supply are affected. Also indicate whether demand or supply is increased or decreased. Then show the effect on the price and quantity of minivans.
a. People decide to have more children.
CHAPTER 4 THE MARKET FORCES OF SUPPLY AND DEMAND |
91 |
b.A strike by steelworkers raises steel prices.
c.Engineers develop new automated machinery for the production of minivans.
d.The price of station wagons rises.
e.A stock-market crash lowers people’s wealth.
4.During the 1990s, technological advance reduced the cost of computer chips. How do you think this affected the market for computers? For computer software? For typewriters?
5.Using supply-and-demand diagrams, show the effect of the following events on the market for sweatshirts.
a.A hurricane in South Carolina damages the cotton crop.
b.The price of leather jackets falls.
c.All colleges require morning calisthenics in appropriate attire.
d.New knitting machines are invented.
6.Suppose that in the year 2005 the number of births is temporarily high. How does this baby boom affect the price of baby-sitting services in 2010 and 2020? (Hint: 5-year-olds need baby-sitters, whereas 15-year-olds can be baby-sitters.)
7.Ketchup is a complement (as well as a condiment) for hot dogs. If the price of hot dogs rises, what happens to the market for ketchup? For tomatoes? For tomato juice? For orange juice?
8.The case study presented in the chapter discussed cigarette taxes as a way to reduce smoking. Now think about the markets for other tobacco products such as cigars and chewing tobacco.
a.Are these goods substitutes or complements for cigarettes?
b.Using a supply-and-demand diagram, show what happens in the markets for cigars and chewing tobacco if the tax on cigarettes is increased.
c.If policymakers wanted to reduce total tobacco consumption, what policies could they combine with the cigarette tax?
9.The market for pizza has the following demand and supply schedules:
PRICE |
QUANTITY DEMANDED |
QUANTITY SUPPLIED |
|
|
|
$4 |
135 |
26 |
5 |
104 |
53 |
6 |
81 |
81 |
7 |
68 |
98 |
8 |
53 |
110 |
9 |
39 |
121 |
Graph the demand and supply curves. What is the equilibrium price and quantity in this market? If the actual price in this market were above the equilibrium price, what would drive the market toward the equilibrium? If the actual price in this market were below the equilibrium price, what would drive the market toward the equilibrium?
10.Because bagels and cream cheese are often eaten together, they are complements.
a.We observe that both the equilibrium price
of cream cheese and the equilibrium quantity of bagels have risen. What could be responsible for this pattern—a fall in the price of flour or a fall in the price of milk? Illustrate and explain your answer.
b.Suppose instead that the equilibrium price of cream cheese has risen but the equilibrium quantity of bagels has fallen. What could be responsible for this pattern—a rise in the price of flour or a rise
in the price of milk? Illustrate and explain your answer.
11.Suppose that the price of basketball tickets at your college is determined by market forces. Currently, the demand and supply schedules are as follows:
PRICE |
QUANTITY DEMANDED |
QUANTITY SUPPLIED |
|
|
|
$ 4 |
10,000 |
8,000 |
8 |
8,000 |
8,000 |
12 |
6,000 |
8,000 |
16 |
4,000 |
8,000 |
20 |
2,000 |
8,000 |
a.Draw the demand and supply curves. What is unusual about this supply curve? Why might this be true?
b.What are the equilibrium price and quantity of tickets?
c.Your college plans to increase total enrollment next year by 5,000 students. The additional students will have the following demand schedule:
PRICE |
QUANTITY DEMANDED |
|
|
$ 4 |
4,000 |
8 |
3,000 |
12 |
2,000 |
16 |
1,000 |
20 |
0 |
92 |
PART TWO SUPPLY AND DEMAND I: HOW MARKETS WORK |
Now add the old demand schedule and the demand schedule for the new students to calculate the new demand schedule for the entire college. What will be the new equilibrium price and quantity?
12.An article in The New York Times described a successful marketing campaign by the French champagne industry.
The article noted that “many executives felt giddy about the stratospheric champagne prices. But they also feared that such sharp price increases would cause demand to decline, which would then cause prices to plunge.” What mistake are the executives making in their analysis of the situation? Illustrate your answer with
a graph.
E L A S T I C I T Y A N D
I T S A P P L I C A T I O N
Imagine yourself as a Kansas wheat farmer. Because you earn all your income from selling wheat, you devote much effort to making your land as productive as it can be. You monitor weather and soil conditions, check your fields for pests and disease, and study the latest advances in farm technology. You know that the more wheat you grow, the more you will have to sell after the harvest, and the higher will be your income and your standard of living.
One day Kansas State University announces a major discovery. Researchers in its agronomy department have devised a new hybrid of wheat that raises the amount farmers can produce from each acre of land by 20 percent. How should you react to this news? Should you use the new hybrid? Does this discovery make you better off or worse off than you were before? In this chapter we will see that these questions can have surprising answers. The surprise will come from
IN THIS CHAPTER YOU WILL . . .
Learn the meaning of the elasticity of demand
Examine what deter mines the elasticity of demand
Learn the meaning of the elasticity of supply
Examine what deter mines the elasticity of supply
Apply the concept of elasticity in thr ee ver y dif fer ent markets
93

94 |
PART TWO SUPPLY AND DEMAND I: HOW MARKETS WORK |
elasticity
a measure of the responsiveness of quantity demanded or quantity supplied to one of its determinants
price elasticity of demand a measure of how much the quantity demanded of a good responds to a change in the price of that good, computed as the percentage change in quantity demanded divided by the percentage change in price
applying the most basic tools of economics—supply and demand—to the market for wheat.
The previous chapter introduced supply and demand. In any competitive market, such as the market for wheat, the upward-sloping supply curve represents the behavior of sellers, and the downward-sloping demand curve represents the behavior of buyers. The price of the good adjusts to bring the quantity supplied and quantity demanded of the good into balance. To apply this basic analysis to understand the impact of the agronomists’ discovery, we must first develop one more tool: the concept of elasticity. Elasticity, a measure of how much buyers and sellers respond to changes in market conditions, allows us to analyze supply and demand with greater precision.
THE ELASTICITY OF DEMAND
When we discussed the determinants of demand in Chapter 4, we noted that buyers usually demand more of a good when its price is lower, when their incomes are higher, when the prices of substitutes for the good are higher, or when the prices of complements of the good are lower. Our discussion of demand was qualitative, not quantitative. That is, we discussed the direction in which the quantity demanded moves, but not the size of the change. To measure how much demand responds to changes in its determinants, economists use the concept of elasticity.
THE PRICE ELASTICITY OF DEMAND
AND ITS DETERMINANTS
The law of demand states that a fall in the price of a good raises the quantity demanded. The price elasticity of demand measures how much the quantity demanded responds to a change in price. Demand for a good is said to be elastic if the quantity demanded responds substantially to changes in the price. Demand is said to be inelastic if the quantity demanded responds only slightly to changes in the price.
What determines whether the demand for a good is elastic or inelastic? Because the demand for any good depends on consumer preferences, the price elasticity of demand depends on the many economic, social, and psychological forces that shape individual desires. Based on experience, however, we can state some general rules about what determines the price elasticity of demand.
Necessities versus Luxuries Necessities tend to have inelastic demands, whereas luxuries have elastic demands. When the price of a visit to the doctor rises, people will not dramatically alter the number of times they go to the doctor, although they might go somewhat less often. By contrast, when the price of sailboats rises, the quantity of sailboats demanded falls substantially. The reason is that most people view doctor visits as a necessity and sailboats as a luxury. Of course, whether a good is a necessity or a luxury depends not on the intrinsic properties of the good but on the preferences of the buyer. For an avid sailor with