

Genomics: The Science and Technology Behind the Human Genome Project. |
Charles R. Cantor, Cassandra L. Smith |
|
Copyright © 1999 John Wiley & Sons, Inc. |
|
ISBNs: 0-471-59908-5 (Hardback); 0-471-22056-6 (Electronic) |
13 Finding Genes and Mutations
DETECTION OF ALTERED DNA SEQUENCES |
|
|
|
|
|
Genomic DNA maps and sequences are a means to an |
end. The end is to use this informa- |
||||
tion to understand biological |
phenomena. At |
the heart of |
most |
applications of mapping |
|
and sequencing is the search |
for altered |
DNA |
sequences. |
These |
may be sequences in- |
volved in an interesting phenotypic trait, an inherited disease, or a noninherited genetic disease due to a DNA change in somatic (nongermline) cells. The way in which maps and sequences can be used to identify altered DNA sequences very much depends on the con-
text of that alteration. Here we will briefly survey the range of applications of maps and sequences, and then we will cover a few examples in considerable depth. However, the emphasis of much of this chapter will be the development of more efficient methods to find any sequence differences between two DNA samples.
Some DNA differences are inherited. There are three levels at which we characterize inherited DNA differences. DNA maps and sequences greatly assist the finding of genes responsible for inherited diseases or other inherited traits. Once a disease gene has been identified, we attempt to develop DNA-based tests for the clinical diagnosis of disease risk. The success of these tests will depend on the complexity of the disease and normal alleles. Even before a disease gene has been identified, DNA-based analyses of linked markers can sometimes offer considerably enhanced presymptomatic or prenatal diagno-
sis, or carrier screening. Finally DNA tests, in principle, provide a way for us to look for new germline mutations, either at the level of sperm (and ova in principle, but not very easily in practice) or anytime after the creation of an embryo. These mutations are referred to, respectively, as gametic mutations and genetic mutations. The distinction is a subtle one. Any mutations that destroy the ability of a gamete to function will not be inheritable because this gamete will produce no progeny.
Some DNA differences are important at the level of organism function, but they do not affect the germ cells, so they are not passed to the offspring. Examples in normal development occur frequently in the immune system. Both the immunoglobulin genes and the
T-cell receptor genes rearrange in lymphocytes, and they also have a high degree of point mutagenesis in certain critical regions. These processes are used to generate the enormous
repertoire of immune |
diversity needed to allow the immune system |
to detect |
and combat |
a wide variety of |
foreign substances. It has been speculated |
that DNA |
rearrangements |
might also occur in other normal somatic tissues, like the brain, but thus far, evidence for any such functionally significant rearrangements is not convincing. DNA changes in abnormal development appear to be commonplace. Most cancer cells contain DNA rearrangements that somehow interfere with the normal control of cell division. As the resulting cells multiply and spread, they frequently accumulate many additional DNA alterations. Other somatic DNA differences occur when chromosomes segregate incorrectly during mitosis.
433
434 |
FINDING |
GENES |
AND |
MUTATIONS |
|
|
|
|
A final example where DNA sequence information plays an important role in clinical |
|
|
||||||
diagnosis is in infectious disease. For example, |
strain variations of viruses and bacteria |
|
|
|||||
can be of critical importance in predicting their pathogenicity. Examples include virulent |
|
|
||||||
versus nonvirulent forms of bacteria like |
Mycobacterium tuberculosis, |
and various |
drug- |
|||||
resistant |
strains of |
HIV, |
the |
virus that causes |
AIDs. Other examples are quite common |
|
|
|
in parasitic protozoa, since these organisms, like HIV, use rapid DNA sequence variation |
|
|
||||||
as a way of escaping the full surveillance of the immune system of the host. Thus DNA |
|
|
|
|||||
sequence analysis is important in understanding the |
biology of |
|
Plasmodium falciparum, |
|
||||
the organism that causes malaria, |
Trypanosoma brucii |
and |
Trypanosoma cruzii, |
which |
||||
cause sleeping sickness, and many other organisms that pose significant public health |
|
|
||||||
hazards. |
|
|
|
|
|
|
|
|
In this chapter we will describe the sorts of DNA analyses that can be done to detect |
|
|
||||||
genomic changes with present technology, and we will try to extrapolate to see what im- |
|
|
|
|||||
provements will be likely in the future. |
|
|
|
|
||||
FINDING |
GENES |
|
|
|
|
|
|
|
The approach used to find genes based on their |
location on the genetic map has been |
|
|
|||||
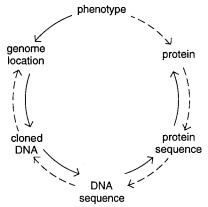
called reverse genetics, but a more accurate term is positional cloning. The basic strategy |
|
|
||||||
is to use the genetic map to approximate the position of the gene (Fig. 13.1). Then a |
|
|||||||
physical map of the region is constructed if it is not already available. The physical map |
|
|
||||||
should provide a number of potential sequence candidates for the gene of interest. It also |
|
|
||||||
helps to find additional useful polymorphic markers that narrow the location of the |
de- |
|
|
|||||
sired gene further. Ultimately one is reduced to a search for a particular set of DNA se- |
|
|
||||||
quence differences that correlates with a phenotype |
known to be directed by an allele of |
|
|
|||||
the gene. In contrast to positional cloning, genes can sometimes be found by functional |
|
|
||||||
cloning. Here an altered biochemical function is traced to an altered protein. This is se- |
|
|
||||||
quenced, and the resulting string of amino acids is scanned to find regions that allow rela- |
|
|
||||||
tively nondegenerate potential DNA coding sequences to be synthesized and used as hy- |
|
|
|
|||||
bridization probes to screen genomic or cDNA libraries. |
|
|
|
|||||
Figure 13.1 |
Contrasting stages in strategies to find genes by positional cloning (solid line) and by |
functional cloning (dashed line). Adapted from a slide displayed by Hilger Ropers.
FINDING GENES |
435 |
In the past few years there have been many dramatic successes in human positional cloning. Among these are the genes responsible for Duchenne muscular dystrophy, cystic fibrosis, some forms of familial Alzheimers disease, myotonic dystrophy, familial colon cancer, two forms of familial breast cancer, HD, one form of neurofibromatosis, and several genes involved in fragile X-linked mental retardation. Some of the ways in which the genetic map has helped locate and clone these disease genes were discussed in Chapter 6. Here we review, briefly, some of the aspects of this process, with the particular goal of showing where DNA sequencing plays a useful or necessary role. In most gene searches,
thus far there have been |
unexpected benefits in |
that interesting biological or genetic |
mechanisms became apparent |
as correlations became |
possible between genotype and |
phenotype. These serendipitous findings may have occurred because so few human disease genes were known previously. However, it is still possible that many additional basic biological surprises remain to be uncovered as much larger numbers of human disease
genes are identified. In Box 13.2 we will illustrate one of the most novel disease mecha-
nisms seen in several of these |
diseases which is caused |
by unstable |
repeating |
trinu- |
cleotide sequences. |
|
|
|
|
A successful genetic linkage |
study within a limited set |
of families is |
just the |
first step |
in the search for a gene. It reveals that there is a specific single gene involved in a particu-
lar disease or phenotype, and it provides the approximate location of |
that gene in the |
genome. However, genetic studies in the human can rarely locate a gene to |
better than 1 |
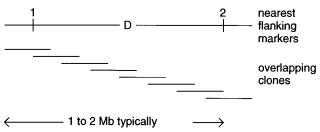
to 2 cM. In typical regions of the human genome, this corresponds to 1 to 2 Mb; the prob- |
|
lem is that such regions will usually contain 30 to 60 genes. To narrow the search, it is
usually necessary to isolate the DNA of the region (Fig. 13.2). Until the |
advent of YACs |
||||||
and other large insert cloning systems, |
this was a very |
time-consuming |
and |
costly |
|||
process. It frequently consisted of parallel attempts at chromosome microdissection and |
|
||||||
microcloning and attempts at cosmid walking or jumping from the nearest markers flank- |
|
||||||
ing the region of interest. Now these steps can usually be carried out much |
more effi- |
||||||
ciently by using the larger size YACs and mega-YACs that |
span |
most |
of |
the |
human |
|
|
genome. While these have some limitations, discussed in Chapter 9, the DNA of most re- |
|
||||||
gions is available just by a telephone call to the nearest YAC repository. |
|
|
|
|
|||
With the DNA of a particular region in hand, one can search for |
additional polymor- |
||||||
phic markers fairly efficiently. For example, simple tandem repeating sequences can be |
|||||||
selected by hybridization screening or |
sequence-specific |
purification |
methods |
(see |
|||
Chapter 14). These new markers can be used to refine the genetic map in the region. |
|||||||
However, a more effective use of nearby markers, as we discussed in Chapter 6, is to pin- |
|||||||
point the location of any recombinants in |
the region. This is |
illustrated |
in |
Figure |
13.3. |
||
Figure 13.2 Information and samples usually available at the start of the end game in the search for a disease gene.
436 FINDING GENES AND MUTATIONS
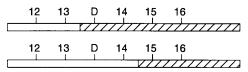
Figure |
13.3 |
The nearest recombination breaking points flank the true |
location of the gene. |
Hatched |
and hollow |
bars indicate chromosome segments inherited from different |
parental ho- |
mologs. D must lie to the right of marker 13 and to the left of marker 15. |
|
||
Before the gene of interest was successfully linked to markers, any recombinants were damaging, since they subtracted from the statistical power of the linkage tests. Now, however, once the locale of the gene is established beyond doubt, the recombinants are a very valuable resource, and it is often very profitable to search for additional recombinants. As shown in Figure 13.3, the gene location can be narrowed down to a position between the nearest set of available recombinants.
In an ideal case the gene of interest is large, and it occupies a considerable portion of the region. Then frequently a disease allele can be found that contains a large enough size polymorphism to be spotted by PFG analysis of DNA hybridized with available probes in
the region. The polymorphism may arise from an insertion, a deletion, or a translocation. Such an association of a disease phenotype with one or more large-scale rearrangements almost always rapidly pinpoints the location of the gene because finer and finer physical mapping can rapidly be employed to position the actual disrupted gene relative to the precise sites of DNA rearrangements. An example of this approach was the search for the gene for Duchenne muscular dystrophy where roughly half of the disease alleles are large deletions in the DNA of the region.
In typical cases one is not lucky enough to spot the gene of interest by using low-reso- lution mapping approaches. Then it is usually safest to take a number of different approaches simultaneously. This is especially true if, as in many cases of interest, the search for the gene is a competitive one. The genetic approach useful at this point is linkage dis-
equilibrium. This was described in detail in Chapter 6. To reiterate, briefly, if there is a founder effect, that is, if most individuals carrying a disease allele have descended from a common progenitor, they will tend to have similar alleles at other polymorphic sites in the
region. This is true even though the individuals |
have |
no apparent |
familial relationships. |
|||||
The closer one is to the gene, the |
greater the tendency of all individuals with the disease |
|||||||
to share a common haplotype. This |
gradient |
of genetic |
similarity |
allows |
one |
to |
narrow |
|
down the location of the gene, |
but there |
are |
many |
potential |
pitfalls, |
as |
described in |
|
Chapter 6. |
|
|
|
|
|
|
|
|
A second useful approach is |
to search |
for |
individuals who |
display |
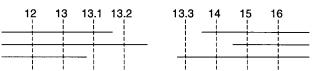
multiply genetic |
|||
disorders including the particular disease of interest. Such individuals can frequently be found, and they will often be carriers of microscopic DNA deletions. As shown in Figure 13.4, one can use these individuals to narrow the location of the gene. Low-resolution physical maps of each individual can often reveal the size and position of the deletions. Pooling data from several individuals with different deletions will indicate the boundaries
on the possible location of the gene of interest. The process is easiest in cases like X- linked disease, since here, in males, there is only one copy of the region of interest. In somatic disease, there will be two copies, and the altered chromosome will have to be distinguished and analyzed in the presence of the normal one. This general approach can be
very productive because after one gene is found, the genes for the additional inherited disorders must lie nearby, and it will be much easier to find them.
FINDING GENES |
437 |
Figure |
13.4 |
|
|
The |
nearest available chromosome breaking points, frequently seen in patients with |
|
|||||||
multiple inherited disorders, flank the true location of the gene. Horizontal lines show markers pres- |
|
||||||||||||
ent in three individuals with a common genetic disorder. The disease gene must lie between mark- |
|
||||||||||||
ers 13.2 and 13.3. |
|
|
|
|
|
|
|
|
|
||||
A third parallel approach is to map and characterize the transcripts coded for by the re- |
|
||||||||||||
gion. This can be done by using available DNA probes in hybridization against Northern |
|
||||||||||||
blots (electrophoretically fractionated mRNAs) or against cDNA libraries. If the disease is |
|
||||||||||||
believed to be predominantly localized in particular tissues, this approach can be very ef- |
|
||||||||||||
fective, since one can compare mRNAs or cDNAs from tissues believed to be significant |
|
||||||||||||
sites of expression of the gene of interest with other samples where this gene is not likely |
|
||||||||||||
to be expressed. With cystic fibrosis, for example, hypotheses about gene expression in |
|
||||||||||||
sweat glands and in the |
pancreas were |
very |
helpful in narrowing the location of the gene |
|
|||||||||
in this way. Alternatively, genes in the target region may already be known as a large num- |
|
||||||||||||
ber of expressed sequence tags (ESTs) from known tissues are being added to the EST |
|
||||||||||||
database at GenBank daily and are being mapped to chromosomal regions. Note, however, |
|
|
|||||||||||
that considerable pitfalls exist with this approach, since hypotheses about the sites of ex- |
|
||||||||||||
pression can easily be wrong, and, even if they are correct, the gene of interest may be ex- |
|
||||||||||||
pressed at too low a level to be seen as mRNA or represented in a typical cDNA library. |
|
||||||||||||
DNA of the region can be used in a number of different ways to help find the location |
|
||||||||||||
of the genes in the region, even where no prior hypotheses about sites of likely expression |
|
||||||||||||
exist. YACs |
have |
been |
used as hybridization probes to directly isolate corresponding |
|
|||||||||
mRNAs |
or |
cDNAs, |
a |
technique sometimes referred to as fishing (Lovett, 1994). |
|
||||||||
Techniques, such as exon trapping, have been developed to allow specific subcloning of |
|
||||||||||||
potentially coding DNA sequences from a region (see Box 13.1). Another frequently ef- |
|
||||||||||||
fective strategy is to look for regions of DNA that are conserved in different mammals or |
|
||||||||||||
even more distant species. Genes are far more likely to be conserved than noncoding re- |
|
||||||||||||
gions. However, this approach is not guaranteed because there is no reason to expect that |
|
||||||||||||
every gene will be conserved or even exist among a set of species tested. Even genome |
|
||||||||||||
scanning by direct sequencing has revealed the location of genes. |
|
|
|
|
|||||||||
In some types of disease, other strategies become useful. For example, in dominant |
|
||||||||||||
lethal disease, most if not all affected |
individuals are new mutations. These |
will most |
|
||||||||||
likely |
occur in regions |
of DNA with high intrinsic mutations rates. While we still have |
|
||||||||||
much to learn about how to identify such regions, at least one class of unstable DNA se- |
|
||||||||||||
quence has emerged in recent years that appears to play a major role in human disease. |
|
||||||||||||
Tandemly repeated DNA sequences have intrinsically high mutation rates because of the |
|
||||||||||||
possibilities for polymerase stuttering or unequal sister chromatid exchange, as described |
|
||||||||||||
in Chapter |
7. |
Repeats |
like (GAG) |
|
n |
occur |
in coding |
regions; |
(GAA) |
n and (GCC) |
|||
outside of coding regions. These can shrink or grow rapidly in successive generations and |
|
||||||||||||
lead to disease phenotypes. Examples of this were first seen in myotonic dystrophy, frag- |
|
||||||||||||
ile X-linked mental |
retardation, |
and |
Kennedy’s |
disease |
(see |
Box |
13.2). A systematic |
|
|||||
search |
is |
now |
underway |
to map the locations of these and |
other |
trinucleotide |
repeats, |
|
|||||
since they may well underlie the cause of |
additional human diseases. The repeats appear |
|
|||||||||||
to be fairly widespread as shown by the examples already found (see Table 13.1). |
|
|
|||||||||||
n occur

438 FINDING GENES AND MUTATIONS
BOX |
13.1 |
|
|
|
|
|
EXON |
TRAPPING |
METHODS |
|
|
|
|
Exon |
trapping |
methods |
are schemes |
for selective cloning |
and screening |
of coding |
DNA sequences. Several different approaches have been described (Duyk et al., 1990; |
||||||
Buckler et al., 1991; Hamaguchi et al., 1992). Here we will illustrate only the last of |
||||||
these |
because it |
seems |
to be relatively simple and efficient. The vector used for this |
|||
exon trapping scheme is shown in Figure 13.5 |
a . It contains intron 10 of the p53 gene, |
|||||
which includes a long pyrimidine tract (which appears to prevent exon skipping), and |
||||||
consensus sequences for |
the 5 |
- and 3 |
-splicing sites |
(AG/GTGAGT and AG, respec- |
||
tively), and the branch site (TACTCAC) used in an intermediate step in RNA splicing. |
||||||
The intron contains a |
Bgl |
II cleavage site used for cloning genomic DNA. Surrounding |
||||
the intron are two short p53 exons, flanked by SV40 promoters known to be transcrip- |
||||||
tionally active in COS-7 cells. Reverse transcriptase is used to make a cDNA copy of |
||||||
any transcripts, and then PCR with two nested sets of primers is used to detect any |
||||||
transcripts containing |
the two p53 exons. When the vector alone is transfected into |
|||||
COS-7 cells, only a 72-bp transcript is seen. Cloned inserts containing other complete |
||||||
exons will produce longer transcripts after transfection. In practice, fragments from 90 |
||||||
to 900 bp are screened for because most exons are shorter than 500 bp. These new |
||||||
fragments will arise by two splicing events as shown in Figure 13.5 |
b . For an example |
|||||
of recent results using exon trapping, see Chen et al. (1996). |
|
|||||
(continued)
FINDING GENES |
439 |
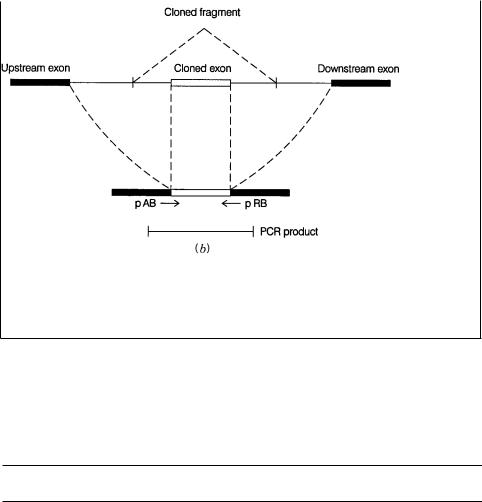
BOX 13.1 |
(Continued) |
Figure 13.5 |
Exon trapping to clone expressed DNA sequences. ( |
a ) Vector and procedures |
used. Adapted from |
Hamaguchi et al. (1992). pA, pAB, pRB, and pR are primers |
used for |
nested PCR. ( |
b ) Schematic of the PCR product expected from a cloned exon. |
|
TABLE 13.1 Trinucleotide Repeats in Human Genes
Copy
Gene or Encoded Protein |
Number |
a |
|
Location
znf6 (zinc finger transcription factor) |
|
8, 3, 3 |
5 |
Untranslated region |
CENP-B (centromere autoantigen) |
|
5 |
5 |
Untranslated region |
c- cbl (proto-oncogene) |
|
11 |
5 |
Untranslated region |
Small subunit of calcium-activated neutral protease |
10, 6 |
Coding region (N-terminal) |
|
|
CAMIII(calmodulin) |
|
6 |
5 |
Untranslated region |
BCR (breaking point cluster region) |
|
7 |
5 |
Untranslated region |
Ferritin H chain |
|
5 |
5 |
Untranslated region |
Transcription elongation factor SII |
|
7 |
5 |
Untranslated region |
Early growth response 2 protein |
5 |
Coding region (central) |
||
Androgen receptor |
17 |
|
Coding region (central) |
|
FMR-1 (fragile X disease) |
6–60 |
Not certain yet |
||
(AGC) |
n androgen receptor (Kennedy’s disease) |
13–30 |
Coding region (central) |
|
DM-1 myotonic dystrophy |
5–27 |
3 |
Untranslated region |
|
IT 15 Huntington’s disease |
11–34 |
|
Coding region (N-terminal) |
|
|
|
|
|
|
Source: |
Updated, from Sutherland and Richards (1995). |
|
|
|
a In normal individuals

440 FINDING GENES AND MUTATIONS
BOX 13.2 |
|
|
DISEASES CAUSED BY ALTERED TRINUCLEOTIDE REPEATS |
|
|
Fragile sites on chromosomes have been recognized, cytogenetically, for a long time. |
||
When cells are growth under |
metabolically impaired conditions, some |
chromosomes, |
in metaphase, show defects. |
These give the superficial appearance |
that the chromo- |
some is broken at a specific locus, as shown in Figure 13.6. Actually it is most unlikely
that a real break has occurred; instead, the chromatin has |
failed to condense normally. |
A particular fragile spot on the long arm of the human X chromosome, called fraXq27, |
|
shows a genetic association with mental retardation. About |
60% of the chromosomes |
in individuals with this syndrome show fragile sites; the |
incidence in apparently nor- |
mal individuals is only 1%. Fragile X-linked mental retardation is actually the second most common cause of inherited mental retardation. It occurs in 1 in 2000 males and 4 in 10,000 females. Earlier genetic studies of fragile X syndrome showed a number of very peculiar features that were inexplicable by any simple classical genetic mechanisms.
Now that the molecular genetics of the fragile X has been revealed, and similar events have been seen in many other diseases, including Kennedy’s disease, myotonic dystrophy, and Huntington’s disease, we can rationalize many of the unusual genetic features of these diseases. A number of fundamental issues, however, remain unresolved. The basic molecular genetic mechanism common to all four diseases and many
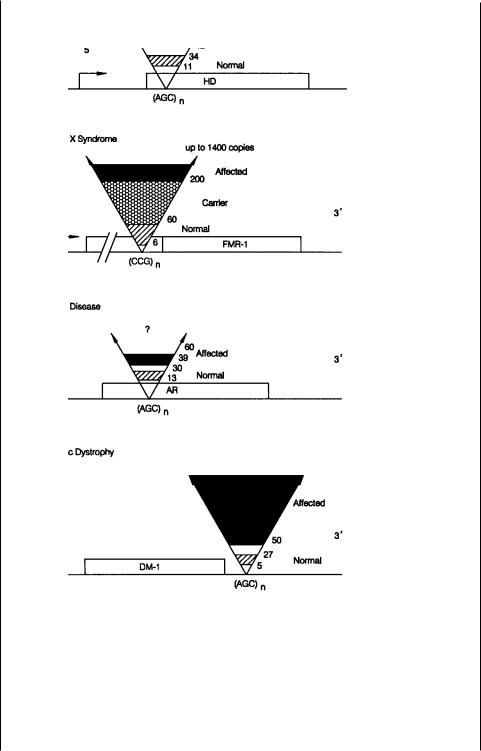
others is illustrated in Figure 13.7 (Sutherland and Richards, 1995). In each case, near or in the gene, a repeating trinucleotide sequence occurs. Like other variable number
tandem repeats (VNTRs), this sequence is polymorphic in the population. Normal in-
dividuals are observed to have relatively short repeats: 6 to 60 copies in fragile X syndrome, 13 to 30 in Kennedy’s disease, 5 to 27 copies in myotonic dystrophy, and 11 to 34 in Huntington’s. Individuals affected with the disease have much larger repeats: more than 200 copies in fragile X, more than 39 in Kennedy’s, more than 100 in myotonic dystrophy, and more than 42 in Huntington’s.
The case studied in most detail thus far is the fragile X syndrome, and this will be the focus of our attention here. Individuals who are carriers for fragile X, that is, individuals whose offspring or subsequent descendants display the fragile X phenotype,
have repeats larger than the 60 copies, which represents the maximum in the normal population, but smaller than 200, the lower bound of individuals with discernable disease phenotypes. This progressive growth in the size of the repeat, from normal to car-
Figure 13.6 Appearance of a fragile X chromosome in the light microscope.
(continued)
BOX 13.1 |
(Continued) |
FINDING GENES |
441 |
BOX 13.2 |
(Continued) |
Figure 13.7 Summary of the VNTR expansions seen in four inherited diseases. Shown are repeat sizes to normal alleles and disease-causing alleles. Adapted from Richards and Sutherland (1992).
(continued)
442 FINDING GENES AND MUTATIONS
BOX 13.2 |
(Continued) |
|
|
|
|
|
|
|
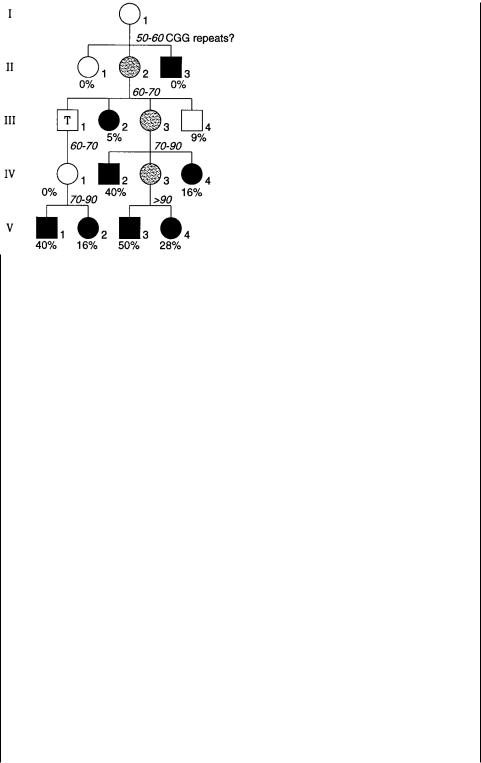
Figure 13.8 |
Typical fragile X pedigree showing anticipation and a nontransmitting carrier |
male (T). Black |
symbols denote mentally retarded individuals; gray symbols are carrier fe- |
males. Arabic number %’s are the risk of mental retardation based on the general statistics for pedigrees of this type; italic numbers are the copies of CGG repeats present in particular individuals. Adapted from Fu et al. (1991).
rier to affected, explains some of the unusual genetic features of the disease that so puzzled early investigators. Figure 13.8 shows a typical fragile X pedigree. It reveals two nonclassical genetic effects. The individual labeled T in the figure is called a nontransmitting male. He is unaffected, and yet he is an obligate carrier because two of his
grandchildren developed the disease. One of these is a male |
who |
must |
have received |
||||||
the |
disease-carrying |
chromosome from his mother. The second, |
more |
general feature |
|
||||
of |
the |
pedigree |
in |
Figure 13.8 |
is called anticipation. As the |
generations |
proceed, a |
||
higher |
percentage |
of |
all the offspring develop the disease phenotype. |
This is because |
|||||
the |
number of copies |
of the repeated |
sequence in the carriers keeps |
increasing, |
until |
||||
the repeat explodes into the full-blown disease allele. Note that in this pedigree, as is usual, the affected males do not have any offspring. This is because the disease is untreatable and severely disabling. It is effectively a genetic lethal, and thus can only ex-
ist |
at the high frequency observed because the rate of |
acquisition of new mutations |
must be high. |
|
|
|
Something about the gradual increase in the size of |
the repeat must eventually trig- |
ger |
a molecular mechanism that leads to a much greater further expansion. Thus above |
|
some critical size the sequence is genetically unstable. Figure 13.9 shows two alternate mechanisms that have been proposed to account for this instability. In the first of these,
it is |
postulated that somewhere else in the genome, there |
is a sequence that normally |
has no effect on the trinucleotide repeat. However, in a founder chromosome (one that |
||
will |
lead to the carrier state and eventually produce the |
disease) a mutation occurs in |
this |
sequence. This acts, either in cis or in trans, to destabilize the repeat, which then |
|
(continued)