

FINDING GENES |
443 |
BOX 13.2 |
(Continued) |
|
|
|
|
|
|
|
|
|
|
|
|
|
|
|
|
|
|
Figure 13.9 |
Two possible |
mechanisms for the generation of a chromosome with an unstable |
|
||||
trinucleotide repeat. ( |
a |
) A mutation affects a site outside the repeat that then acts in cis (directly) |
|
||||
or trans (by attracting some |
other component such as a protein) to |
destablize |
the |
repeat. ( |
b ) A |
||
mutation changes an |
imperfect |
repeat into a perfect one, which is |
assumed then |
to |
be intrinsi- |
|
|
cally unstable. Adapted from Richards and Sutherland (1992).
grows larger until, above some critical size, a new mechanism (some abnormality in chromatin packaging, recombination, or replication) leads to the explosive increase in
repeat size that produces the |
disease. There |
is no |
a priori |
reason |
in |
this mechanism |
why the initial mutation rate might be so high. |
|
|
|
|
|
|
The second mechanism shown |
in Figure 13.9 |
postulates |
that in |
a |
normal chromo- |
|
some, the repeat is imperfect. This somehow intereferes with processes that lead to ex-
pansion in the size of the |
repeat. If a mutation occurs that makes the sequence a per- |
||
fect trinucleotide repeat, |
a founder chromosome is created that is progressively more |
||
and more unstable as the repeat size grows. This second mechanism also explains what |
|||
is |
seen |
experimentally, and |
it may offer clues as to why the observed mutation rate is |
so |
high, |
since an imperfect |
repeat could be converted to a perfect repeat by a number |
(continued)
444 |
FINDING GENES AND MUTATIONS |
||||
BOX 13.2 |
(Continued) |
||||
of processes including unequal sister chromatid exchange or recombination, or gene |
|||||
conversion (Chapter 6). |
|||||
|
Whatever processes lead to the progressive increase in the size of the repeat, the |
||||
available data clearly show that the degree of instability is strongly affected by the size |
|||||
of the repeat. Figure 13.10 shows the distribution of repeat sizes in the normal popula- |
|||||
tion |
(where a |
few specific sizes predominant) and in carriers where a much broader |
|||
range of larger repeat sizes is seen). When the repeat size of parent and offspring is |
|||||
compared, there is a clear correlation between the size of the parental allele and the in- |
|||||
crease in size seen in the allele of the offspring. These results are shown in Figure |
|||||
13.11 for |
offspring that are still carriers and not affected. However, the effects are |
||||
much more dramatic when affected are also included. This is illustrated in Table 13.2. |
|||||
(It is impractical to include the affected in Fig. 13.11 because some fragile X disease |
|||||
alleles have more than 1000 copies of the trinucleotide repeat, which makes them diffi- |
|||||
cult to display on the same scale.) |
|||||
|
|
|
|
|
|
|
|
|
|
|
|
|
|
|
|
|
|
|
|
|
|
|
|
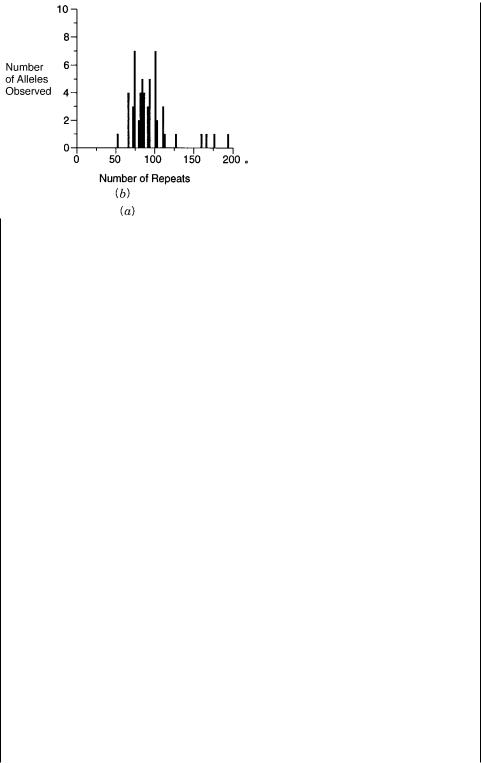
Figure 13.10 |
Distribution of CGG repeat lengths in normal individuals ( |
a ) and premutation |
carriers ( b ). Adapted from Fu et al. (1991).
(continued)

FINDING GENES |
445 |
BOX 13.2 |
(Continued) |
Figure 13.11 |
|
|
Effect of the CGG repeat length in |
the fragile X gene of an individual on the |
|
length of the corresponding repeat in an offspring of that |
individual. Adapted from Fu et al. |
|
(1991). |
|
|
The data in Table 13.2 also demonstrate that as the size of the carrier allele grows, the probability that it will convert during the next female transmission to the full disease state increases steadily until, above carrier alleles of 90 repeats, the offspring are always affected. In contrast, the expansion of the allele in male transmission is slight, explaining the existence of nontransmitting males shown in Figure 13.8. Thus some difference between male and female transmission must underlie the basic mechanism
of expansion of this allele. Repeat expansion in myotonic dystropy, like the fragile X syndrome, requires female transmission. In contrast, Huntington’s disease is more se-
vere if it is inherited as a result of male transmission. Since we know that meiotic recombination in the male and female are significantly different (Chapter 6), it is tempting to speculate that meiotic recombination hot spots may somehow be involved in the generation of these disease alleles. However, in most fragile X affected males and females, a mosaic pattern of triplet repeat sizes is seen. In adult tissues, and even in a fetus as young as 21 days, this mosaic pattern is mitotically stable. The inescapable conclusion from these findings is that expansion of the repeat occurs after fertilization, at some early stage in embryogenesis. Perhaps some form of imprinting (methylation pattern) in the X chromosome derived from the mother plays a key role in the subsequent expansion of the repeat to form the disease allele. The mosaicism of the fragile
X syndrome is also responsible for the failure of male fragile X patients to transmit the disease to their offspring. (Rare as these offspring may be, a few cases are known.) When sperm from these patients are examined, none contain the full expanded fragile
X disease allele. Either this allele interferes with some key process in spermatogenesis,
(continued)

446 FINDING GENES AND MUTATIONS
BOX 13.2 |
(Continued) |
TABLE 13.2 Comparison of Offspring’s Fragile X
Alleles with Premutation Alleles in Parents
|
|
Parental |
Child’s |
|
|
|
Allele |
Allele |
|
|
|
|
|
|
Male transmissions |
66 |
|
70, 83 |
|
|
|
86 |
100 |
|
|
|
a |
163 |
|
|
|
116 |
|
|
Female transmissions |
52 |
73 |
|
|
|
|
54 b |
58, 60, 57, 58, 52 |
|
|
|
59b |
54 |
|
|
|
66 |
73, 86, f |
|
|
|
66 |
60, 73, 110 |
|
|
|
70 |
66, 103 |
|
|
|
70 |
f, f |
|
|
|
73 |
f, f, f |
|
|
|
73 |
f, 170 c |
|
|
|
73 |
113, f |
|
|
|
77 |
f, f, f |
|
|
|
80 |
f |
|
|
|
80 |
f, f |
|
|
|
80 |
100 |
|
|
|
83 |
f, f |
|
|
|
83 |
f, f |
|
|
|
83 |
f |
|
|
|
83 |
93, f, f, f |
|
|
|
86 |
f, f, f |
|
|
|
86 |
a |
|
|
|
126/193 |
|
|
|
|
90 |
f, f |
|
|
|
90 |
f, f |
|
|
|
93 |
f, f |
|
|
|
93 |
f |
|
|
|
93 |
f, f |
|
|
|
93 |
f, f |
|
|
|
93 |
f |
|
|
|
100 |
f, f |
|
|
|
100 |
f |
|
|
|
100 |
f |
|
|
|
110 |
f, f |
|
|
|
113 |
f |
|
|
|
|
|
|
Source: Adapted from Fu et al. (1991).
Note: Numbers indicate number of CGG repeats found in each individual. Those children marked with f received a full mutation.
aThese individuals are mosaic, and the most prominent allele(s) are indicated.
bThese transmissions are in a family (CEPH 1408) with no history of fragile X syndrome; all others are fragile X chromosomes segregating in fragile X disease pedigrees.
cThis allele was measured by Southern blot analysis, and the num-
ber of repeats estimated.
(continued)

FINDING GENES |
447 |
BOX 13.2 (Continued)
or the germ cells all derive from an early embryonic presursor cell that cannot tolerate the full-blown fragile X mutation.
The actual mechanism by which the expanded fragile X allele leads to altered expression of the fragile X gene is a bit mysterious, since the expanded repeat lies outside the coding region. However, a tantalizing hit about this mechanism is provided by
the observation that in chromosomes with highly expanded triplet repeats, a nearby HTF island is hypermethylated. Furthermore severity of the illness is modulated by the degree of methylation. Under ordinary circumstances this will be associated with inactivation of gene expression. What is less obvious is the cause and effect relationship between allele expansion and the hypermethylation. For instance, some T-males have expanded repeats but not hypermethylation of the nearby CpG island. A variety of recent studies indicate that the CTG and CGG repeating sequences adopt unusual struc-
tures as duplexes, while the separated strands can form stable hairpins that can interfere with replication and lead to a number of other anamolous properties (Wells,
1996). In fact the characteristics of long repeats are so unusual that it is difficult to carry out conventional PCR amplifications of such sequences. Methods have been de-
veloped to exploit these unusual characteristics in an attempt to make the detection of new expanded repeats more efficient (Schalling et al., 1993, Broude et al., 1997).
Suppose that all of the approaches described above fail in the search for a particular disease gene. Such a case, for a long time, was Huntington’s disease. This was one of the first inherited diseases identified by linkage to polymorphic markers. However, for almost
a decade after the first evidence of |
linkage, and after extensive characterization |
of the |
DNA of the region, no specific gene had |
emerged as a strong contender for the cause of |
|
the disease. Huntington’s is a case where the disease phenotype is premature death of cer- |
||
tain cells in the brain. Thus genes with expression specific to the brain were plausible |
||
candidates, but many more indirect mechanisms could not be ruled out. Eventually the |
|
|
gene for Huntington’s was identified because a coding sequence isolated from the region |
||
by exon trapping (Box 13.1) was found to contain a polymorphic (CAG) |
n sequence. |
|
However, in less fortunate cases, unless |
particular biological hypotheses emerge that can |
|
be tested, one is left with the particularly unpalatable alternative of sequencing the DNA |
||
of the region in a set of affected and unaffected individuals. The disease allele should |
be |
|
one that is common to all affected and not common to others. The problem is that in a Mb |
|
|
region of DNA, there will be several thousand polymorphisms. Only one of these is the |
|
|
disease allele, itself. The remainder are presumably harmless, normal, silent variations in |
||
the population. |
|
|
A sensible strategy would focus on |
sequencing coding regions first, in the hope |
that |
the disease allele is directly expressed as an altered protein sequence. However, there is plenty of precedent for disease alleles that lie outside the coding region and exert their influence by altering RNA splicing or mRNA expression levels. Thus in the worst case one might have to resort, ultimately, to sequencing the entire genomic DNA of the region of interest in a set of individuals. This would not be impossible, even with existing methods, but it would be extremely costly and inefficient. The prospects of such tasks, strongly encourage the development of methods for finding and then sequencing just the differences between pairs of DNA samples. (See Chapter 14.)
448 FINDING GENES AND MUTATIONS
A few guidelines exist that can help identify particular polymorphisms that might be responsible for producing disease alleles. DNA sequence changes that disrupt protein se-
quence |
are likely to lead to significant |
disease phenotypes. Prime |
suspects are frame |
shifts |
that will cause massive changes in protein sequence, and usually premature chain |
||
termination when a stop codon in the new coding region is reached. Insertions, deletions, |
|||
and nonconservative amino acid changes are also likely suspects for causing disease. For |
|||
example, the protein collagen consists mostly |
of a extensive pro-pro-gly |
repeat, and the |
|
existence of gly every third residue is essential for proper formation of the tertiary structure of the collagen fiber. Thus any mutations of the glycine are likely to have serious consequences, and it has been observed in many inherited collagen disorders studied thus
far that mutations of these glycines are involved.
It is important not to trust any guidelines about disease alleles too strictly. It is too easy
to |
get fooled. For example, many disease alleles in familial Alzheimer’s disease turn out |
to |
be very conservative amino acid changes like isoleucine to valine. Note that disease al- |
leles that are truly catastrophic will usually not be found except in carriers for a recessive disease. The homozygous affected individuals is unlikely to survive beyond early embryogenesis and will usually not be detected because the only result will be an early, usually unnoticed, spontaneous abortion.
In several years the human genome project should provide the DNA sequence of all
human genes, including those responsible for all |
forms of inherited disease. Once all |
|
these sequence data are available, the process of |
linking specific DNA sequence alter- |
|
ations to particular diseases should become much simpler. In some |
cases comparison of |
|
DNA sequence in the human to sequences that have already been studied functionally, in |
||
the human or in other organisms, will provide |
direct clues to possible function (see |
|
Chapter 15). In many cases the DNA sequence will allow the construction of useful hy- |
||
bridization probes or PCR primers to examine |
the pattern |
of gene expression at the |
mRNA level. This will help find disease genes where the result of a DNA alteration is a change in mRNA expression at any level, including transcription efficiency or tissue distribution, splicing, or mRNA stability.
In some cases mRNA levels or other characteristics could remain essentially unaltered, even though there was a disruption in the nature of the protein product produced, or the level or cellular location of this product. In such cases the DNA sequence can be used to design peptide antigens that will elicit the production of high-affinity monoclonal antibodies specific for the protein of interest. Such powerful antigenic peptides are called immunodominant epitopes. Their location can often be predicted from the sequence, and the peptides can be synthesized automatically and used for immunization. The resulting antibodies are excellent reagents for examining the level and location of the particular protein
in specific cells or tissues. Thus, all in all, a fairly powerful arsenal of approaches is accessible for finding genes with potential functions, once DNA sequence information is available.
DIAGNOSTICS AT THE DNA LEVEL
We have discussed the role that DNA physical mapping and sequencing can play in finding genes involved in human diseases. Once such genes are found (or in more limited cases, once the approximate location of a disease gene is known), it is extremely desirable
to develop diagnostic tests for the presymptomatic disease state or for the carrier state.
|
|
|
|
|
|
|
|
|
|
|
|
DIAGNOSTICS AT |
THE DNA LEVEL |
449 |
||
There are a number of distinct advantages to the direct examination of DNA for diagnos- |
|
|
|
|||||||||||||
tics. Any cell of the body can be used to detect an inherited alteration in DNA. Thus there |
|
|
||||||||||||||
is no need to sample what may be a relatively inaccessible target tissue where the disease |
|
|
||||||||||||||
effects will be most pronounced. Since all cells will have the same alteration in DNA, |
|
|||||||||||||||
whether or not this produces a disease phenotype in these particular cells, any cells can be |
|
|
||||||||||||||
investigated. In practice, it is most convenient |
to |
use easily |
accessed samples |
like |
blood |
|
||||||||||
or epithelia sloughed off in saliva. |
|
|
|
|
|
|
|
|
|
|
|
|
|
|
|
|
In principle, diagnosis at the DNA level will be less sensitive than |
many |
tests |
at |
the |
|
|||||||||||
RNA, protein, or metabolic level. The DNA is present in only a few copies per cell; most |
|
|
||||||||||||||
RNAs and proteins or small molecules are much |
more frequent, especially |
if a cell |
in |
|
|
|||||||||||
which the gene or its products are metabolically active is selected. However, for genomic |
|
|
||||||||||||||
analysis, it turns out that the sensitivity of DNA testing is more than sufficient. This is es- |
|
|||||||||||||||
pecially true in most cases because PCR amplification can be used, and thus the samples |
|
|
||||||||||||||
of cells required can be quite modest in size. The problem is quite different when tests are |
|
|
||||||||||||||
applied to tumors or infectious diseases. Here only a small fraction of the target cells may |
|
|
||||||||||||||
have altered DNA sequences present. This demands much higher sensitivity, and some- |
|
|
|
|||||||||||||
times DNA tests may not be sensitive enough for the desired analysis, unless potentially |
|
|
||||||||||||||
affected cells or infectious agents are purified prior to PCR analysis. However, in some |
|
|||||||||||||||
cases sensitive PCR methods have |
been |
able |
to |
detect |
low |
levels |
of |
circulating |
tumor |
|
||||||
cells (Nawroz et al., 1996). |
|
|
|
|
|
|
|
|
|
|
|
|
|
|
|
|
The perfect DNA test will discriminate precisely between all normal alleles in the pop- |
|
|
||||||||||||||
ulation and all disease alleles. How close we can come to this ideal is very different for |
|
|||||||||||||||
different inherited diseases. Sickle cell anemia represents an example of the clearest case |
|
|||||||||||||||
for DNA analysis. Here the physical diagnostic criteria are clear enough that a single dis- |
|
|
||||||||||||||
ease allele in the population is responsible for the bulk |
of |
the phenotype we |
call |
sickle |
|
|||||||||||
cell disease. The actual change in the gene of HbA, the normal beta chain of hemoglobin, |
|
|
||||||||||||||
to HbS, with a single altered amino acid, occurs in a restriction site for two enzymes. Thus |
|
|||||||||||||||
the disease allele is an RFLP, and it can be analyzed this way to distinguish HbA normals, |
|
|||||||||||||||
HbA HbS carriers (sickle cell trait), and HbS individuals affected with sickle cell disease. |
|
|||||||||||||||
HbA |
|
|
|
|
|
|
|
|
|
|
|
|
||||
|
|
|
|
|
|
|
|
|
|
|
|
|
||||
CCTGAGGAG |
|
|
|
|
Bsu |
|
36 I |
CCTNAGG |
|
|||||||
HbS |
CCTGTGGAG |
|
|
|
|
Dde I |
|
|
CTNAG |
|
||||||
Alternatively, allele-specific PCR, as illustrated in Chapter 4, can be used to make the |
|
|||||||||||||||
analysis. There are other hemoglobin disorders, collectively called hemoglobinopathies, |
|
|
||||||||||||||
which produce anemia or other impairments in oxygen transport. Many of these can be |
|
|
|
|||||||||||||
successfully analyzed prenatally or in the carrier state by DNA diagnostics. A long cata- |
|
|
||||||||||||||
log of specific abnormalities with |
particular |
clinical presentations |
is |
|
now |
known. Most |
|
|||||||||
are quite rare. |
|
|
|
|
|
|
|
|
|
|
|
|
|
|
|
|
Cystic fibrosis is an example of a more complex case for DNA diagnostics. This rela- |
|
|
||||||||||||||
tively common disease is undoubtedly far more representative of |
what will be found for |
|
|
|||||||||||||
the majority of human inherited disorders, and it raises a number of severe complications. |
|
|
||||||||||||||
In cystic fibrosis, one particular disease allele, a three-base deletion, |
resulting |
in the |
|
|||||||||||||
deletion of a single, key amino acid in |
the protein chain, |
phenylalanine 508, |
accounts |
|
||||||||||||
for most of the observed disease |
cases. |
In |
populations |
of |
northern |
European extrac- |
|
|||||||||
tion, this allele occurs in about 70% of all affected individuals. (Note the implicit compli- |
|
|||||||||||||||
cation caused by the heterogeneity of |
the partially |
outbred |
human population. The |
actual |
|
|
||||||||||
450 FINDING GENES AND MUTATIONS
statistics of disease occurrence and alleles responsible are highly dependent on the particular subpopulation of origin of the individuals in question.) In this same group another 10
alleles account for about 20% more of the disease state. Hundreds of additional alleles |
|
must be considered, however, to account for all cystic fibrosis cases that have been exam- |
|
ined thus far at the DNA level. Ironically some of these produce disease that is phenotypi- |
|
cally so different from a classical cystic fibrosis presentation that until DNA analysis |
of |
this gene defect became prevalent, these cases were not even recognized as being cystic |
|
fibrosis at all. We can extrapolate and conclude that for a large gene like cystic fibrosis, |
|
the number of potential disease alleles in our population will be so large that it may never |
|
be possible to identify all of them a priori. This will certainly be the case if some are |
the |
result of new mutations.
The complexity of disease alleles at the cystic fibrosis locus leads to serious problems when prenatal or postnatal diagnosis for this disease is considered. Suppose that two nonaffected potential parents are tested for the major allele. If neither is positive, it is fairly
likely their |
offspring will be unaffected by cystic fibrosis. A negative result in a test for |
the next ten |
most likely alleles would certainly all but rule out the risk of a child with cys- |
tic fibrosis. If, instead, both parents test positively for the major allele, or for other frequent disease alleles, the risk of their producing an affected child is one in four (assuming
that the homologous allele in each is normal; otherwise, they would be affected individuals). In this case, prenatal diagnosis of a fetus conceived by this couple would be strongly indicated.
A third, not uncommon, potential outcome of genetic tests of the parents leads to a more complicated situation. Suppose that one parent tests positive for the major cystic fi- brosis allele (or other common alleles) while the second parent tests negative. There is still a small but significant chance that this second parent is a carrier for a rare disease allele. Thus a prospective child from this couple has a significant risk for cystic fibrosis. This risk can be partially assessed by performing prenatal diagnosis. If the fetus shows an
absence of all the major cystic fibrosis alleles, it is very likely that the child is safe from cystic fibrosis. However, if the fetus has inherited the detectable allele from the first par-
ent, one may really want to scrutinize the |
second parent for minor cystic fibrosis alleles. |
We need to develop much more cost-effective and accurate ways to do this. |
|
The above example illustrates a major |
benefit of genetic testing at the DNA level. In a |
family known to be segregating a disease like cystic fibrosis, the result of a fairly harmless test will, in most cases, rule out any significant chance of a child affected with the
disease. Thus the family is spared |
a great deal of unnecessary anxiety, and the child is |
spared the trauma of more invasive |
diagnostic tests. A particularly compelling case for |
such analysis which is not yet practical but will probably be doable soon is neurofibro-
matosis. This is a very unpleasant and disabling disease (the |
elephant man syndrome). |
The usual earliest clinical presentation of the disease is the |
presence, at birth, of occa- |
sional cafe au lait ( light brown pigmentation) spots. Many less severe syndromes can also |
|
result in such spots. Hence the real power of genetic tests, once available, will be to rule out the likelihood of a terrible disease in all but a small percentage of those who display these symptoms.
Genetic analysis at the DNA level becomes much more complex for dominant lethal |
|
||
diseases like neurofibromatosis. The problem, discussed earlier, is that most if not all |
of |
||
the alleles responsible for such diseases have to |
be new mutations. Unless there is a re- |
||
stricted pattern of mutation hot spots in the gene |
responsible for |
the disease, one is faced |
|
with the difficult prospect of having to search the entire |
gene for all possible |
DNA |
|

|
|
DIAGNOSTICS AT THE DNA LEVEL |
451 |
||
changes. When the enormous size of some genes is considered, |
the task |
in |
some |
cases |
|
could be truly formidable. The gene responsible for Duchenne muscular dystrophy |
has |
|
|||
more than 2.5 million bases; the coding region is more than 15 kb, and it is divided into |
|
||||
more than 50 exons. The coding regions for an early onset BRCA2, an early onset breast |
|
||||
cancer gene, cover 11,000 base pairs with 26 exons spread over 100 kb. |
|
|
|||
DNA analyses are also potentially applicable to somatic mutations such as the DNA |
|
||||
alterations seen in most kinds of cancer. Some of the types of alterations seen, which are |
|
||||
believed to be primary events in the ultimate progression that |
leads to |
tumor formation, |
|
||
are shown in Figure 13.12. Some tumor genes are dominant lethals. Once a single copy of |
|
||||
the gene responsible for cancer, an oncogene, is affected by a mutation in a somatic cell, |
|
||||
uncontrolled growth, or the accumulation of further mutations which lead, in turn, to un- |
|
||||
controlled growth, is triggered (Fig. 13.12 |
a ). In other |
cases the alleles affecting onco- |
|
||
genes are recessive. A single somatic mutation does not immediately |
lead |
to |
cancer. |
|
|
Instead, a second DNA rearrangement must occur to expose the effect of the first gene |
|
||||
(Fig. 13.12 b ). The requirement for a second hit is clear if one imagines the function of the |
|
||||
recessive oncogene to be suppression of a gene or a process that otherwise would lead to |
|
||||
uncontrolled growth. Loss of one homolog still leaves the other normal allele intact and |
|
||||
functional. However, if the normal allele is lost by a second |
event, which could |
be local |
|
||
DNA damage, a deletion, or mitotic nondisjunction, the resulting cell is now triggered for
Figure 13.12 |
DNA changes seen in various types of cancer. ( |
a ) A dominant oncogene. ( |
b ) A re- |
cessive oncogene. Reduction to homozygosity must occur by a second mutation. ( |
|
c ) In familial can- |
|
cers only one new mutation is required. |
|
|
|
452 FINDING GENES AND MUTATIONS
uncontrolled growth. This cell now has a selective advantage, and hence its progeny develop into a large population, a tumor.
Many cancers are familial: They have inherited components. Examples include a subset of the individuals affected with several common cancers like colon and breast cancer, as well as many rarer forms like retinoblastoma, a tumor of the eye, and neurofibromatosis, which we have already discussed. In inherited retinoblastoma, the child receives one defective recessive oncogene from the parents; both eyes are highly susceptible to an additional event that damages this gene. As a result bilateral tumors are common. In contrast, with the purely somatic form of the disease, two independent damage events are
needed. It is very unlikely for these to occur in both eyes; hence this form of retinoblastoma is usually unilateral.
Mutations in the DNA from many individuals affected by familial (inherited) and spontaneous (somatic) forms of several kinds of cancer have been investigated. The results for colon cancer somatic mutations seen in the adenomous polyposis coli (ApC)
gene are summarized in Table 13.13. It is evident, as expected, for such new mutations, that there are a very large number of different disease alleles. This will make it difficult to use DNA analysis to find all possible disease cases unless the entire gene can be scanned.
Mutation sites for somatic and familial colon cancer are summarized in Figure 13.13. It is apparent that no significant hot spots are seen for the somatic form. The familial form does display a hot spot area, but the actual mutations here are still widely distributed. Interestingly, regions of the gene that predominant in the familial form are different from those that are common in the somatic form. Thus the challenges of DNA analysis for this
fairly common and deadly cancer are truly formidable.
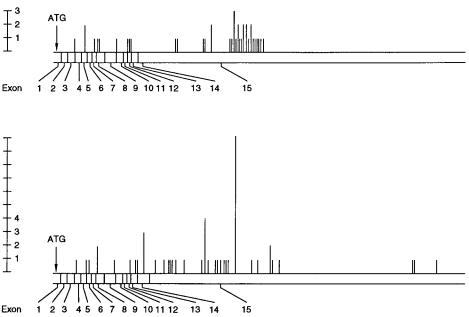
Figure 13.13 |
Locations of mutations in the APC gene, responsible for many human colon cancers. |
|
|
Shown are numbers of |
individuals found with ( |
a ) somatic mutations and ( |
b ) inherited mutations. |
Adapted from Miyoshi et al. (1992). |
|
|
|