

AutoCAD 2005 For Dummies (2004)
.pdf280 Part III: If Drawings Could Talk
It’s remotely possible that you won’t need to bother with plot styles. If the drawings you want to plot have layer and object properties (especially lineweight) that reflect how you want objects to plot, you can dispense with plot styles. But most people and most drawings use plot styles, so you should at least be familiar with them.
A couple of common reasons for using plot styles are to:
Map screen colors to plotted lineweights. If this idea seems completely loony to you, try to suspend judgment until you’ve read the “Plotting through thick and thin” section, a bit later in this chapter.
Create screened lines on monochrome plots. Lines that are screened display in various shades of gray, not black. Drafters sometimes use screened lines to de-emphasize secondary objects that otherwise would overwhelm the main objects in the drawing. Screening is expressed as a percentage, with 100% being completely black and 0% being invisible.
Using plot styles
If you want objects in your drawing to plot with properties that differ from their display properties, you need plot styles. For example, you can plot with different lineweights or colors from the ones you’re using for display purposes. Or, as I mention in the preceding section, you may need to map display colors to plotted lineweights. AutoCAD groups plot styles into plot style tables, each of which is stored in a separate file.
Color-dependent plot style tables live in Color TaBle (CTB) files and they map the 255 AutoCAD display colors to 255 plot styles. AutoCAD automatically attaches the color-dependent plot styles to every object, based on — you guessed it — the object’s color. (Are those AutoCAD programmers brilliant, or what?) Color-dependent plot style tables are especially handy for mimicking the old color-mapped-to-lineweight plotting approach of AutoCAD R14 and earlier releases; this remains the most common method in most companies.
Named plot style tables live in Style TaBle (STB) files. After you’ve created a named plot style table, you create one or more plot styles and give them any names you like. Then you can assign the named plot styles to layers or to individual objects. (See Chapter 4 for more information about object and layer properties.)
“Named” refers to the plot styles, not to the tables. Both color-dependent plot style tables and named plot style tables have names because both are stored in files and files have to have names. But color-dependent plot styles don’t have names and named plot styles do have names.
To use a plot style table, and its included plot styles (whether they’re colordependent or named), you must attach it to model space or a paper space
Chapter 12: The Plot Thickens 281
layout. The plot style table then affects plotting only for that tab. This approach lets you plot the same drawing in different ways by attaching different plot styles to different tabs.
You can attach a plot style to model space or a paper space layout by selecting its tab at the bottom of the drawing area, opening the Plot dialog box or Page Setup dialog box, and choosing the plot style table name in the Plot Style Table (Pen Assignments) area of the expanded Plot dialog box. See “Controlling plotted lineweights with screen colors,” later in this chapter, for an example.
When you start a new drawing in the usual way — that is, by using a template drawing (see Chapter 3), the template drawing’s plot style behavior determines whether you can choose CTB or STB files. (That’s why most of AutoCAD’s stock template drawings come in Color Dependent Plot Styles and Named Plot Styles versions.) If you want to change from color-dependent plot styles to named plot styles (or vice versa) in a particular drawing, use the CONVERTPSTYLES command.
The Plotting tab on the Options dialog box contains a setting called Default Plot Style Behavior For New Drawings, but it’s practically useless. It doesn’t change the current drawing and, despite its name, doesn’t even affect new drawings that you start from a template drawing.
Creating plot styles
If you’re really lucky, you won’t need to use plot styles. If you’re somewhat lucky, you’ll need to use plot styles, but someone will provide the plot style table files for you. If that’s the case, you must put the CTB or STB files in your Plot Styles folder in order for AutoCAD to recognize them. (To find the location of your Plot Styles folder, open the Options dialog box, choose the Files tab, and look for the Printer Support File Path Plot Style Table Search Path setting.)
If you’re not lucky at all, then you’ll need to be smart — that is, you’ll want to know how to create your own plot style table files. Here’s how:
1.Choose File Plot Style Manager.
The Plot Styles folder opens in a separate window.
2.Double-click the Add-A-Plot Style Table Wizard program shortcut.
3.Read the opening screen and then click Next.
4.Choose the Start From Scratch option, or one of the other three options if you want to start with settings from another file. Then click Next.
The remaining steps in this procedure assume that you chose Start From Scratch. If you chose another option, simply follow the wizard’s prompts.
282 Part III: If Drawings Could Talk
If the creator of a drawing provides you with an AutoCAD R14/AutoCAD LT 98 PC2 (version 2) or AutoCAD R12/AutoCAD LT 95 PCP (version 1) file, choose the Use A PCP Or PC2 File option. With this option, the wizard imports color-to-plotted-lineweight settings automatically.
5.Choose whether you want to create a color-dependent plot style table (CTB file) or a named plot style table (STB file). Then click Next.
Choose Color-Dependent Plot Style Table in order to map screen colors to plotted lineweights. Choose Named Plot Style Table in order to leave screen colors alone (so that the colors plot as you see them on-screen) and to create named plot styles that you can apply to layers or objects.
6.Type a name for the new CTB or STB file and then click Next.
7.Click the Plot Style Table Editor button.
The Plot Style Table Editor dialog box opens (refer to Figure 12-7).
8.If you created a color-dependent plot style table, assign Lineweight, Screening, or other plot properties to each color that’s used in the drawing. If you created a named plot style table, click the Add Style button and then assign plot properties to each of the named styles that you create.
To determine which colors are used in a drawing, switch to the AutoCAD window and open the Layer Properties Manager dialog box by clicking the Layers button located on the Object Properties toolbar.
To change a setting for all colors or named styles, select all of them first by clicking the first color or named style, holding down the Shift key, scrolling to the end of the list, and then clicking the last color or named style. Any subsequent changes you make get applied to all the selected colors or named styles.
9.Click the Save & Close button to close the Plot Style Table Editor dialog box. Then click Finish to complete the steps for the wizard.
The Plot Styles folder now displays your new CTB or STB file.
10.Close the Plot Styles folder by clicking on the X in its title bar.
Creating your first plot style table can be a harrowing experience, because you have so many options. Just remember that your most likely reason for creating one is to map screen colors to plotted lineweights (as I describe in greater detail in the next section). Also remember that you may be able to minimize your effort by getting a CTB file from the person who created the drawing that you want to plot.
In Chapter 4, I recommend that you limit yourself to the first 9 Standard AutoCAD Colors when defining layers, and not a patchwork of the 255 colors that AutoCAD makes available. If you follow my advice, your work to create a colordependent plot style table will be much reduced, because you’ll have to assign plot properties for only 9 colors, rather than worrying about 255 of them.
Chapter 12: The Plot Thickens 283
You can use \Program Files\AutoCAD 2005\Sample\Plot Screening and Fill Patterns.dwg for systematic testing of your CTB files. This drawing shows an array of color swatches for all 255 AutoCAD colors. Some of the other tabs (such as Grayscale and Screening 25%) also demonstrate how different CTB files attached to the same layout produce radically different results.
If you really get carried away and decide to take advantage of the 16 millionodd colors in AutoCAD’s True Color capability, then you’re not going to be controlling lineweights with color-dependent plot styles. CTB plot styles affect the lineweights only of objects that use the traditional 255 colors of the AutoCAD Color Index palette. If you want True Color, use object lineweights or named plot styles to control plotted lineweight.
Plotting through thick and thin
Long ago, manual drafters developed the practice of drawing lines of different thicknesses, or lineweights, in order to distinguish different kinds of objects. Manual drafters did it with different technical ink pen nib diameters or with different hardnesses of pencil lead and varying degrees of pressure on the pencil. Because a computer mouse usually doesn’t come with different diameters of mouse balls or a pressure-sensitive button, AutoCAD and its developers had to figure out how to let users indicate lineweights on-screen and on a plot. They came up with two different ways to indicate lineweight:
Mapping on-screen colors to plotted lineweights. I describe this common approach in Chapter 4.
Displaying lineweights on-screen to match what the user can expect to see on the plot. This approach was introduced in AutoCAD 2000.
Controlling plotted lineweights with object lineweights
Plotting object lineweights is trivial, assuming that the person who created the drawing took the trouble to assign lineweights to layers or objects (see Chapter 4 for details). Just make sure that the Plot Object Lineweights setting in the expanded Plot dialog box is turned on. You may also want to turn off the Plot With Plot Styles setting, because plot styles can override the object lineweights with different plotted lineweights.
As long as you turn on the Plot Object Lineweights setting, you’ll find that (those who hate cheap puns, read no further!) the plot thickens! It also thins, but that’s not as funny.
If you don’t want to plot the lineweights assigned to objects, you must turn off both the Plot Object Lineweights and Plot With Plot Styles settings in the Plot Options area of the Plot dialog box. Turning on Plot With Plot Styles turns on Plot Object Lineweights as well.
284 Part III: If Drawings Could Talk
Plotting with plodders
Color-as-color and lineweight-as-lineweight seem like great ideas, but Autodesk knew when it added object lineweights back in 1999 that longtime users of AutoCAD weren’t going to abandon the old colors-mapped-to-lineweights approach overnight. Thus, you can still control plotted lineweight by display color in AutoCAD.
AutoCAD veterans by and large have chosen to stick with their Old Way for now. They’ve done so for a variety of reasons, including inertia, plotting procedures and drawings built around the Old Way, third-party applications that don’t fully support the newer methods, and the need to exchange drawings with clients and
subcontractors who haven’t upgraded. In summary, the ripple effect of those who need to or want to continue using colors-mapped-to- lineweights is lasting a long time. Don’t be surprised if you find yourself going with the flow for awhile.
The default setting in AutoCAD 2005 is to plot object lineweights, so that’s the easiest method if you don’t have to consider the historical practices or predilections of other people with whom you exchange drawings. Mapping screen colors to lineweights requires some initial work on your part, but after you’ve set up the mapping scheme, the additional effort is minimal.
Controlling plotted lineweights with screen colors
To map screen colors to plotted lineweights, you need a color-dependent plot style table (CTB file), as I describe in the section “Plotting with style,” earlier in this chapter. If you’re plotting a drawing created by someone else, that someone else may be able to supply you with the appropriate CTB file, or at least with a PCP or PC2 file from which you can create the CTB file quickly. At the very least, the creator of the drawing should be able to give you a printed chart showing which plotted lineweight to assign to each AutoCAD screen color. Use the instructions in the “Plotting with style” section to copy or create the required CTB file.
Unfortunately, no industry-wide standards exist for mapping screen colors to plotted lineweights. Different offices do it differently. That’s why it’s so useful to receive a CTB, PCP, or PC2 file with drawings that someone sends you.
After you have the appropriate CTB file stored in your Plot Styles folder, follow these steps to use it:
1.Click the tab that you want to plot — the Model tab or the desired paper space layout tab.
2.Click the Plot button on the Standard toolbar.
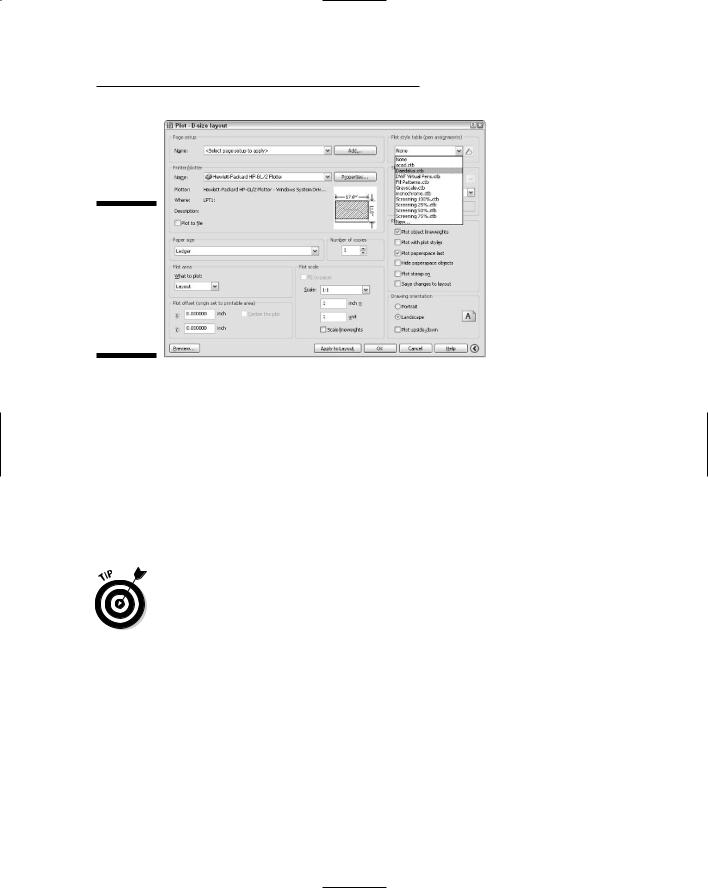
3.In the Plot Style Table (Pen Assignments) area on the expanded Plot dialog box, select the CTB file from the Name list, as shown in Figure 12-8.
This action attaches the plot style table (CTB file) to the tab that you clicked in Step 1.
Chapter 12: The Plot Thickens 285
Figure 12-8:
Selecting a plot style table that maps screen colors to plotted lineweights.
4.Click the Apply to Layout button.
AutoCAD records the plot setting change with the current tab’s configuration information. Assuming that you save the drawing, AutoCAD uses the CTB that you selected as the default plot style when you (or other people) plot that tab in the future.
5.Continue with the plotting procedures described earlier in this chapter.
If your drawing uses a named plot style table instead of a color-dependent plot style table, you follow the same procedure, except that you select an STB file instead of a CTB file in Step 3.
You can tell whether the current drawing was set up to use color-dependent plot styles or named plot styles by looking at the Properties toolbar. If the last drop-down list (Plot Style Control) is grayed out, the drawing can use color-dependent plot styles. If this list is not grayed out, the drawing can use named plot styles.
Plotting in color
Plotting the colors that you see on-screen requires no special tricks. In the absence of a plot style table (that is, if you set Plot Style Table (Pen Assignments) to None in the Plot dialog box), AutoCAD sends color information as it appears on-screen to the plotter. As long as your output device can plot in color, what you see should be what you get.
286 Part III: If Drawings Could Talk
If you attach a plot style table to the tab that you’re plotting (as described in the previous section), you can — if you really want to — map screen colors to different plotted colors. In most cases you don’t want that kind of confusion. Instead, leave the Color property in the plot style table set to Use Object Color.
If your goal is not to plot color, make sure that you set the Color property for all plot styles to Black. If you try to plot colors on a monochrome device, you may find that objects appear in various shades of gray, like in a black and white newspaper photograph, with lighter colors mapped to lighter shades of gray and darker colors to darker shades of gray. This process of mapping colors to shades of gray is called monochrome dithering, and it usually is not what you want in a CAD drawing. To override it, use the Plot Style Table Editor, as described in the section “Creating plot styles,” earlier in this chapter, to set the Color option for all colors to Black (the default setting is Use Object Color). If you don’t already have a plot style table that you want to use, choose Monochrome.ctb (for color-based plot styles) or Monochrome.stb (for named plot styles), both of which come with AutoCAD.
When in doubt, send it out
Whether you plot to scale or not, with different lineweights or not, in color or not, consider using a service bureau for some of your plotting. Inhouse plotting on your office’s output devices is great for small check plots on faster laser or inkjet printers. Large format plotting, on the other hand, can be slow and time consuming. If you need to plot lots of drawings, you may find yourself spending an afternoon loading paper, replenishing ink cartridges, and trimming sheets.
Good plotting service bureaus have big, fast, expensive plotters that you can only dream about owning. Also, they’re responsible for babysitting those fancy devices, feeding them, and fixing them. As a bonus, service bureaus can make blueline prints from your plots, if you need to distribute hard-copy sets to other people.
The only downside is that you need to coordinate with a service bureau to make sure it gets what it needs from you and can deliver the kinds of plots you need. Some service bureaus plot directly from your DWG files, while others ask you to
make PLT (plot) files. Some service bureaus specialize in color plotting, while others are more comfortable with monochrome plotting and making blueline copies.
When you’re choosing a service bureau, look for one that traditionally has served drafters, architects, and engineers. These service bureaus tend to be more knowledgeable about AutoCAD, and they should have more plotting expertise than the desktop publishing, printing, and copying shops.
Whomever you choose, do some test plots well before the day when that important set of drawings is due. Talk to the plotting people and get a copy of their plotting instructions. Have the service bureau create some plots of a couple of your typical drawings and make sure they look the way you want them to.
If you do lots of plotting with a service bureau, look into whether you can charge it to your clients as an expense (just like bluelines or copying).

Chapter 12: The Plot Thickens 287
To see the full range of AutoCAD colors available on your plotter, or to see how a particular plot style table affects plotting, plot \Program Files\AutoCAD 2005\Sample\Plot Screening and Fill Patterns.dwg. The Screening 100% layout in this drawing contains color swatches for all 255 AutoCAD colors.
It’s a (Page) Setup!
Page setups specify the plotter, paper size, and other plot settings that you use to plot a particular tab of a particular drawing. AutoCAD maintains separate page setups for model space and for each paper space model layout (that is, for each tab you see in the drawing area). When you click the Apply to Layout button in the Plot dialog box (or turn on the Save Changes to Layout setting and then click OK to plot), AutoCAD stores the current plot settings as the page setup for the current tab.
You also can give page setups names and save them. The advantage of doing so is that you can switch quickly between different plot settings and copy plot settings from one drawing tab to another. Named page setups are stored with each drawing, but you can copy them from another drawing into the current one with the Page Setup Manager dialog box (described later in this section).
If your plotting needs are simple, you don’t need to do anything special with page setups. In the Plot dialog box, just click the Apply to Layout button or turn on the Save Changes to Layout setting to save any plotting changes with the tab you’re plotting.
If you want to get fancier, you can create named page setups in order to plot the same layout (or the model tab) in different ways, or to copy plot settings from one tab to another or one drawing to another. Click the Add button in the Plot dialog box to create a named page setup from the current plot settings. After you create a named page setup, you can restore its plot settings by choosing it from the Page Setup Name list.
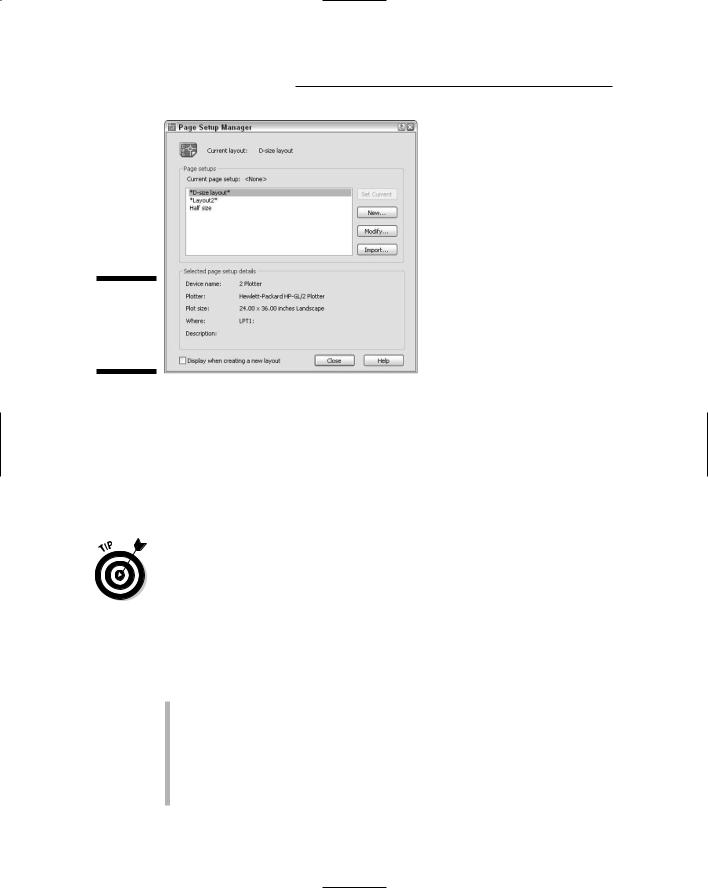
For even greater control, choose File Page Setup Manager to create, change, and copy page setups. In the Page Setup Manager dialog box, shown in Figure 12-9, you can create new page setups and modify existing ones. Click the Modify button to open the Page Setup dialog box, which is almost identical to the Plot dialog box. The primary difference is that you’re changing plot settings rather than actually plotting. The Set Current button copies the page setup that you’ve selected n the Page Setups list to the current layout tab. With the Import button, you can copy a layout from another drawing or drawing template (DWT) file.
288 Part III: If Drawings Could Talk
Figure 12-9:
The Page Setup Manager dialog box.
Continuing the Plot Dialog
In previous sections of this chapter, I cover most of the important options in the Plot dialog box. This section reveals a few more fine points that will make your plotting life easier. I don’t cover every minute, obscure, useful-only-at- cocktail party-discussions detail. I do point out some occasionally useful options that will increase your vocabulary when you’re communicating with the Plot dialog box.
Use the Plot dialog box’s quick help to find out more about any part of the dialog box:
1.Click the question mark next to the close button in the dialog box’s title bar.
2.Point the cursor at the part of the dialog box that confuses you and click.
3.Click the Help button at the bottom of the dialog box if the pop-up help isn’t enough.
Printer/Plotter: As I describe in the section “Configure it out,” earlier in this chapter, you use the Name list to select the Windows system printer or nonsystem driver configuration that you want to use for plotting.
The Properties button opens the Plotter Configuration Editor dialog box, with which you can change media (type of paper) and other properties that are unique to the currently selected plotter or printer. In particular, you can define custom paper sizes.
Chapter 12: The Plot Thickens 289
As if AutoCAD’s Plot dialog box settings weren’t overwhelming enough, some plotter drivers hide important settings in the Plotter Configuration Editor dialog box, typically behind the Custom Properties button near the bottom of the dialog box. (For example, if you’re using the HP enhanced Windows system driver mentioned earlier in this chapter, you can click the Custom Properties button and then the More Sizes button to specify which paper sizes are available to you on the Plot Settings tab of the main Plot dialog box.)
To make matters even more confusing, if you make any changes in the Plotter Configuration Editor dialog box, AutoCAD prompts you to save the changes to a separate PC3 file. You should choose Save Changes to the Following File (that is, create a new AutoCAD-specific configuration that includes the revised settings) and type a configuration name that you’ll recognize later. When you want to plot with custom settings, remember to choose the AutoCAD-specific PC3 configuration near the end of the Plotter Configuration Name list, and not the Windows system printer configuration near the beginning of the list.
Plot to File: If you need to plot to a file rather than directly to your plotter or network printer queue, turn on this option. When you click OK to plot, AutoCAD asks you for a plot file name and location.
This option is especially useful when you want to use the ePlot feature to publish a DWF file on a Web site. You also may need to create files to send to a plotting service bureau.
Plot Stamp On: Use this option to turn on and off and configure the contents of a text string that AutoCAD adds automatically to the corner of each plot. The plot stamp can include useful information such as the drawing filename and plot date and time.
Plot Area: Specify the area of the drawing to plot. Your choices include Display, Extents, and Window, regardless of whether you’re plotting a paper space layout or the model space tab. If you defined named views in the drawing, AutoCAD adds a View option. The additional choice is Layout for a paper space layout tab or Limits for the model space tab.
•Display means the drawing as it’s currently displayed in the drawing window (including any white space — or black space — around the drawing objects).
•Extents means the rectangular area containing all the objects in the drawing.
•Limits means the model space area that you specified (or should have specified) when you set up the drawing, See Chapter 3 for details.
•Window means a rectangular area that you specify.
•View means a named view, which you select from the drop-down list (Chapter 7 describes named views and how to create them).