

AutoCAD 2005 For Dummies (2004)
.pdf270 Part III: If Drawings Could Talk
Nonsystem printers
System printers |
List of devices |
Figure 12-1:
System and nonsystem printer configurations.
5.Choose the output device that you want to make the default for new drawings.
6.Click OK to close the dialog box and retain any change that you made in the previous step.
You use the AutoCAD Plotter Manager Add-A-Plotter Wizard to create nonsystem driver configurations. (Choose File Plotter Manager to display a window containing a shortcut to the wizard.) This wizard is similar to the Windows Add Printer Wizard; if you can handle adding an ordinary printer in Windows, you probably can handle adding a nonsystem plotter configuration to AutoCAD. When you complete the wizard steps, AutoCAD saves the information in a PC3 (Plot Configuration version 3) file.
A Simple Plot
Okay, so you believe me. You know that you’re not going to master AutoCAD plotting in five minutes. That doesn’t change the fact that your boss, employee, wife, husband, construction foreman, or 11-year-old son wants a quick check plot of your drawing.

Chapter 12: The Plot Thickens 271
Plotting success in 16 steps
Here’s the quick, cut-to-the-chase procedure for plotting a simple drawing — a mere 16 steps! This procedure assumes that you plot in model space — that is, that the Model tab at the bottom of the drawing area shows the drawing in a way that you want to plot. (I cover plotting paper space layout tabs in the section “Plotting the Layout of the Land,” later in this chapter.) This procedure doesn’t deal with controlling plotted lineweights (see the “Plotting Lineweights and Colors” section later in this chapter for those details). It should, however, result in a piece of paper that bears some resemblance to what AutoCAD displays on your computer monitor.
Follow these steps to make a simple, not-to-scale, monochrome plot of a drawing:
1.Open the drawing in AutoCAD.
2.Click the Model tab at the bottom of the drawing area to ensure that you’re plotting the model space contents.
I explain model space and paper space in Chapter 3, and I explain how to plot paper space layouts later in this chapter.
3.Zoom to the drawing’s current extents (choose View Zoom Extents) so you can verify the area you’re going to plot.
The extents of a drawing consist of a rectangular area just large enough to include all the objects in the drawing.
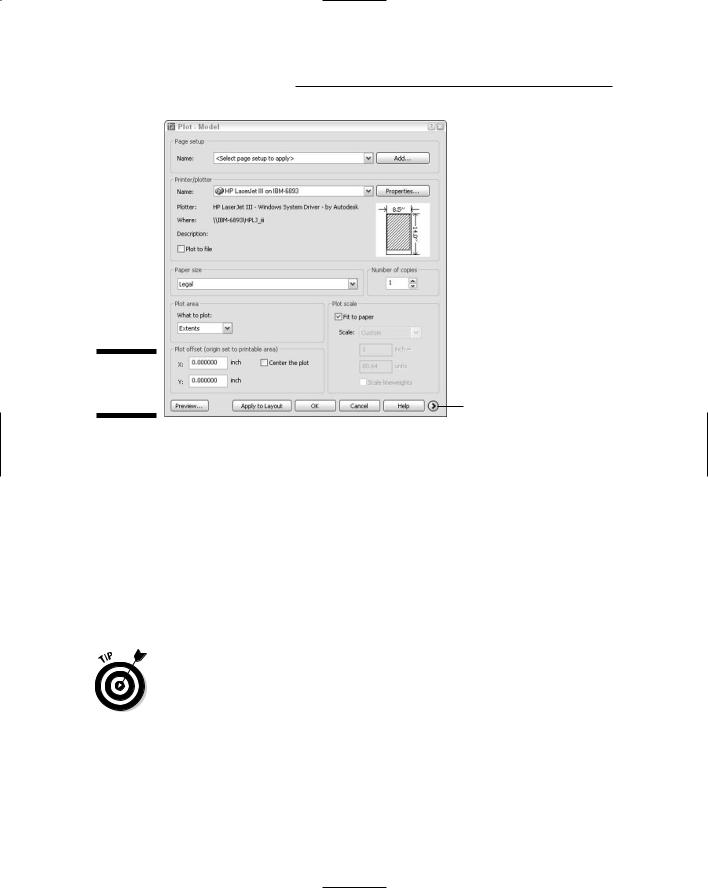
4.To display the Plot dialog box, click the Plot button on the Standard toolbar.
The Plot dialog box appears, as shown in Figure 12-2.
5.In the Printer/Plotter area, select a device from the Name list.
6.In the Paper Size area, select a paper size that’s loaded in your printer or plotter.
Of course, you must make sure that the paper size is large enough to fit the drawing at the scale you want to plot it at. For example, if you want to plot a D-size drawing, but you have only a B-size printer, you’re out of luck — unless you resort to multiple pieces of paper and lots of tape.
7.In the Plot Area area (sponsored by the Department of Redundancy Department), choose Extents.
If you set limits properly, as I suggest in Chapter 3, then choose Limits instead in order to plot the drawing area that you defined. The Window option — that is, plot a window whose corners you pick — is useful when you want to plot just a portion of your drawing.
8.In the Plot Offset area, choose Center the Plot.
Alternatively, you can specify offsets of zero or other amounts in order to position the plot at a specific location on the paper.
272 Part III: If Drawings Could Talk
Figure 12-2:
The Plot
dialog box.
More Options button
9.In the Plot Scale area, either choose Fit to Paper or uncheck Fit to Paper and specify a scale (by choosing from the drop-down list or typing into the two text boxes).
For most real plotting, you’ll plot to a specific scale, but feel free to choose Fit to Paper for now. If you do want to plot to a specific scale, see the “Instead of fit, scale it” section later in this chapter for guidance.
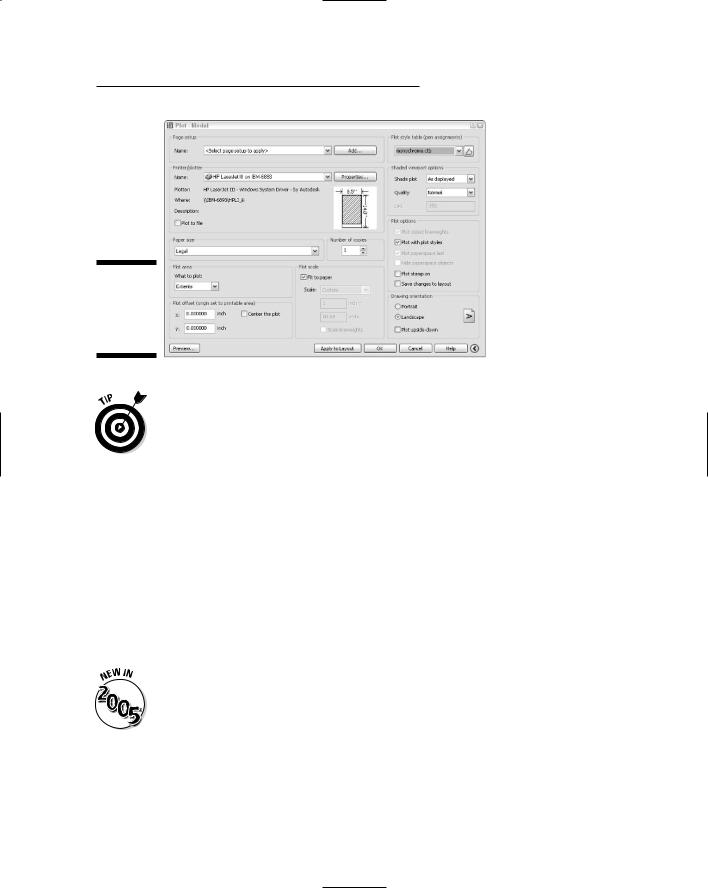
10.Click the More Options button (at the bottom-right corner of the dialog box, next to the Help button.
The Plot dialog box reveals additional settings, as shown in Figure 12-3.
11.In the Plot Style Table (Pen Assignments) area, choose Monochrome.ctb or Monochrome.stb.
AutoCAD may ask you whether to “Assign this plot style table to all layouts?” Answer Yes to make Monochrome.ctb (or Monochrome.stb) the default plot style table for the paper space layout tabs as well as the Model tab, or answer No to make the change apply only to the current tab.
The “Plotting with style” section later in this chapter describes plot style tables.
12.In the Plot Options area, make sure that Plot With Plot Styles is on and Save Changes to Layout is off, as shown in Figure 12-3.
Leaving Save Changes to Layout turned off tells AutoCAD to use any plot settings changes that you make only for this plot — AutoCAD will revert to the original plot settings the next time you plot the drawing.
Chapter 12: The Plot Thickens 273
Figure 12-3:
The expanded Plot dialog box.
After you become confident with plotting, you may want to turn on this setting so that AutoCAD does save your plotting settings changes as the default. Alternatively, click the Apply to Layout button to make the current plot settings the default for future plotting of this tab (that is, the Model tab) in this drawing.
13.In the Drawing Orientation area, choose Portrait or Landscape.
The postage stamp-sized preview in the middle of the Plot dialog box should help you decide on the right orientation. If not, the full preview in the next step will tell you for sure.
14.Click the Preview button and check that the drawing displays on the paper at the correct orientation and size, as shown in Figure 12-4; then, right-click and choose Exit to return to the Plot dialog box.
15.If you found any problems in the preview, adjust the plot settings (for example, Plot Area, Plot Scale, or Drawing Orientation) and repeat the preview until the plot looks right.
16.Click OK to create the plot.
When AutoCAD finishes generating and sending the plot, it displays a “Plot and Publish Job Complete” balloon notification from the status bar. If you decide that you don’t want to see these notifications, right -lick the Plot/Publish Details Report Available icon near the right end of the status bar and deselect Enable Balloon Notification.
There — 16 steps, as promised. If for some reason your plot didn’t work, well, I warned you that AutoCAD plotting was complicated and temperamental! Read the rest of this chapter for all the details about the numerous other plotting options that can cause plotting to go awry. If you’re in a big hurry, turn directly to the troubleshooting section, “Troubles with Plotting,” at the end of the chapter.

274 Part III: If Drawings Could Talk
Figure 12-4:
Preview of coming plottractions.
Preview one, two
One of the keys to efficient plotting is liberal use of AutoCAD’s partial and full preview features. (To maintain political fairness, I recommend conservative use of some other AutoCAD options elsewhere in the book.)
The postage stamp-sized partial preview in the middle of the Plot dialog box is a quick reality check to make sure your plot fits on the paper and is turned in the right direction. If the plot area at the current scale is too large for the paper, AutoCAD displays thick red warning lines along the side(s) of the sheet where the drawing will be truncated.
Press the Preview button to see a full preview in a separate window. You see exactly how your drawing lays out on the paper and how the various lineweights, colors, and other object plot properties will appear. You can zoom and pan around the preview by using the right-click menu. (Any zooming or panning that you do does not affect what area of the drawing gets plotted — zooming and panning is just a way to get a better look at different areas of the plot preview.)
Chapter 12: The Plot Thickens 275
Instead of fit, scale it
In most real plotting situations, you want to plot to a specific scale rather than let AutoCAD choose an oddball scale that just happens to maximize the drawing on the paper. And if you’re going to plot the Model tab of a drawing to scale, you need to know its drawing scale factor. Chapter 3 describes setup concepts and Chapter 9 provides some tips for determining the scale factor of a drawing that someone else created.
If your drawing was created at a standard scale, such as 1:50 or 1⁄4 ”=1’–0”, then you simply choose the scale from the handy drop-down Scale list in the Plot dialog box. If your scale is not in the list, then type the ratio between plotted distance and AutoCAD drawing distance into the two text boxes below the Scale list, as shown in Figure 12-5. The easiest way to express the ratio usually is to type 1 (one) in the upper box and the drawing scale factor in the lower box. (See Chapter 3 for more information.)
|
|
|
|
|
|
|
|
|
Fit |
|
|
|
|
|
|
|
|
|
|
|
|
|
|
|
|
|
|
|
Choose a |
|
|
|
|
|
|
|
|
|
|
|
|
|
|
|
|
|
|
|
|
Figure 12-5: |
|
|
|
|
|
|
|
predefined |
|
|
|
|
|
|
|
|
|||
|
|
|
|
|
|
|
scale |
||
Lots of |
|
|
|
|
|
|
|
||
|
|
|
|
|
|
|
|
||
weighs to |
|
|
|
|
|
|
|
|
|
scale. |
|
|
|
|
|
|
|
|
|
|
|
|
|
|
|
||||
|
|
|
|
|
|
|
|
|
|
|
|
|
|
|
|
|
|
|
|
|
|
Type a ratio |
|||||||
Creating half-size plots for some purposes is common in some industries. To plot model space half-size, double the drawing scale factor. For example, a
1⁄8 ”=1’–0” drawing has a drawing scale factor of 96, which is equivalent to a plot scale of 1=96. To make a half-size model space plot of it, specify a plot scale of 1=192 (or choose 1⁄16 ”=1’–0” from the Scale drop-down list).
276 Part III: If Drawings Could Talk
Even if you work with drawings that are created to be plotted at a specific scale, plotting with a Fit to Paper scale may be the most efficient way to make a reduced-size check plot. For example, drafters in your office might create drawings that get plotted on D size sheets (24 x 36 inch), whereas you have access to a laser printer with a B size (11 x 17 inch) paper tray. By plotting the D size drawings Scaled to Fit on B size paper, you end up with check plots that are slightly smaller than half size (11⁄24 size, to be exact). You won’t be able to measure distances on the check plots with a scale, but you probably will be able to check them visually for overall correctness.
Plotting the Layout of the Land
In the previous section I show you how to plot the model space representation of your drawing by making sure that the Model tab is active when you open the Plot dialog box. However, paper space gives you many additional options for controlling the look of your output, without having to modify the underlying geometry or the way it looks to someone working on the DWG file. So in some drawings, you want to plot a paper space layout instead.
About paper space layouts and plotting
As Chapter 3 describes, you can use AutoCAD’s paper space feature to compose one or more layouts for plotting your drawing in particular ways. Each layout lives on a separate tab, which you click at the bottom of the drawing area. In addition, AutoCAD saves plot settings (plot device, paper size, plot scale, and so on) separately for each of the tabs — that is, for each of layout tabs as well as the Model tab.
Whether to plot model space or a paper space layout in a drawing depends entirely on how the drawing was set up. If you or someone else went through a layout setup procedure similar to the one in Chapter 3, then you probably should plot the paper space layout. If not, then plot the Model tab.
Don’t confuse the Model tab at the bottom of the drawing area with the MODEL/PAPER button on the status bar. The tabs control which view of the drawing (model space or a paper space layout) fills the drawing area. When a paper space layout fills the drawing area, the status bar button controls whether drawing and editing take place in paper space or in model space inside a viewport. When you plot a layout, it doesn’t matter whether the MODEL/PAPER button says MODEL or PAPER — AutoCAD always plots the paper space layout (not just the contents of model space in the viewport).
Chapter 12: The Plot Thickens 277
The presence of a Layout1 tab next to the Model tab at the bottom of the drawing area doesn’t necessarily mean that the drawing contains an already set up paper space layout. AutoCAD always displays a Layout1 tab when you open a drawing created in AutoCAD Release 14 or earlier, and displays a Layout1 and Layout2 tab when you open a drawing created in AutoCAD 2000 or later. Layout1 and Layout2 are simply AutoCAD’s default names; the creator of the drawing may have renamed them to something more descriptive.
If you don’t have any paper space drawings handy, you can use one of the AutoCAD sample drawings, such as the architectural floor plan drawing stored in \Program Files\AutoCAD 2005\Sample\8th floor plan.dwg.
The path to paper space layout plotting success
Plotting a paper space layout is pretty much like plotting model space, except that you need to find the appropriate layout first and make sure that its tab is selected before you open the Plot dialog box:
1.Click the layout tabs at the bottom of the drawing area until you find a suitably set up layout.
If no one has set up the layout yet, AutoCAD creates a default layout. (If the Show Page Setup Manager for New Layouts setting on the Display tab of the Options dialog box is turned on, you’ll see the Page Setup Manager dialog box first — just click the Close button.) The default layout probably won’t be useful for real projects, but you use it to find out about the layout plotting procedure. Refer to Chapter 3 for instructions on creating a real layout.
2.Click the Plot button on the Standard toolbar.
The Plot dialog box appears.
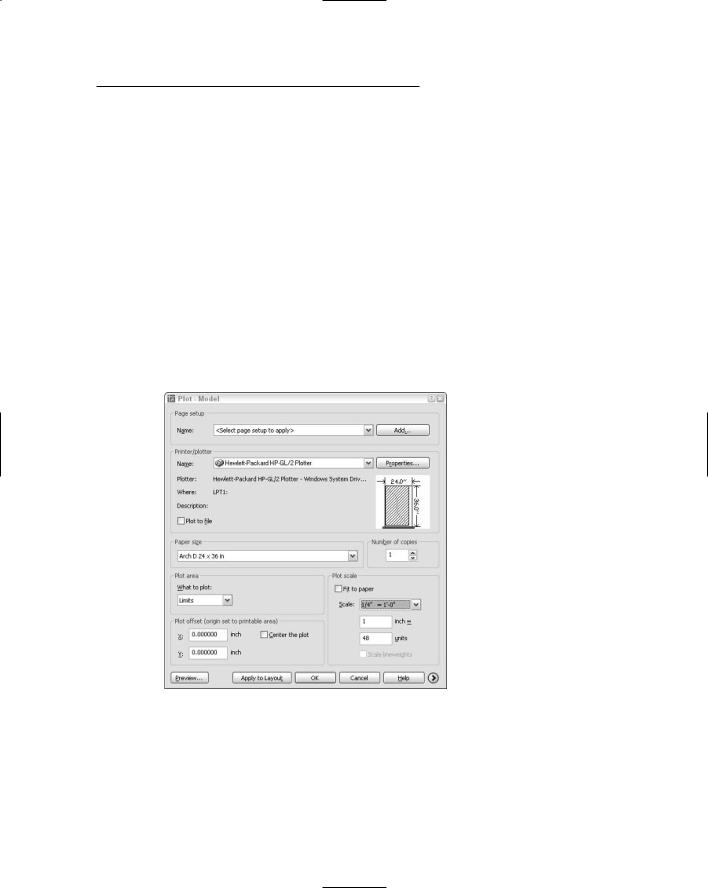
3.Specify a Printer/Plotter Name and a Paper Size.
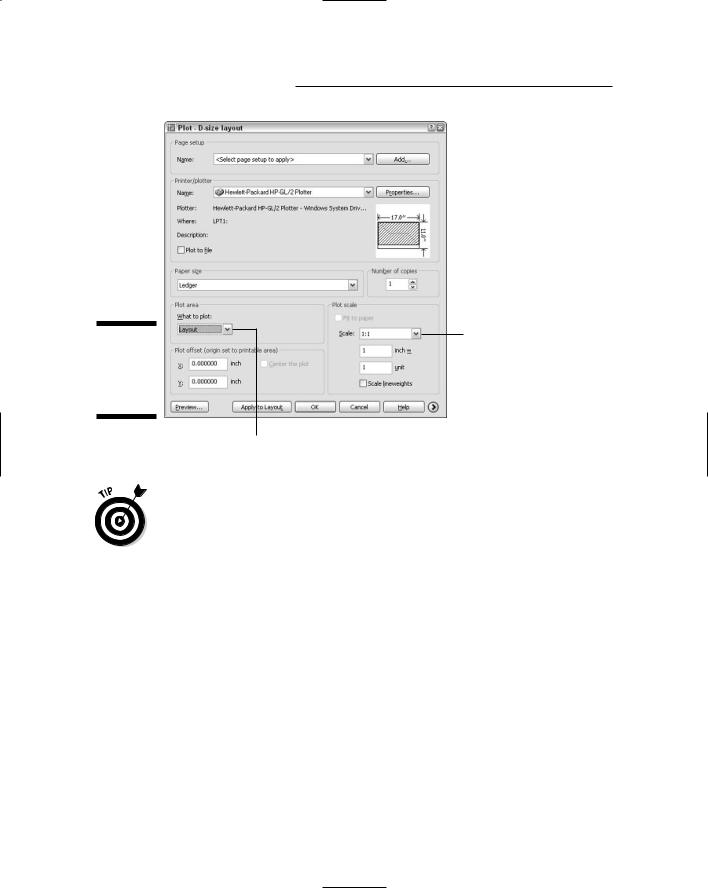
4.In the What to Plot list, choose Layout.
5.Specify the Plot Offset (such as zero in both the X and Y directions).
6.Specify a Plot Scale of 1:1.
One of the big advantages of layouts is that you don’t need to know anything about drawing scale in order to plot the drawing — hence the name paper space. Figure 12-6 shows the proper settings for plotting a layout.
To create a half-size plot of a layout, specify a plot scale of 1:2. In addition, turn on the Scale Lineweights setting in order to reduce lineweights proportionally. (I cover plotting lineweights later in this chapter.)
278 Part III: If Drawings Could Talk
Figure 12-6:
Settings for plotting a paper space layout.
Scale = 1:1
Plot area = Layout
If you find that the layout is too big for your plotter’s largest paper size at a plot scale of 1:1, you can change the What to Plot setting to Extents and then specify Fit to Paper for the Plot Scale. Alternatively, you can exit the Plot dialog box and fix the problem if you want to have a paper space layout that permanently reflects a new paper size. Use the Page Setup dialog box to modify the layout settings, or copy the layout and modify the new layout.
7.Click the More Options button and change any additional plot options that you want to.
Refer to Steps 11 through 13 in the section, “Plotting success in 16 steps.”
8.Click the Preview button, check that the drawing displays on the paper at the correct orientation and size, right-click and choose Exit to return to the Plot dialog box.
If you found any problems in the preview, change your plot settings and Preview again until it looks right.
9.Click OK to create the plot.
Chapter 12: The Plot Thickens 279
Plotting Lineweights and Colors
In previous sections of this chapter I help you gain some plotting confidence. Those sections show you how to create scaled, monochrome plots with uniform lineweights in model space or paper space. Those skills may be all you need, but if you care about controlling plotted lineweights and colors, or adding special effects such as screening (plotting shades of gray), read on.
Plotting with style
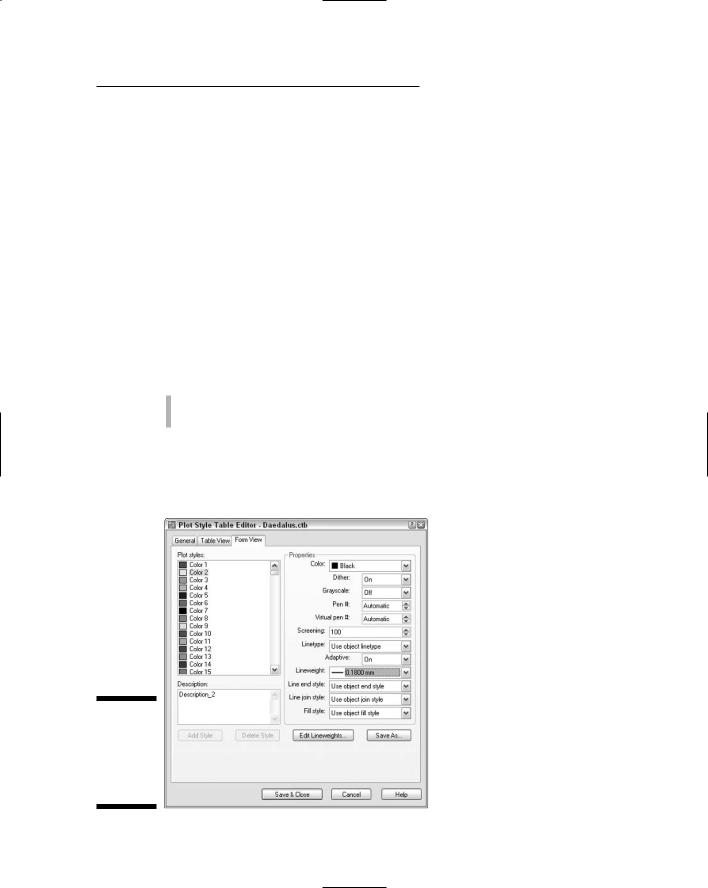
Plot styles provide a way to override object properties with alternative plot properties. (See Chapter 4 for information about object properties.) The properties include plotted lineweight, plotted color, and screening (plotting shades of gray). Figure 12-7 shows the full range of options. They come in two exciting flavors:
Color-dependent plot styles
Named plot styles
Color-dependent plot styles are based on the standard way of plotting in earlier versions of AutoCAD (before AutoCAD 2000), whereas named plot styles provide a newer way.
Figure 12-7:
Editing a colordependent plot style table.