

Pharmacokinetics and Metabolism in Drug Design Edited by D. A. Smith, H. van de Waterbeemd, D. K. Walker, R. Mannhold, H. Kubinyi, H.Timmerman
.pdf54 4 Distribution
These pharmacokinetic parameters are unique among dihydropyridine calcium channel blockers and allow once-a-day dosing of amlodipine, without the need for sustained release technology. The large volume of distribution is achieved despite the moderate lipophilicity of amlodipine and can be compared to the prototype dihydropyridine drug, nifedipine which is of similar lipophilicity but neutral (Figure 4.8). Notably, these changes in structure do not trigger a large change in clearance. The high tissue distribution of amlodipine is unique amongst dihydropyridine drugs, and has been ascribed to a specific ionic interaction between the protonated amino function and the charged anionic oxygen of the phosphate head groups present in the phospholipid membranes [14] and is as described previously in Chapter 1 (Physicochemistry).
Another basic drug where minor structural modification results in a dramatic increase in volume of distribution is the macrolide antibiotic, azithromycin. The traditional agent in this class is erythromycin, which contains one basic nitrogen, in the sugar side-chain.
Introduction of a second basic centre into the macrolide aglycone ring in azithromycin increases the free (unbound) volume of distribution from 4.8 to 62 L kg–1 (Figure 4.9). Free (unbound) clearance of the two compounds is also changed from 55 mL min–1 kg–1 for erythromycin to 18 mL min–1 kg–1 for azithromycin. The apparent plasma elimination half-life is, therefore, increased from 3 to 48 h. One consequence of the high tissue distribution of azithromycin is that the plasma or blood concentrations do not reflect tissue levels, which may be 10to 100-fold higher, compared to only 0.5- to 5-fold higher for erythromycin. Azithromycin readily enters macrophages and leukocytes and is, therefore, particularly beneficial against intracellular pathogens. Elimination of azithromycin is also prolonged with reported tissue half-life values of up to 77 h [15]. Overall, the pharmacokinetic properties of azithromycin provide adequate tissue concentrations on a once-daily dosing regimen and provide wide therapeutic applications. The high and prolonged tissue concentrations of azithromycin achieved provide a long duration of
Fig. 4.9 Structures of the macrolide antibiotics, erythromycin (monobasic) and azithromycin (dibasic).
4.3 Volume of Distribution and Duration 55
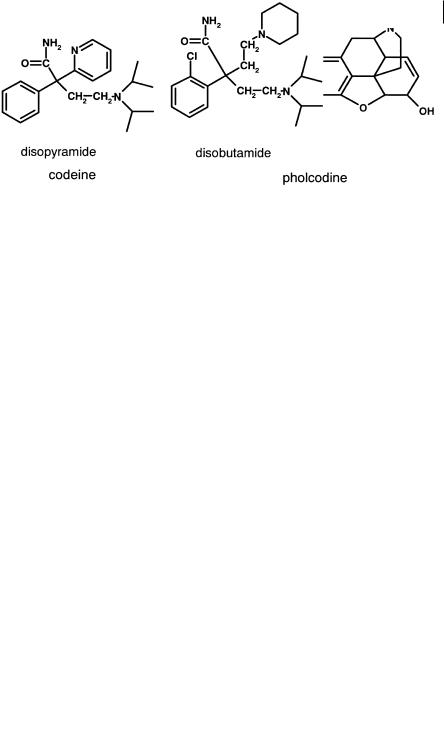
Fig. 4.10 Structures of codeine (monobasic) and pholcodine (dibasic).
action. Only 3–5-day courses of treatment are therefore required, hence improving patient compliance to complete the course and reducing the development of resistance [15].
A similar example to azithromycin, but in a small molecule series is pholcodine (Figure 4.10), where a basic morpholino side chain replaces the methyl group of codeine. Unbound clearance is essentially similar (10 mL min–1 kg–1) but the free unbound volume is increased approximately 10-fold (4 to 40 L kg–1) with a corresponding increase in half-life (3 to 37 h) [16].
High accumulation of drug in tissues has also been implicated in the seven-fold longer elimination half-life of the dibasic antiarrhythmic, disobutamide (Figure 4.11) compared to the monobasic agent, disopyramide. The elimination half-life of disobutamide is 54 h compared to approximately 7 h for disopyramide.
Disobutamide has been shown to accumulate extensively in tissues in contrast to disopyramide [17].
It is important to note that in these latter two examples, the high tissue affinity of the well-tolerated, anti-infective, azithromycin, is viewed as a pharmacokinetic advantage, while similar high tissue affinity is viewed as disadvantageous for the antiarrhythmic, disobutamide, which has a low safety margin. Obviously, different therapeutic areas impose different restrictions on the ideal pharmacokinetic profile for management of each condition, hence careful consideration should be paid to this at an early stage in drug discovery programmes.
Fig. 4.11 Structures of the monobasic antiarrythmic, disopyramide and the dibasic analogue disobutamide.

564 Distribution
4.4
Distribution and Tmax
It has been postulated that high tissue distribution of drugs can lead to a delayed
Tmax (time to maximum plasma concentration) after oral administration. Amlodipine (Figure 4.5), has a typical Tmax value of 6 to 9 h following an oral dose. Given the excellent physicochemical properties (moderately lipophilic and good solubility) of
this molecule, slow absorption across the membranes of the gastrointestinal tract is unlikely. In addition the compound appears to be more rapidly absorbed in patients
with hepatic impairment with a mean Tmax value of 3.8 versus 6.8 h [18]. The apparent slow absorption has been attributed to the considerable partitioning of drugs like
amlodipine into the initial tissue beds encountered followed by a slower redistribu-
tion. After oral dosing the major tissue bed is the liver. The intrinsic high tissue distribution of amlodipine is reflected in a volume of distribution of 21 L kg–1 [19]. Am-
lodipine, which is a relatively low clearance compound, is thus taken up extensively into the liver and then slowly redistributed back out, thus delaying the time to the
maximum observed concentration in the systemic circulation (Tmax). In the patients with hepatic impairment, the presence of hepatic shunts (blood vessels bypassing
the liver), decreases the exposure of the compound to liver tissue and hence reduces
Tmax. Studies with isolated rat livers indicated that the apparent volume of distribution in the liver exceeded 100 mL g–1 tissue [20] demonstrating very high affinity for
this tissue.
This postulated phenomenon can have the beneficial effect of reducing the likelihood of systemic side-effects by effectively buffering the rate at which the drug enters the systemic circulation and hence reducing peak-to-trough variations in concentration. Conversely, high affinity for liver tissue may increase exposure to the enzymes of clearance and may therefore attenuate the first-pass extraction of drugs.

57
References
1 |
Young, RC, Mitchell RC, Brown TH, |
11 |
Bergamini N, Fowst G, Arzneimittel- |
|
Ganellin CR, Griffiths R, Jones M, |
|
Forsch. 1965, 15, 951–1002. |
|
Rana KK, Saunders D, Smith IR, Sore |
12 |
Benet LZ, Oie S, Schwartz JB, In: |
|
NE, Wilks TJ, J. Med. Chem. 1988, 31, |
|
Goodman and Gillman’s The Pharmaco- |
|
656–671. |
|
logical Basis for Therapeutics, pp. |
2 |
Van de Waterbeemd H, Camenisch G, |
|
1707–1792. McGraw-Hill, New York, |
|
Folkers G, Chrétien JR, Raevsky OA, |
|
1995. |
|
J. Drug Target. 1998, 6, 151–165. |
13 |
Smith DA, Jones BC, Walker DK, Med. |
3 |
Brodie BB, Kurz H, Schanker LS, J. |
|
Res. Rev. 1996, 16, 243–266. |
|
Pharmacol. Exp. Ther. 1960, 130, 20–25. |
14 |
Mason RP, Rhodes DG, Herbette LG, |
4 |
Hansch C, Bjorkroth JP, Leo A, J. |
|
J. Med. Chem. 1991, 34, 869–877. |
|
Pharm. Sci. 1987, 76, 663–687. |
15 |
Foulds G, Shepard RM, Johnson RB, |
5 |
Wladyslaw D, Leokadia D, Lucyna J, |
|
J. Antimicrob. Chemother. 1990, 25 |
|
Halina N, Miroslawa M, J. Pharm. |
|
(Suppl. A), 73–82. |
|
Pharmacol. 1991, 43, 31–35. |
16 |
Fowle WA, Butz ASE, Jones EC, |
6 |
Hilgert M, Noldner M, Chatterjee SS, |
|
Waetherly BC, Welch RM, Posner J, |
|
Klein J, Neurosci. Lett. 1999, 263, |
|
Br. J. Clin. Pharmacol. 1986, 22, 61–71. |
|
193–196. |
17 |
Cook CS, McDonald SJ, Karim A, |
7 |
Hammarlund-Udenaes M, Paalzow LK, |
|
Xenobiotica, 1993, 23, 1299–1309. |
|
de Lange ECM, Pharm. Res. 1997, 14, |
18 |
Humphrey MJ, Smith DA, Br. J. Clin. |
|
128–134. |
|
Pharmacol. 1992, 33, 219P. |
8 |
De Lange ECM, Danhof M, deBoer AG, |
19 |
Faulkner JK, McGibney D, Chasseaud |
|
Breimer DD, Brain Res. 1994, 666, 1–8. |
|
LF, Perry JL, Taylor IW, Br. J. Clin. |
9 |
McAinsh J, Cruickshank JM, Pharm. |
|
Pharmacol. 1986, 22, 21–25. |
|
Ther. 1990, 46, 163–197. |
20 |
Walker DK, Humphrey MJ, Smith DA, |
10 |
Yamada YF, Shibuya J, Hamada J, |
|
Xenobiotica, 1994, 24, 243–250. |
|
ShawadaY, Iga T, J. Pharmacokinet. Bio- |
|
|
|
pharm. 1995, 23, 131–145. |
|
|

Pharmacokinetics and Metabolism in Drug Design 59
Edited by D. A. Smith, H. van de Waterbeemd, D. K. Walker, R. Mannhold, H. Kubinyi, H. Timmerman Copyright © 2001 Wiley-VCH Verlag GmbH ISBNs: 3-527-30197-6 (Hardcover); 3-527-60021-3 (Electronic)
5
Clearance
Abbreviations
ATP |
Adenosine triphosphate |
BTL |
Bilitranslocase |
CYP450 |
Cytochrome P450 |
MOAT |
Multiple organic acid transporter |
MRP |
Multi-drug resistance protein |
Natp |
Sodium dependent acid transporter protein |
OATP |
Organic acid transport protein |
OCT1 |
Organic cation transporter 1 |
OCT2 |
Organic cation transporter 2 |
P-gp |
P-glycoprotein |
TxRA |
Thromboxane receptor antagonist |
TxSI |
Thromboxane synthase inhibitor |
Symbols |
|
Cl |
Clearance |
log D7.4 |
Distribution coefficient (octanol/buffer) at pH 7.4 |
t1/2 |
Elimination half-life |
Vd |
Volume of distribution |
5.1
The Clearance Processes
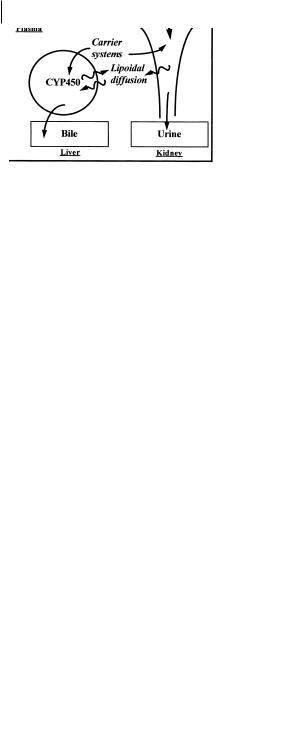
Clearance of drug normally occurs from the liver and kidneys and it is an important assumption that only free (i. e. not protein bound) drug is available for clearance. A diagram of the interaction of the major clearance processes is shown in Figure 5.1.
60 5 Clearance
Fig. 5.1 Schematic illustrating the interplay of hepatic and renal clearance processes.
5.2
Role of Transport Proteins in Drug Clearance
For hepatic clearance, passive diffusion through the lipid core of the hepatocyte membranes (available only to lipophilic drugs) is augmented by sinusoidal carrier systems, particularly for ionized molecules (either anionic or cationic) of molecular weights above 400. The presence of these carrier systems provides access to the interior of the hepatocyte to drugs with a wide range of physicochemical properties, ranging from hydrophilic to lipophilic. A schematic illustrating the role of these transport systems both into and out of the liver is shown in Figure 5.2. The transporters exist on the sinusoid face to remove drugs from the blood and transport them into the interior of the hepatocyte [1].
Likewise a different family of transporters exists on the canalicular face to transport drugs or their metabolites into bile. This complex system was originally termed biliary clearance but it is really two separate processes, hepatic uptake and biliary excretion. With small sized lipophilic drugs that readily traverse membranes hepatic uptake is probably not a major factor, since even if compounds are substrates, rapid redistribution across the membrane can occur. With higher molecular weight compounds (molecular weight greater than about 500) and those containing considerable H- bonding functionality (i.e. those that do not readily cross membranes) hepat-
Fig. 5.2 Schematic showing key sinusoidal and canalicular transport proteins and their substrate characteristics.
5.2 Role of Transport Proteins in Drug Clearance 61
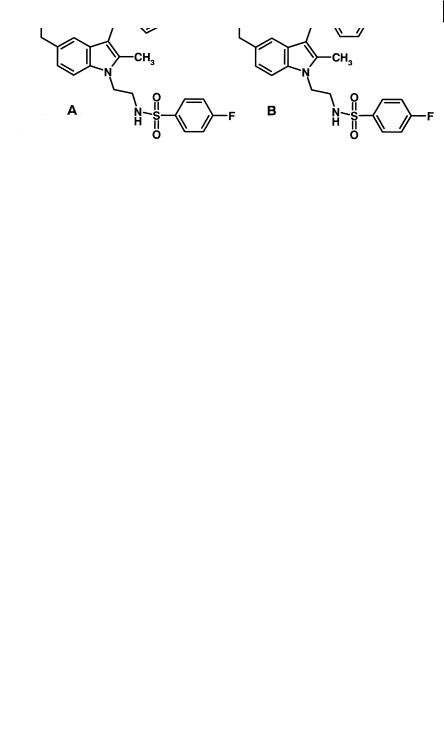
Fig. 5.3 Structures of two combined TxSI/TxRAs subject to high hepatic extraction by sinusoidal transport systems.
ic uptake can become the key clearance process, even if metabolism occurs subsequent to this. Figure 5.3 shows the structure of two combined thromboxane synthase inhibitors/thromboxane A2 receptor antagonists (TxSI/TxRAs). Both compounds show high hepatic extraction (E = 0.9) in the isolated perfused rat liver [2].
Compound A appears mainly as unchanged drug in the bile whereas compound B appears partly as metabolites. Administration of ketoconazole, a potent cytochrome P450 inhibitor, to the preparation dramatically decreases the metabolism of B and the compound appears mainly as unchanged material in the bile. Despite the inhibition of metabolism, hepatic extraction remains high (0.9). This indicates that clearance is dependent on hepatic uptake, via a transporter system, for removal of the compounds from the circulation. Metabolism of compound B is a process that occurs subsequent to this rate-determining step and does not influence overall clearance. This model for the various processes involved in the clearance of these compounds is illustrated in Figure 5.4.
The affinity of compounds for the various transporter proteins vary, but charge, molecular weight and additional H-bonding functionality seem to be particularly important.
Fig. 5.4 Model for the hepatic processes involved in the clearance of the combined TxSI/TxRAs (see Figure 5.3). The clearance by hepatic up-
take (Clup) is the rate-determin- ing step in the removal of the compound from the perfusate. Compounds accumulate within the liver and are subsequently
cleared by biliary (Clbil) or metabolic clearance (ClM)
(modified from reference [2]).

62 5 Clearance
Lipophilic drugs are metabolized by intracellular membrane-bound enzyme systems (e. g. cytochrome P450s and glucuronyl transferases) to more water soluble derivatives. The active sites of the major forms of the cytochrome P450 superfamily rely heavily on hydrophobic interactions with their substrates, although ion-pair and hydrogen bonding interactions also occur. Exit from the hepatocyte may be by simple passive diffusion back into the plasma or as outlined above via canalicular active transport systems which excrete drugs and their metabolites, again with wide ranging physical properties, into the bile.
5.3
Interplay Between Metabolic and Renal Clearance
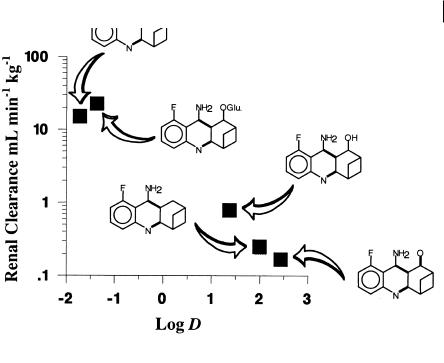
Small molecules, with relatively low molecular weight, will appear in the urine due to glomerular filtration. The secretion of drugs into the urine can also occur through tubular carrier systems similar to those present on the sinusoid face of the hepatocyte. For instance, of the carriers illustrated in Figure 5.2, Natp, OATP and OCT1 are also present in the kidney. In addition another organic cation transporter, OCT2, is also present. There is also a vast difference in the volume of fluid formed at the glomerulus each minute and the amount that arrives during the same period at the collecting tubule. The aqueous concentration processes that occur in the kidney mean that for drugs capable of travelling through the lipid core of the tubule membrane, significant reabsorption back into the plasma will occur. The end result of this process is that only hydrophilic molecules are voided in the urine to any substantial degree. This interaction between metabolism and renal clearance can be illustrated by following the fate of the cholinesterase inhibitor SM-10888 [3]. A number of metabolism processes occur on the lipophilic parent molecule involving phase 1 oxidation and phase 2 conjugation reactions. Some of these processes occur sequentially as illustrated in Figure 5.5.
Fig. 5.5 Metabolism of SM-10888, involving phase 1 and phase 2 metabolic processes.
5.4 Role of Lipophilicity in Drug Clearance 63
Fig. 5.6 Relationship between lipophilicity and renal clearance for SM-10888 and its metabolites.
5.4
Role of Lipophilicity in Drug Clearance
Most of these steps result in a reduction in lipophilicity compared to the parent molecule. These reductions in lipophilicity lead to increased renal clearance and effectively permit the voiding of the dose from the body as illustrated in Figure 5.6.
This demonstrates the interaction between metabolic and renal clearance. Assuming that SM-10888 is the only pharmacologically active moiety, these processes govern the clearance of active drug and hence determine the required dose. In fact, only the formation of the N-glucuronide and the benzylic hydroxyl metabolites are of prime concern to the medicinal chemist. These represent the primary clearance routes of the compound and hence govern the rate of clearance and ultimately the dosage regimen needed to obtain a particular plasma concentration of the active compound, SM-10888 in this example.
Rather than looking at a metabolic pathway, similar models for the control of the mechanism of clearance by lipophilicity are demonstrated by considering drugs in general. Figure 5.7 illustrates free drug renal and metabolic clearance for a series of neutral compounds drawn from the literature [4].
For hydrophilic drugs (log D7.4 below 0) renal clearance is the predominant mechanism. For drugs with log D7.4 values above 0, renal clearance decreases with lipophilicity. In contrast to renal clearance, metabolic clearance increases with in-
64 5 Clearance
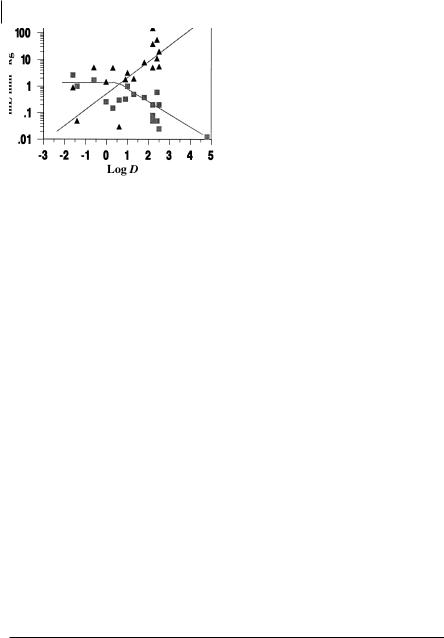
Fig. 5.7 Relationship between lipophilicity and unbound renal (squares) and metabolic clearance (triangles) for a range of neutral drugs in man.
creasing log D and this becomes the major clearance route of lipophilic compounds. Noticeably, considering the logarithmic scale in Figure 5.7, overall clearance declines with decreasing lipophilicity. The lowest clearances, achieved by the combined renal and metabolic processes, are observed below log D7.4 values of 0 where metabolic clearance is negligible. This apparent advantage needs to be offset against the disadvantages of reliance on gastrointestinal absorption via the aqueous pore pathway that will tend to predominate for hydrophilic compounds. Moreover the actual potency of the compound is also normally affected by lipophilicity with potency tending to increase with increasing lipophilicity [5]. Furthermore as shown previously, volume of distribution also increases with increasing lipophilicity and hence tends to increase the elimination half-life (t1/2 = 0.693 × Vd/Cl). Therefore the duration of the drug in the system is a fine balance between the relationship of lipophilicity and its effects on volume of distribution and clearance.
This balance is illustrated by reference to two β-adrenoceptor antagonists, atenolol and propranolol [6]. These have differing physicochemical properties. Atenolol is a hydrophilic compound which shows reduced absorption, low clearance predominantly by the renal route and a moderate volume of distribution. Note that absorption by the paracellular route is still high, due to the small size of this class of agent. In contrast, propranolol, a moderately lipophilic compound, shows high absorption, high clearance via metabolism and a large volume of distribution. Because of this balance of properties both compounds exhibit very similar elimination half-lives. These half-lives are sufficiently long for both drugs to be administered on twice daily
Tab. 5.1 Physicochemical, pharmacological and pharmacokinetic properties for atenolol and propranolol illustrating their interdependence.
|
Log |
Affinity |
Absorption |
Oral clearance |
Volume of |
Half-life |
|
D7.4 |
(nM) |
(%) |
(unbound) |
distribution |
(h) |
|
|
|
|
mL min–1 kg–1 |
(unbound) |
|
|
|
|
|
|
L kg–1 |
|
|
|
|
|
|
|
|
Atenolol |
– 1.9 |
100 |
50 |
4 |
0.8 |
3–5 |
Propranolol |
– 1.1 |
4 |
100 |
700 |
51 |
3–5 |
|
|
|
|
|
|
|