

Pharmacokinetics and Metabolism in Drug Design Edited by D. A. Smith, H. van de Waterbeemd, D. K. Walker, R. Mannhold, H. Kubinyi, H.Timmerman
.pdf9.2 Allometric Scaling 127
Fig. 9.2 Allometric relationship between body weight and systemic clearance of fluconazole.
Thus everything occurs more rapidly in the rat than in man and “physiological time” is shorter (on a chronological scale) the smaller the species. Hence physiological processes that are dependent upon time become disproportionately more rapid in smaller species. This is illustrated by the allometric analysis of creatinine clearance (a measure of glomerular filtration rate) which shows an allometric exponent of 0.69. A similar allometric exponent is obtained for the clearance of fluconazole (Figure 9.2), a compound that is almost exclusively cleared by the kidneys. Hence whilst weight normalized clearance may decrease from 4 mL min–1 kg–1 in mouse to 0.3 mL min–1 kg–1 in man, an allometric relationship is observed across the different species with an exponent of 0.73. This value for the exponent is in keeping with the general observation for small organic molecules where successful predictions are associated with an exponent value of about 0.75 [8]. Thus clearance of fluconazole remains relatively constant across species with respect to “physiological time”, as renal clearance remains a constant fraction of the glomerular filtration rate (GFR) at about 20 % [9].
As with the allometric relationship with volume of distribution, fluconazole exhibits only low plasma protein binding and for compounds which exhibit variation in protein binding across species, allometry should be based upon clearance of unbound drug. Amongst other drugs cleared by the kidneys which show an allometric relationship, the α1-adrenoceptor antagonist, metazosin, is notable in that the allometric exponent for clearance is 0.28 [12]. Together with the unusual allometric exponent of 0.6 for volume of distribution this clearly suggests some abnormality in the disposition of this compound which has not yet been explained.
When clearance is dependent upon metabolism, species-specific differences in the enzymes of metabolism can clearly prevent any such allometric relationship. An example of this is the absence of a close homologue of the human CYP2C9 enzyme in the dog, hence its inability to hydroxylate drugs such as tolbutamide and tienilic acid [13]. This said, many compounds cleared by metabolism do exhibit allometric relationships (e.g. N-nitrosodimethylamine, [14]). In an extensive analysis of the allometric relationship between clearance in the rat and man for 54 extensively cleared

128 9 Inter-Species Scaling
drugs, the mean allometric exponent value was 0.66 [15]. This analysis also confirmed the improved correlation when unbound plasma clearance was considered.
9.3
Species Scaling: Adjusting for Maximum Life Span Potential
Allometric scaling of clearance is least successful for metabolically cleared drugs with low extraction. This is perhaps hardly surprising, as these compounds will be most sensitive to the subtle differences in the affinities of species-specific homologues of the enzymes of metabolism. In these cases the clearance in man is generally lower than would be predicted by straightforward allometry. By including a factor, which reflects the reduced rate of maturation in man, these differences can be corrected. Such factors have included maximum life span potential (MLP) and brain weight [16].
Compounds which are substrates for mixed function oxidase enzymes, including P450s, tend to show lower than expected clearance in man based upon the simple allometric scaling incorporating body weight alone. This may be correlated with the enhanced longevity of man compared to most animals, since the faster the pace of life, the shorter it is. Hence slowing the metabolic rate, including that of the mixed function oxidases, allows the MLP to be extended. This reflects a major evolutionary advantage of man over other animal species. Therefore incorporation of MLP into the allometric extrapolation provides a more accurate assessment of physiological time than body weight alone. One additional potential advantage of reduced activity of the mixed function oxidases is decreased activation of pro-carcinogens and decreased free radical formation, hence prolonging life span.
The consideration of clearance in units of volume per maximum life span potential, instead of the traditional volume per weight, provides an allometric relationship for drugs such as antipyrine and phenytoin [17]. Both of these drugs are essentially low clearance compounds, cleared by P450 metabolism. Ultimately, the successful utility of such factors may be purely serendipitous as they simply exploit unique features of man as a species.
9.4
Species Scaling: Incorporating Differences in Metabolic Clearance
An alternative approach to relying simply upon allometric approaches for metaboli- cally-cleared compounds is to take into consideration their relative stability in vitro. Clearance by P450 enzymes observed in hepatic microsomes from different species provides a measure of the relative intrinsic clearance in different species. Using the equation for the well-stirred model:
Cls = Cli · Q/(Cli + Q) |
(9.3) |

9.5 Inter-Species Scaling for Clearance by Hepatic Uptake 129
The equation can be solved for intrinsic clearance (Cli) based upon systemic clearance (Cls) obtained after i.v. administration and hepatic blood flow (Q) in the test species. Intrinsic clearance in man can then be estimated based upon relative in vitro microsomal stability and the equation solved to provide an estimate for human systemic clearance. Hence this approach combines allometry (by considering differences in organ blood flow) and species-specific differences in metabolic clearance.
The incorporation of in vitro metabolism data into allometric scaling of compounds cleared by hepatic metabolism has been extensively evaluated [18] and shown to accurately predict human clearance. In this review it is suggested that the utility of such methods are most appropriately applied in drug candidate selection, to confirm early estimates and to support early clinical studies.
The inclusion of relative metabolic stability in animal and human hepatocytes in allometric scaling for 10 metabolically cleared compounds has been detailed [19]. In this study, the correction for species differences in metabolic rate resulted in extrapolated human clearance values within two-fold of those observed. In contrast extrapolations based on simple allometry or incorporating a correction for brain weight gave up to 10-fold errors on the extrapolated values. Again in these approaches to scaling, differences in plasma protein binding can be incorporated using the equation:
Cli = Cliu · fu |
(9.4) |
where fu is the fraction unbound in plasma of the relevant species. Extrapolation based on unbound drug clearance is generally the approach of choice for estimating metabolic clearance in man prior to progressing a compound into clinical trials [20].
A comparison of various inter-species scaling methods was conducted for the endothelin antagonist, bosentan [21]. This compound is eliminated mainly through metabolism. Simple, direct allometric scaling based on five animal species provided a relatively poor correlation coefficient (r2) of 0.525. Whilst the r2 value was greatly improved (0.895) by correcting for brain weight, this gave a relatively poor prediction of human clearance of 44 mL min–1 versus an actual value of 140 mL min–1. The best r2 value (0.976) was obtained by correcting for rates of metabolism in liver hepatocytes from the various species and this also provided a relatively good prediction of human clearance at 100 mL min–1. Whilst the correlation coefficient was inferior when incorporating metabolic stability in liver microsomes (0.725) instead of hepatocytes, this also provided a good estimate of human clearance at 126 mL min–1. In this example no account was taken of plasma protein binding differences between species.
9.5
Inter-Species Scaling for Clearance by Hepatic Uptake
When transporter proteins are involved in the rate-determining step of compound clearance, there is clearly the potential for species differences to exist which are not related to allometry. Given the large (and growing) number of transporter proteins
130 9 Inter-Species Scaling
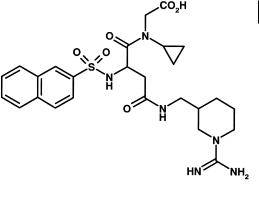
Fig. 9.3 Structure of the thromboxane receptor antagonist, UK-147,535.
implicated in the removal of drugs from the systemic circulation (see Chapter 5) there exists the possibility for divergent substrate specificity in the various laboratory animal species and man.
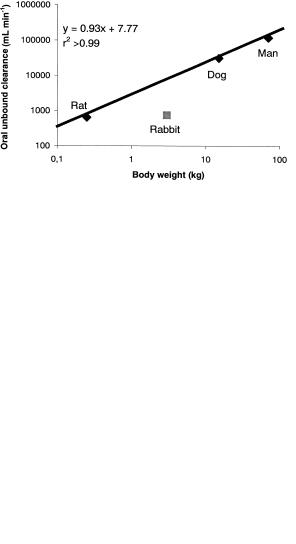
Organic anions have frequently been implicated as substrates for transporters in the sinusoidal membrane of the liver. This was illustrated for a series of TxRAs, where hepatic uptake was identified as the rate-determining step in the clearance process [22]. A representative compound from this series, UK-147,535 (Figure 9.3), was progressed to clinical trials [23]. It is thus possible to contrast clearance of this compound between a number of species including man (Figure 9.4).
Fig. 9.4 Allometric relationship for clearance of UK147,535 in various species.
As observed in Figure 9.4 the intrinsic clearance (as represented by oral unbound clearance Clou) of UK-147,535 shows an allometric relationship between the rat, dog and man. This would indicate that the transporter protein involved is conserved across these species and has similar affinity. However, marked reduction in clearance in the rabbit suggests the absence, or marked alteration, of the responsible protein in the hepatic sinusoidal membrane of this species. This finding may explain the common observation of reduced biliary excretion of acidic compounds in rabbits compared to other species [24, 25].
It remains to be established whether other transporter proteins for other drug classes (e. g. cations) are conserved between species. Active transport processes are believed to be involved in the renal and hepatic clearance of the zwitterionic throm-
9.6 Elimination Half-life 131
Fig. 9.5 Structure of the thrombin inhibitor, napsagatran.
bin inhibitor, napsagatran (Figure 9.5). Allometric scaling based on pharmacokinetic data from the rat, rabbit, monkey and dog overestimated total clearance, non-renal clearance and volume of distribution in man by 3-, 7- and 2-fold respectively. As napsagatran is not metabolized in vitro or in vivo, this would suggest that species differences in the transport proteins involved in the clearance of napsagatran, especially the protein responsible for hepatic uptake across the sinusoidal membrane, compromise the kinetic extrapolations from animals to man. Notably, amongst the individual species investigated, the monkey was most predictive of human clearance and volume of distribution [26].
9.6
Elimination Half-life
The relationship between elimination half-life (t1/2) and body weight across species results in poor correlation, most probably because of the hybrid nature of this parameter [27]. A better approach may be to estimate volume of distribution and clearance by the most appropriate method and then estimate half-life indirectly from the relationship:
t1/2 = (0.693 · Vd)/Cls |
(9.5) |

132
References
1 |
Wandel C, Bocker RH, Bohrer H, |
15 |
Chou WL, Robbie G, Chung SM, |
|
deVries JX, Hofmann W, Walter K, |
|
Wu T-C, Ma C, Pharm. Res. 1998, 15, |
|
Klingeist B, Neff S, Ding R, Walter-Sack |
|
1474–1479. |
|
I, Martin E, Drug Metab. Dispos. 1998, |
16 |
Ings RMJ, Xenobiotica 1990, 20, |
|
26, 110–114. |
|
1201–1231. |
2 |
Boxenbaum H, J. Pharmacokinet. |
17 |
Campbell DB, Ings RMJ, Hum. Toxi- |
|
Biopharm. 1981, 10, 201–227. |
|
col. 1988, 7, 469–479. |
3 |
Boxenbaum H, D’Souza R, NATO ASI |
18 |
Lave T, Coassolo P, Reigner B, Clin. |
|
Series, Ser. A 1988, 145, Harma. Meth. |
|
Pharmacokinet. 1999, 36, 211–231. |
|
Stat. App. PG. |
19 |
Lave T, Dupin S, Schmitt C, Chou RC, |
4 |
Hayton WL, Health Phy. 1989, 57, |
|
Jaeck D, Coassolo P, J. Pharm. Sci. |
|
159–164. |
|
1997, 86, 584–590. |
5 |
Paxton JW, Clin. Exp. Pharm. Physiol. |
20 |
Smith DA, Jones BC, Walker DK, |
|
1995, 22, 851–854. |
|
Med. Res. Rev. 1996, 16, 243–266. |
6 |
Mahmood I, Balian JD, Life Sci. 1996, 59, |
21 |
Lave T, Coassolo P, Ubeaud G, |
|
579–585. |
|
Bradndt R, Schmitt C, Dupin S, |
7 |
Ritschel WA, Vachharajani NN, Johnson |
|
Jaeck D, Chou RC, Pharm. Res. 1996, |
|
RD, Hussain AS, Comp. Biochem. Physi- |
|
13, 97–101. |
|
ol. 1992, 103C, 249–253. |
22 |
Gardner IB, Walker DK, Lennard MS, |
8 |
Mordenti J, J. Pharm. Sci. 1986, 75, |
|
Smith DA, Tucker GT, Xenobiotica |
|
1028–1040. |
|
1995, 25, 185–197. |
9 |
Jezequel SG, J. Pharm. Pharmacol. 1994, |
23 |
Dack KN, Dickinson RP, Long CJ, |
|
46, 196–199. |
|
Steele J, Bioorg. Med. Chem. Lett. 1998, |
10 |
Beaumont KC, Causey AG, Coates PE, |
|
8, 2061–2066. |
|
Smith DA, Xenobiotica 1996, 26, |
24 |
Simons PJ, Cockshott ID, Douglas EJ, |
|
459–471. |
|
Gordon EA, Knott S, Ruane RJ, |
11 |
Obach RS, Baxter JG, Liston TE, Silber |
|
Xenobiotica 1991, 21, 1243–1256. |
|
M, Jones BC, MacIntyre F, Rance DJ, |
25 |
Illing HPA, Fromson JM, Drug Metab. |
|
Wastall P, J. Pharm. Exp. Ther. 1997, |
|
Dispos. 1978, 6, 510–517. |
|
283, 48–58. |
26 |
Lave T, Portmann R, Schenker G, |
12 |
Lapka R, Rejholec V, Sechser T, Peter- |
|
Gianni A, Guenzi A, Girometta M-A, |
|
kova M, Smid M, Biopharm. Drug Dispos. |
|
Schmitt M, J. Pharm. Pharmacol. 1999, |
|
1989, 10, 581–589. |
|
51, 85–91. |
13 |
Smith DA, Drug Metab. Rev. 1991, 23, |
27 |
Mahmood I, J. Pharm. Pharmacol 1998, |
|
355–373. |
|
50, 493–499. |
14Gombar CT, Harrington GW, Pylypiw HM, Anderson LM, Palmer AE, Rice JM, Magee PN, Burak ES, Cancer Res. 1990, 50, 4366–4370.

Pharmacokinetics and Metabolism in Drug Design 133
Edited by D. A. Smith, H. van de Waterbeemd, D. K. Walker, R. Mannhold, H. Kubinyi, H. Timmerman Copyright © 2001 Wiley-VCH Verlag GmbH ISBNs: 3-527-30197-6 (Hardcover); 3-527-60021-3 (Electronic)
10
High(er) Throughput ADME Studies
Abbreviations
ADME |
Absorption, distribution, metabolism, excretion |
CYP3A4 |
Cytochrome P450 3A4 |
DMPK |
Drug metabolism and pharmacokinetics |
HTS |
High throughput screening |
MTS |
Medium throughput screening |
P-gp |
P-glycoprotein |
PK |
Pharmacokinetics |
UHTS |
Ultra-high throughput screening |
10.1
The HTS Trend
New approaches to medicinal chemistry such as parallel synthesis and combinatorial chemistry strategies [1] and refinement of high throughput screening in biology place Drug Discovery at a crossroads. Will traditional rationale medicinal chemistry continue as the cornerstone of how we discover drugs or will shear numbers of compounds be the winning formula. High compound numbers are essential whatever the eventual scenario to ensure that early lead matter is available. The size of compound files of the future, millions of compounds, means informatics and automation are key ingredients for a successful drug discovery organization [2]. How much drug metabolism needs to adapt is part of the question. Clearly many of the in vitro approaches can be automated and thus increase efficiencies. These systems are equally adaptable to screening a file or providing fast turnaround on newly synthesized products of a rationale discovery programme. Both approaches are being pursued. This chapter discusses the place of ADME screens and describes some of the recent developments which give insight into how medicinal chemistry, in a not too far future, may benefit.
13410 High(er) Throughput ADME Studies
10.2
Drug Metabolism and Discovery Screening Sequences
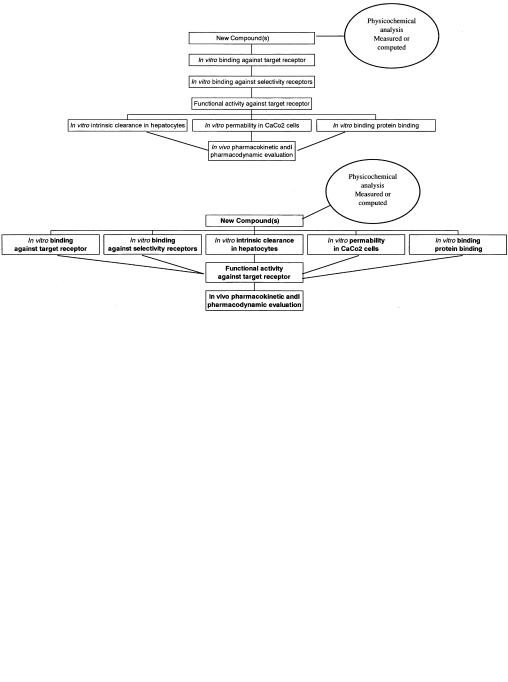
The development of higher throughput approaches in ADME studies is driven by the advances in high-speed chemistry and pharmacological screening [3], a view of the future where many more compounds would need to be screened, and the availability of the technology. Departments of Drug Metabolism and Pharmacokinetics in the pharmaceutical industry are organizing themselves for the rapid evaluation of large numbers of compounds [4–8]. Higher throughput can move a screening approach up the traditional sequence, provide more comprehensive data on a single compound, or just screen more compounds or even files. The pre-ADME days of Discovery had screening sequences based on an in vitro functional response often followed by an oral rodent pharnmacodynamic model. The advent of ADME, cloned receptors etc., has led to the hierarchical sequence shown in Figure 10.1. Higher throughput could allow a parallel process, which collects large amounts of in vitro pharmacology and ADME data as the primary stage.
The hierarchical model is closest to the traditional approach and meets the needs of a focused, disciplined approach, where molecules are drug-like, with a real possibility of passing some of the ADME criteria. The horizontal model is optimum for looking for exceptions to drug-like property rules and can build SAR streams much
Fig. 10.1 Hierarchical and horizontal in vitro screening sequences. In each phase only compounds possessing certain criteria would move to the next phase. In the hierarchical model
(top) ADME data is collected only on compounds with adequate potency and selectivity. In the horizontal model (bottom) ADME data is collected on all compounds synthesized.

10.3 Physicochemistry 135
more rapidly so allowing very comprehensive real-time SAR of the type normally reserved for retrospective analysis. These two models indicate a divergence of how the data is handled. The hierarchical model means that full data is available on a few compounds, can be manipulated on a spreadsheet and is within the understanding of a medicinal chemist. This relates to the data being unimportant and the information being retained to drive the process. The horizontal model could result in more than 5000 data points to collate as SAR. This immediately requires computational systems and complex analysis to process and optimize. Some progress has been made in methods used in early ADME evaluation [6] with in silico and higher throughput physicochemical methods being linked to appropriate in vitro models [7]. The next sections give an inventory of some of these approaches.
10.3
Physicochemistry
The importance of physicochemisty to drug disposition and ADME is summarized in tabular form in Table 10.1.
Tab. 10.1 Physicochemical properties and the relationship to key disposition processes.
|
Lipophilicity |
Molecular |
Hydrogen |
Ionization |
Melting point, |
|
|
size |
bonding |
|
crystal |
|
|
|
|
|
packing |
|
|
|
|
|
|
Dissolution |
√√√ ↓ |
|
|
√√ |
√√√ ↓ |
|
|
|
|
|
|
Membrane permeation, |
|
|
|
|
|
lipoidal |
√√√ ↑ |
√√ |
√√ |
√ |
|
|
|
|
|
|
|
Membrane permeation, |
|
|
|
|
|
aqueous |
|
√√√ ↓ |
|
|
|
|
|
|
|
|
|
Non-specific |
|
|
|
|
|
binding to proteins |
|
|
|
|
|
and phospholipids |
√√√ ↑ |
|
|
√√√ |
|
|
|
|
|
|
|
Carrier transport |
|
|
|
|
|
|
|
|
|
|
|
Metabolism |
√√√ ↑ |
|
|
√ |
|
|
|
|
|
|
|
Renal clearance |
√√√ ↓ |
|
|
|
|
|
|
|
|
|
|
Number of ticks indicate relative importance and the arrows indicates how an increase in the physicochemical property affects the ADME property, e. g. dissolution is decreased by increasing lipophilicity.

13610 High(er) Throughput ADME Studies
10.3.1
Solubility
Solubility is a key parameter for dissolution of compounds following oral administration (Section 3.1). The process depends on the surface area of the dissolving solid and the solubility of the drug at the surface of the dissolving solid. Solubility is inversely proportional to the number and type of lipophilic functions within the molecule and the tightness of the crystal packing of the molecule. Rapid, robust methods reliant on turbidimetry to measure solubility have been developed [10, 11], which can handle large numbers of compounds. Since ionization can also govern solubility, ap-
proaches for the rapid measurement of pKa values of sparingly soluble drug compounds have also been developed [12]. Ideally only soluble compounds would be syn-
thesized in a Discovery programme which is where predictive solubility methods using neural networks [13, 14], would be such an advantage.
10.3.2
Lipophilicity
Lipophilicity is the key physicochemical parameter linking membrane permeability, and hence drug absorption and distribution with route of clearance (metabolic or renal). Measured or calculated lipophilicity of a compound is readily amenable to automation. Many of these calculation approaches rely on fragment values, but simple methods based on molecular size to calculate log P values have been demonstrated to be extremely versatile [15]. A combination of measured and fragmental approaches allow extremely accurate prediction of new compound properties. For actual measurement rather than prediction, investigations in using alternatives to octanol/water partitioning include applications of immobilized artificial membranes (IAM) [16] and liposome/water partitioning [17, 18]. The IAM method offers speed of measurement as an advantage over the classical octanol/water system. Liposome binding may possibly be transferred to a higher throughput system and could provide a “volume of distribution” screen when linked with other properties. Hydrogen
bonding capacity of a drug solute is now recognized as an important constituent of the concept of lipophilicty. Initially ∆logP, the difference between octanol/water and
alkane/water partitioning was used as a measure for solute H-bonding but this technique is limited by the poor solubility of many compounds in the alkane phase. Computational approaches to this range through simple heteroatom counts (O and N), division into acceptors and donors, and more sophisticated measures such as free energy factors (used in program Hybot) and polar surface area.
10.4
Absorption / Permeability
When a compound is crossing a membrane by purely passive diffusion, a reasonable permeability estimate can be made using single molecular properties such as log D