

Pharmacokinetics and Metabolism in Drug Design Edited by D. A. Smith, H. van de Waterbeemd, D. K. Walker, R. Mannhold, H. Kubinyi, H.Timmerman
.pdf
|
|
1.1 Physicochemistry and Pharmacokinetics |
13 |
|
|
|
|
|
|
33 |
Leahy DE, Taylor PJ, Wait AR, Quant. |
44 |
Viswanadhan VN, Ghose AK, Revankar |
|
|
Struct. Activity Relat. 1989, 8, 17–31. |
|
GR, Robins RK, J. Chem. Inf. Comput. |
|
34 |
Leahy DE, Morris JJ, Taylor PJ, Wait AR, |
|
Sci. 1989, 29, 163–172. |
|
|
J. Chem. Soc. Perkin Trans. 1992, 2, |
45 |
Ghose AK, Crippen GM, J. Chem. Inf. |
|
|
723–731. |
|
Comput. Sci. 1987, 27, 21–35. |
|
35 |
Suzuki N, Yoshida Y, Watarai H, Bull. |
46 |
Meylan WM, Howard PH, J. Pharm. |
|
|
Chem. Soc. Jpn. 1982, 55, 121–125. |
|
Soc. 1995, 84, 83–92. |
|
36 |
Paterson DA, Conradi RA, Hilgers AR, |
47 |
Spessard GO, J. Chem. Inf. Comput. |
|
|
Vidmar ThJ, Burton PhS, Quant. Struct. |
|
Sci. 1998, 38, 55–57. |
|
|
Activity Relat. 1994, 13, 4–10. |
48 |
Buchwald P, Bodor N, Curr. Med. |
|
37 |
Yang CY, Cai SJ, Liu H, Pidgeon Ch, |
|
Chem. 1998, 5, 353–380. |
|
|
Adv. Drug Del. Rev. 1996, 23, 229–256. |
49 |
Carrupt PA, Testa B, Gaillard P, Rev. |
|
38 |
Ottiger C, Wunderli-Allenspach H, |
|
Comput. Chem. 1997, 11, 241–315. |
|
|
Pharm. Res. 1999, 16, 643–650. |
50 |
Van de Waterbeemd H, Mannhold R, |
|
39 |
Balon K, Riebesehl BU, Muller BW, |
|
Quant. Struct. Activity Relat. 1996, 15, |
|
|
Pharm. Res. 1999, 16, 882–888. |
|
410–412. |
|
40 |
Leo A, Chem. Rev. 1993, 93, 1281–1308. |
51 |
Mannhold R, Van de Waterbeemd H, |
|
41 |
Mannhold R, Rekker R.F, Dross K, |
|
J. Comput-Aid. Mol. Deg. 2001, 15, |
|
|
Bijloo G, De Vries G, Quant. Struct. |
|
337–354. |
|
|
Activity Relat. 1998, 17, 517–536. |
52 |
Moriguchi I, Hirono S, Nakagome I, |
|
42 |
Rekker RF, Mannhold R, Bijloo G, |
|
Hirano H, Chem. Pharm. Bull. 1994, |
|
|
De Vries G, Dross K, Quant. Struct. |
|
42, 976–978. |
|
|
Activity Relat. 1998, 17, 537–548. |
53 |
Leo A, ACS Meeting, Anaheim, 1999. |
|
43 |
Kellogg GE, Joshi GS, Abraham DJ, Med. |
54 |
Austin RP, Davis AM, Manners CN, |
|
|
Chem. Res. 1992, 1, 444–453. |
|
J. Pharm. Sci. 1995, 84, 1180–1183. |
|
|
|
55 |
Lullman H, Wehling M, Biochem. |
|
|
|
|
Pharmacol. 1979, 28, 3409–3415. |
|

Pharmacokinetics and Metabolism in Drug Design 15
Edited by D. A. Smith, H. van de Waterbeemd, D. K. Walker, R. Mannhold, H. Kubinyi, H. Timmerman Copyright © 2001 Wiley-VCH Verlag GmbH ISBNs: 3-527-30197-6 (Hardcover); 3-527-60021-3 (Electronic)
2
Pharmacokinetics
Abbreviations
ADME |
Absorption, distribution, metabolism and excretion |
CNS |
Central nervous system |
CYP2D6 |
Cytochrome P450 2D6 enzyme |
GIT |
Gastrointestinal tract |
i.v. |
Intravenous |
PET |
Positive emission tomography |
Symbols |
|
Aav |
Average amount of drug in the body over a dosing interval |
Amax |
Maximum amount of drug in the body over a dosing interval |
Amin |
Minimum amount of drug in the body over a dosing interval |
AUC |
Area under plasma concentration time curve |
Co |
Initial concentration after i. v. dose |
Cavss |
Average plasma concentration at steady state |
Cp(f) |
Free (unbound) plasma concentration |
Cp(f0) |
Initial free (unbound) plasma concentration |
Css |
Steady state concentration |
Cl |
Clearance |
Clu |
Unbound clearance |
ClH |
Hepatic clearance |
Cli |
Intrinsic clearance |
Cliu |
Intrinsic clearance of unbound drug |
Clo |
Oral clearance |
Clp |
Plasma clearance |
ClR |
Renal clearance |
Cls |
Systemic clearance |
DDose
EExtraction
EF |
Fractional response |
EM |
Maximum response |

16 2 Pharmacokinetics
FFraction of dose reaching systemic circulation (bioavailability)
fu |
Fraction of drug unbound |
KA |
Affinity constant |
KB |
Dissociation constant for a competitive antagonist |
Kd |
Dissociation constant |
kel |
Elimination rate constant |
Km |
Affinity constant (concentration at 50 % Vmax) |
ko |
Infusion rate |
k+1 |
Receptor on rate |
k–1 |
Receptor off rate |
LLigand
log D7.4 |
Distribution coefficient (octanol/buffer) at pH 7.4 |
ln2 |
Natural logarithm of 2 (i. e. 0.693) |
pA2 |
Affinity of antagonist for a receptor (= – log10[KB]) |
QBlood flow
RReceptor
RL |
Receptor ligand complex |
RO |
Receptor occupancy |
sSubstrate concentration
ttime after drug administration
TDosing interval
t1/2 |
Elimination half-life |
Vd |
Volume of distribution |
Vd(f) |
Apparent volume of distribution of free (unbound) drug |
Vmax |
Maximum rate of reaction (Michaelis–Menten enzyme kinetics) |
εDosing interval in terms of half-life (= T/t1/2)
2.1
Setting the Scene
Pharmacokinetics is the study of the time course of a drug within the body and incorporates the processes of absorption, distribution, metabolism and excretion (ADME). In general, pharmacokinetic parameters are derived from the measurement of drug concentrations in blood or plasma. The simplest pharmacokinetic concept is that based on total drug in plasma. However, drug molecules may be bound to a greater or lesser extent to the proteins present within the plasma, thus free drug levels may be vastly different from those of total drug levels. Blood or plasma are the traditionally sampled matrices due to (a) convenience and (b) to the fact that the concentrations in the circulation will be in some form of equilibrium with the tissues of the body. Because of analytical difficulties (separation, sensitivity) it is usually the total drug that is measured and used in pharmacokinetic evaluation. Such measurements and analysis are adequate for understanding a single drug in a single species in a number of different situations since both protein binding and the resultant unbound fraction are approximately constant under these conditions. When species or

2.2 Intravenous Administration: Volume of Distribution 17
drugs are compared, certain difficulties arise in the use of total drug and unbound (free) drug is a more useful measure (see below).
2.2
Intravenous Administration: Volume of Distribution
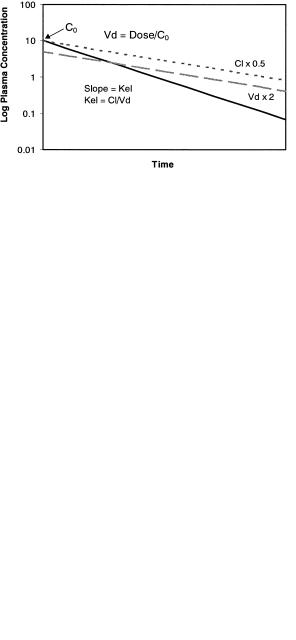
When a drug is administered intravenously into the circulation the compound undergoes distribution into tissues etc. and clearance. For a drug that undergoes rapid distribution a simple model can explain the three important pharmacokinetic terms: volume of distribution, clearance and half-life.
Volume of distribution (Vd) is a theoretical concept that connects the administered dose with the actual initial concentration (C0) present in the circulation. The relationship is shown below:
Vd = Dose/C0 |
(2.1) |
For a drug that is confined solely to the circulation (blood volume is 80 mL kg–1) the volume of distribution will be 0.08 L kg–1. Distribution into total body water (800 mL kg–1) results in a volume of distribution of 0.8 L kg–1. Beyond these values the number has only a mathematical importance. For instance a volume of distribution of 2 L kg–1 means only, that less than 5 % of the drug is present in the circulation. The drug may be generally distributed to many tissues and organs or concentrated in only a few.
For different molecules, the apparent volume of distribution may range from about 0.04 L kg–1 to more than 20 L kg–1. High molecular weight dyes, such as indocyanine green, are restricted to the circulating plasma after intravenous administration and thus exhibit a volume of distribution of about 0.04 L kg–1. For this reason such compounds are used to estimate plasma volume [1] and hepatic blood flow [2]. Certain ions, such as chloride and bromide, rapidly distribute throughout extracellular fluid, but do not readily cross cell membranes and therefore exhibit a volume of distribution of about 0.4 L kg–1 which is equivalent to the extracellular water volume [3]. Neutral lipid-soluble substances can distribute rapidly throughout intracellular and extracellular water. For this reason antipyrine has been used as a marker of total body water volume and exhibits a volume of distribution of about 0.7 L kg–1 [4]. Compounds which bind more favourably to tissue proteins than to plasma proteins can exhibit apparent volumes of distribution far in excess of the body water volume. This is because the apparent volume is dependent on the ratio of free drug fractions in the plasma and tissue compartments [5]. High tissue affinity is most commonly observed with basic drugs and can lead to apparent volumes of distribution up to 21 L kg–1 for the primary amine-containing calcium channel blocker, amlodipine [6].

182 Pharmacokinetics
2.3
Intravenous Administration: Clearance
Clearance of drug occurs by the perfusion of blood to the organs of extraction. Extraction (E) refers to the proportion of drug presented to the organ which is removed irreversibly (excreted) or altered to a different chemical form (metabolism). Clearance (Cl) is therefore related to the flow of blood through the organ (Q) and is expressed by the formula:
Cl = Q · E |
(2.2) |
The organs of extraction are generally the liver (hepatic clearance – metabolism and biliary excretion; ClH) and the kidney (renal excretion, ClR) and the values can be summed together to give an overall value for systemic clearance (ClS):
ClS = ClH + ClR |
(2.3) |
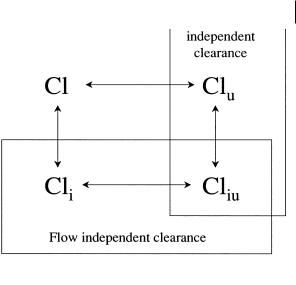
Extraction is the ratio of the clearance process compared to the overall disappearance of the compound from the organ. The clearance process is termed intrinsic clearance Cli, the other component of disappearance is the blood flow (Q) from the organ. This is shown in Figure 2.1 below.
Fig. 2.1 Schematic illustrating hepatic extraction with Q, blood flow and Cli, intrinsic clearance (metabolism).
Combining Eqs. (2.2) and (2.3) with the scheme in Figure 2.1 gives the general equation for clearance:
Cl = Q · Cli/(Q + Cli) |
(2.4) |
Where Cl = ClS if only one organ is involved in drug clearance. Within this equation Cli is the intrinsic clearance based on total drug concentrations and therefore includes drug bound to protein. Lipophilic drugs bind to the constituents of plasma (principally albumin) and in some cases to erythrocytes. It is a major assumption, supported by a considerable amount of experimental data, that only the unbound (free) drug can be cleared. The intrinsic clearance (Cli) can be further defined as:
Cli = Cliu · fu |
(2.5) |
Where Cliu is the intrinsic clearance of free drug, i. e. unrestricted by either flow or binding, and fu is the fraction of drug unbound in blood or plasma.
Inspection of the above equation indicates for compounds with low intrinsic clearance compared to blood flow, Q and (Cli + Q) effectively cancel and Cl (or ClS) approximates to Cli. Conversely, when intrinsic clearance is high relative to blood flow,
2.4 Intravenous Administration: Clearance and Half-life 19
Fig. 2.2 Inter-relationship between various terms of drug clearance used within pharmacokinetic analysis.
Cli and (Cli + Q) effectively cancel and Cl (or ClS) is equal to blood flow (Q). The implications of this on drugs cleared by metabolism is that the systemic clearance of low clearance drugs are sensitive to changes in metabolism rate whereas that of high clearance drugs are sensitive to changes in blood flow.
It is important to recognize the distinction between the various terms used for drug clearance and the inter-relationship between these. Essentially intrinsic clearance values are independent of flow through the organ of clearance, whilst unbound clearance terms are independent of binding. These relationships are illustrated in Figure 2.2.
2.4
Intravenous Administration: Clearance and Half-life
Clearance is related to the concentrations present in blood after administration of a drug by the equation:
Cl = Dose/AUC |
(2.6) |
where AUC is the area under the plasma concentration time curve. Clearance is a constant with units often given as mL min–1 or mL min–1 kg–1 body weight. These values refer to the volume of blood totally cleared of drug per unit time. Hepatic blood flow values are 100, 50 and 25 mL min–1 kg–1 in rat, dog and man respectively. Blood clearance values approaching these indicate that hepatic extraction is very high (rapid metabolism).
Blood arriving at an organ of extraction normally contains only a fraction of the total drug present in the body. The flow through the major extraction organs, the liver and kidneys, is about 3 % of the total blood volume per minute, however, for many
20 2 Pharmacokinetics
drugs, distribution out of the blood into the tissues will have occurred. The duration of the drug in the body is therefore the relationship between the clearance (blood flow through the organs of extraction and their extraction efficiency) and the amount of the dose of drug actually in the circulation (blood). The amount of drug in the circulation is related to the volume of distribution and therefore to the elimination rate constant (kel) which is given by the relationship:
kel = Cl/Vd |
(2.7) |
The elimination rate constant can be described as a proportional rate constant. An elimination rate constant of 0.1 h–1 means that 10 % of the drug is removed per hour.
The elimination rate constant and half-life (t1/2), the time taken for the drug concentration present in the circulation to decline to 50 % of the current value, are related by the equation:
t1/2 = ln2/kel |
(2.8) |
Half-life reflects how often a drug needs to be administered. To maintain concentrations with minimal peak and trough levels over a dosing interval a rule of thumb is that the dosing interval should equal the drug half-life. Thus for once-a-day administration a 24-h half-life is required. This will provide a peak-to-trough variation in plasma concentration of approximately two-fold. In practice the tolerance in peak- to-trough variation in plasma concentration will depend on the therapeutic index of a given drug and dosing intervals of two to three half-lives are not uncommon.
The importance of these equations is that drugs can have different half-lives due either to changes in clearance or changes in volume (see Section 2.7). This is illustrated in Figure 2.3 for a simple single compartment pharmacokinetic model where the half-life is doubled either by reducing clearance to 50 % or by doubling the volume of distribution.
Fig. 2.3 Effect of clearance and volume of distribution on half-life for a simple single compartment pharmacokinetic model.
2.5
Intravenous Administration: Infusion
With linear kinetics, providing an intravenous infusion is maintained long enough, a situation will arise when the rate of drug infused = rate of drug eliminated. The
2.5 Intravenous Administration: Infusion 21
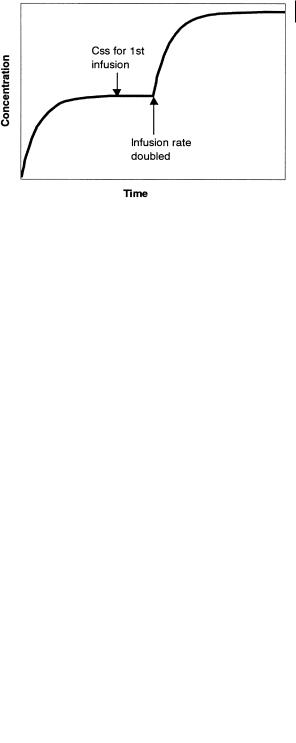
Fig. 2.4 Plasma concentration profile observed after intravenous infusion.
plasma or blood concentrations will remain constant and be described as “steady state”. The plasma concentration profile following intravenous infusion is illustrated in Figure 2.4.
The steady state concentration(Css) is defined by the equation:
Css = ko/Clp |
(2.9) |
where ko is the infusion rate and Clp is the plasma (or blood) clearance. The equation which governs the rise in plasma concentration is shown below where the plasma concentration (Cp) may be determined at any time (t).
Cp = ko / Clp (1 – e–kel · t) |
(2.10) |
Thus the time taken to reach steady state is dependent on kel. The larger kel (shorter the half-life) the more rapidly the drug will attain steady state. As a guide 87 % of steady state is attained when a drug is infused for a period equal to three half-lives. Decline from steady state will be as described above, so a short half-life drug will rapidly attain steady state during infusion and rapidly disappear following the cessation of infusion.
Fig. 2.5 Intravenous infusion with infusion rate doubled.

22 2 Pharmacokinetics
Increasing the infusion rate will mean the concentrations will climb until a new steady state value is obtained. Thus doubling the infusion rate doubles the steady state plasma concentration as illustrated in Figure 2.5.
2.6
Oral Administration
When a drug is administered orally, it has to be absorbed across the membranes of the gastrointestinal tract. Incomplete absorption lowers the proportion of the dose able to reach the systemic circulation. The blood supply to the gastrointestinal tract (GIT) is drained via the hepatic portal vein which passes through the liver on its passage back to the heart and lungs. Transport of the drug from the gastrointestinal tract to the systemic circulation will mean the entire absorbed dose has to pass through the liver.
On this “first-pass” the entire dose is subjected to liver extraction and the fraction of the dose reaching the systemic circulation (F) can be substantially reduced (even for completely absorbed drugs) as shown in the following equation:
F = 1 – E |
(2.11) |
Again E is the same concept as that shown in Figure 2.1. This phenomenon is termed the first-pass effect, or pre-systemic metabolism, and is a major factor in reducing the bioavailability of lipophilic drugs. From the concept of extraction shown in Figure 2.1, rapidly metabolized drugs, with high Cli values, will have high extraction and high first-pass effects. An example of this type of drug is the lipophilic calcium channel blocker, felodipine. This compound has an hepatic extraction of about 0.80, leading to oral systemic drug exposure (AUC) of only about one-fifth of that observed after intravenous administration [7]. Conversely, slowly metabolized drugs, with low Cli values, will have low extraction and show small and insignificant firstpass effects. The class III anti-dysrhythmic drug, dofetilide, provides such an example. Hepatic extraction of this compound is only about 0.07, leading to similar systemic exposure (AUC) after oral and intravenous doses [8].
Fig. 2.6 Schematic illustrating the disposition of a drug after oral administration.

2.7 Repeated Doses 23
A complication of this can be additional first-pass effects caused by metabolism by the gastrointestinal tract itself. In the most extreme cases, such as midazolam, extraction by the gut wall may be as high as 0.38 to 0.54 and comparable to that of the liver itself [9].
The previous equations referring to intravenously administered drugs (e. g. Eq. 2.6) can be modified to apply to the oral situation:
Clo = F · Dose/AUC |
(2.12) |
Where Clo is the oral clearance and F indicates the fraction absorbed and escaping hepatic first-pass effects. Referring back to the intravenous equation we can calculate F or absolute bioavailability by administering a drug intravenously and orally and measuring drug concentrations to derive the respective AUCs. When the same dose of drug is given then:
F = AUCoral/AUCi.v. |
(2.13) |
The estimation of systemic clearance together with this value gives valuable information about the behaviour of a drug. High clearance drugs with values approaching hepatic blood flow will indicate hepatic extraction (metabolism) as a reason for low bioavailability. In contrast poor absorption will probably be the problem in low clearance drugs which show low bioavailabilities.
2.7
Repeated Doses
When oral doses are administered far apart in time they behave independently. This is usually not the desired profile if we assume that a certain concentration is needed to maintain efficacy and if a certain concentration is exceeded side-effects will occur. Giving doses of the drug sufficiently close together so that the following doses are administered prior to the full elimination of the preceding dose means that some accumulation will occur, moreover a smoothing out of the plasma concentration profile will occur. This is illustrated in Figure 2.7.
Fig. 2.7 Plasma concentration profile for multiple oral dose administration.