

Pharmacokinetics and Metabolism in Drug Design Edited by D. A. Smith, H. van de Waterbeemd, D. K. Walker, R. Mannhold, H. Kubinyi, H.Timmerman
.pdf34
References
1Haller M, Akbulut C, Brechtelsbauer H, Fett W, Briegel J, Finsterer U. Peter K, Life Sci. 1993, 53, 1597–1604.
2Burns E, Triger DR, Tucker GT, Bax NDS, Clin. Sci. 1991, 80, 155–160.
3Wong WW, Sheng HP, Morkeberg JC, Kosanovich JL, Clarke LL, Klein PD,
Am. J. Clin. Nutr. 1989, 50, 1290–1294.
4 Brans YW, Kazzi NJ, Andrew DS, Schwartz CA, Carey KD, Biol. Neonate 1990, 58, 137–144.
5Gibaldi M, McNamara PJ, Eur. J. Clin. Pharmacol. 1978, 13, 373–378.
6Stopher DA, Beresford AP, Macrae PV, Humphrey MJ, J. Cardiovasc. Pharmacol.
1988, 12, S55–S59.
7Edgar B, Regardh CG, Johnsson G, Johansson L, Lundborg P, Loftberg I,
Ronn O, Clin. Pharmacol. Ther. 1985,
38, 205–211.
8Smith DA, Rasmussen HS, Stopher DA, Walker DK, Xenobiotica 1992, 22, 709–719.
9Thummel KE, Kunze KL, Shen DD,
Adv. Drug Delivery Rev. 1997, 27, 99–127.
10Green SA, Spasoff AP, Coleman RA, Johnson M, Liggett SB, J. Biol. Chem. 1996, 271, 24029–24035.
11Schudt C, Auriga C, Kinder B, Birdsall NJM, Eur. J. Pharmacol. 1988, 145, 87–90.
12Leysen JE, Gommeren W, Drug Dev. Res. 1986, 8, 119–131.

Pharmacokinetics and Metabolism in Drug Design 35
Edited by D. A. Smith, H. van de Waterbeemd, D. K. Walker, R. Mannhold, H. Kubinyi, H. Timmerman Copyright © 2001 Wiley-VCH Verlag GmbH ISBNs: 3-527-30197-6 (Hardcover); 3-527-60021-3 (Electronic)
3
Absorption
Abbreviations
AUC |
Area under the curve of a concentration time profile |
Caco-2 |
Human colon adenocarcinoma cell line used as absorption model |
g. i. |
Gastrointestinal |
MDCK |
Madin–Darby Canine Kidney cell line used as absorption model |
Symbols |
|
A % |
Percentage of dose absorbed as measured in portal vein |
CLOGP |
MedChem/Biobyte log P estimation program |
F % |
Percentage of dose bioavailable |
Fa |
Fraction absorbed |
Fnon |
Fraction non-ionised at pH 6.5 |
IFV |
Intestinal fluid volume (250 ml) |
ka |
Absorption rate constant in rats (min–1) |
log D |
Logarithm of distribution coefficient |
log P |
Logarithm of partition coefficient |
log S |
Logarithm of solubility in water |
RT |
Average residence time in the small intestine (270 min) |
SSolubility in phosphate buffer at pH 6.5
So |
Intrinsic solubility of the neutral species at 37 °C |
VL |
Volume of the lumenal contents |
Xo |
Dose administered |
3.1
The Absorption Process
The oral absorption of a drug is dependent on the compound dissolving in the aqueous contents of the gastrointestinal tract (dissolution) and then traversing the actual barrier of the gastrointestinal tract to reach the blood (Figure 3.1).
36 3 Absorption
Fig. 3.1 Schematic simplified view of the absorption process.
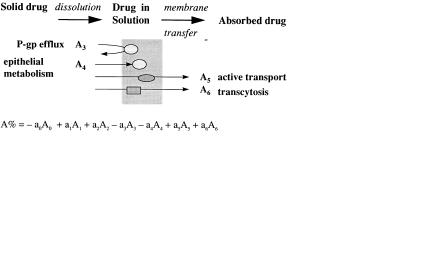
For a number of reasons membrane transfer may be limited (see Figure 3.2) and therefore absorption incomplete. In this chapter these processes will be discussed.
Fig. 3.2 Mechanisms of membrane permeation [1]. The total percentage of the dose absorbed may be the result of a combination of several of these processes.
3.2
Dissolution
Dissolution depends on the surface area of the dissolving solid and the solubility of the drug at the surface of the dissolving solid. Considering these factors separately surface area is manipulated by the processing and formulation of the compound. Milling and micronization convert the drug into smaller particles with consequently greater surface area. In actual clinical use the compaction of the particles into tablets is offset by formulation with disintegrants. Certain formulations use a co-solvent such as polyethylene glycol (PEG) which is an organic solvent with water miscible properties.
Solubility is manipulated mainly by the structure of the drug. Broadly, solubility is inversely proportional to the number and type of lipophilic functions within the molecule and the tightness of the crystal packing of the molecule. Yalkowski [2] has produced a general solubility (log S) equation, for organic non-electrolytes. The equation incorporates the entropy of melting (∆Sm) and melting point (m. p. in °C) as a measure of crystal packing and log P as a measure of lipophilicity.
log S = (∆Sm (m.p. – 25)/1364) – log P + 0.80 |
(3.1) |
This equation can be further simplified to |
|
log S = – log P – 0.01 m.p. + 1.2 |
(3.2) |
It can be seen from the above that increases in either crystal packing or lipophilicity will decrease solubility.
The rate of dissolution is effected by solubility as is the actual concentration of drug in the bulk of the solution (aqueous contents of gastrointestinal tract). The concentration of drug in solution is the driving force of the membrane transfer of drug

3.3 Membrane Transfer 37
into the body and low aqueous solubility often continues to present itself as a problem even after formulation improvements.
A number of drugs have very low aqueous solubility, mainly due to very high lipophilicity, but also due to lack of ionizable centres, and also the tight crystal packing referred to above. These drugs are erratically and incompletely absorbed due to this inability to dissolve in the gastrointestinal tract following oral administration. Examples of low solubility, dissolution limited drugs include danazole, griseofulvin, halofantrine, ketoconzaole, nitrofurantoin, phenytoin and triamterene [3,4]. Poor dissolution is responsible for both intraand inter-patient variability in drug absorption and therefore represents a major problem in drug design.
If a drug has an ionizable centre then solubility can be improved by salt formation. In the absence of a salt basic drugs will also have increased solubility in the acidic environment of the stomach.
The incorporation of an ionizable centre, such as an amine or similar function, into a template can bring a number of benefits including water solubility. A key step [5] in the discovery of indinavir was the incorporation of a basic amine (and a pyridine) into the backbone of hydroxyethylene transition state mimic compounds (Figure 3.3) to enhance solubility (and potency).
Fig. 3.3 Structures of lead compound L-685,434 and indinavir which incorporates basic functions aiding water solubility.
3.3
Membrane Transfer
The barrier of the gastrointestinal tract is similar to any other that involves the crossing of biological membranes. Biomembranes are composed of a lipid-bilayer [6]. The bilayer results from the orientation of the lipids (phospholipids, glycolipids and cholesterol) in the aqueous medium. Phospholipids are amphipathic with polar head groups and lipid “tails” and align so that the polar head groups orientate towards the aqueous medium and the lipid tails form an inner hydrophobic core. Because of the high flexibility of membrane lipids they are able to perform transversal/lateral movements within the membrane. A variety of proteins such as selective ion channels (Na+, K+, Ca2+, Cl–) are embedded within the membrane. Tight junctions are formed

38 3 Absorption
by the interaction of membrane proteins at the contact surfaces between single cells. Tight junctions are in reality small aqueous-filled pores. The dimensions of these pores have been estimated to be in the range of 3–10 Å. The number and dimensions of the tight junctions depend on the membrane type. For the small intestine these tight junctions make up about 0.01 % of the whole surface. Thus the surface area of the actual biological membrane is much greater than that of the aqueous pores (tight junctions).
Compounds can cross biological membranes by two passive processes, transcellular and paracellular mechanisms. For transcellular diffusion two potential mechanisms exist. The compound can distribute into the lipid core of the membrane and diffuse within the membrane to the basolateral side. Alternatively, the solute may diffuse across the apical cell membrane and enter the cytoplasm before exiting across the basolateral membrane. Because both processes involve diffusion through the lipid core of the membrane the physicochemistry of the compound is important. Paracellular absorption involves the passage of the compound through the aqueousfilled pores. Clearly in principle many compounds can be absorbed by this route but the process is invariably slower than the transcellular route (surface area of pores versus surface area of the membrane) and is very dependent on molecular size due to the finite dimensions of the aqueous pores.
The actual amount of a drug absorbed (Fa) is dependent on two rates: the rate of absorption (ka) and the rate of disappearance of the drug from the absorption site. Disappearance can be due to absorption (ka) or movement of the drug (km) through the gastrointestinal tract and away from the absorption site. The proportion absorbed can be expressed as:
Fa = ka/(ka + km) |
(3.3) |
Compounds crossing the gastrointestinal tract via the transcellular route can usually be absorbed throughout the length of the tract. In contrast the paracellular route is only, readily, available in the small intestine and the term “absorption window” is often applied. The calculated human pore sizes (radii) are, jejunum 6–8 Å, ileum 2.9–3.8 Å and colon less than 2.3 Å. In practice the small intestine transit time is around 6 h whilst transit of the whole tract is approximately 24 h. For lipophilic compounds, with adequate dissolution, which have high rates of transcellular passage across membranes, ka has a high value. Moreover, since the drug is absorbed throughout the g.i. tract km is of a low value and therefor the proportion of a dose absorbed is high (complete). For hydrophilic compounds, which are dependent on the slow paracellular pathway, ka has a low value. Moreover, the “absorption window” referred to above means that the drug rapidly moves away from the absorption site and km is high. Consequently paracellularly absorbed compounds show incomplete absorption and the proportion which is absorbed is low. Table 3.1 gives examples of compounds absorbed by the paracellular route.
What is noticeable is that the compounds are of low molecular weight, however, there is no simple relationship between molecular weight and percentage absorbed, probably indicating that shape and possibly flexibility are also of importance. Compounds such as propranolol (log D7.4, 0.9) which are related to those in Table 3.1,

3.3 Membrane Transfer 39
Tab. 3.1 Examples of drugs absorbed by the paracellular route.
Compound |
log D7.4 |
Molecular weight |
% Absorbed |
Nadolol |
– 2.1 |
309 |
13 |
Sotalol |
– 1.7 |
272 |
100 |
Atenolol |
– 1.5 |
266 |
51 |
Practolol |
– 1.3 |
266 |
100 |
Xamoterol |
– 1.0 |
339 |
9 |
Amosulalol |
– 0.8 |
380 |
100 |
Sumatriptan |
– 0.8 |
295 |
60 |
Pirenzipine |
– 0.6 |
351 |
25 |
Famotidine |
– 0.6 |
338 |
37 |
Ranitidine |
– 0.3 |
314 |
50 |
|
|
|
|
show high flux rates via the transcellular route and consequently are completely absorbed. Note, however, that lipophilicity correlates with increased metabolic lability and such compounds may have their apparent systemic availabilities decreased by metabolism as they pass through the gut and the liver.
For simple molecules, like β-adrenoceptor antagonists octanol/water log D7.4 values are remarkably predictive of absorption potential. Compounds with log D7.4 values below 0 are absorbed predominantly by the paracellular route and compounds with log D7.4 values above 0 are absorbed by the transcellular route.
Another example of the relationship between log D values and intestinal absorption is taken from reference [1] (see Figure 3.4). Compounds with log D > 0 demonstrate a nearly complete absorption. Two exceptions are compounds with a MW above 500. Whether size as such, or the accompanying increase in the number of H-bonds, is responsible for poorer absorption is not fully understood.
Fig. 3.4 Dependence of oral absorption on log D [1].
However, as the number of H-bonding functions in a molecule rises, octanol/ water distribution, in isolation, becomes a progressively less valuable predictor. For such compounds desolvation and breaking of H-bonds becomes the rate-limiting step in transfer across the membrane [7].
40 3 Absorption
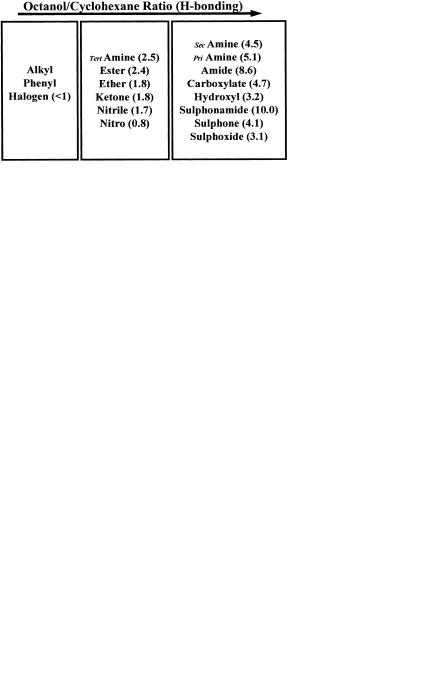
Fig. 3.5 Raevsky H-bond scores from HYBOT95 (shown in parentheses) and correlation with Dlog D (compare with Figure 1.2 in Chapter 1).
Methods to calculate H-bonding potential range from simple H-bond counts (number of donors and acceptors), through systems that assign a value of 1 for donors and 0.5 for acceptors to sophisticated scoring systems such as the Raevsky H-bond score [8]. The correlation of Raevsky H-bond scores with ∆log D shown previously as Figure 1.4 in Chapter 1 (Physicochemistry) is shown as Figure 3.5.
None of these methods gives a perfect prediction, particularly because H-bonding potential needs to be overlaid over intrinsic lipophilicity. For this reason Lipinski’s “rule-of-five” becomes valuable in defining the outer limits in which chemists can work [9]. Lipinski defined the boundaries of good absorption potential by demonstrating that poor permeability is produced by:
•more than five H-bond donors (sum of OHs and NHs)
•more than 10 H-bond acceptors (sum of Ns and Os)
•molecular weight over 500
•poor dissolution by log P over 5
The medicinal chemist can use these rules and understand the boundaries and
work towards lowering these values. Figure 3.6 shows a synthetic strategy aimed at removing H-bond donors from a series of endothelin antagonists and a resultant increase in apparent bioavailability as determined by intra-dueodenal AUC [10]. Noticeabl CLOGP values vary only marginally with the changes in structure, values being 4.8, 5.0, 4.8 and 5.5 for compounds A, B, C and D respectively. In contrast the
Fig. 3.6 Removal of H-bond donors as a synthetic strategy for a series of azole-containing endothelin antagonists aimed at improving bioavailability by lowering H-bonding potential [10].
3.4 Barriers to Membrane Transfer 41
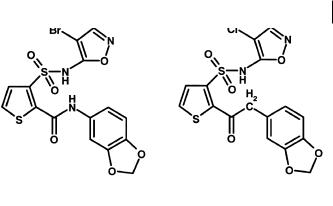
Fig. 3.7 Replacement of amide with acetyl in a series of amidothiophenesulfonamide en- dothelin-A antagonists to improve oral bioavailability [11].
number of H-bond donors is reduced by 3 and the Raevsky score from 28.9 (A) to 21.4 (D).
A similar example, also from endothelin antagonists, is the replacement of the amide group (Figure 3.7) in a series of amidothiophenesulfonamides with acetyl [11]. This move retained in vitro potency, but markedly improved oral bioavailability.
3.4
Barriers to Membrane Transfer
The cells of the gastrointestinal tract contain a number of enzymes of drug metabolism and also various transport proteins. Of particular importance in the attenuation of absorption/bioavailability are the glucuronyl and sulphotransferases which metabolize phenol-containing drugs (see below) sufficiently rapidly to attenuate the passage of intact drug across the gastrointestinal tract. Cytochrome P450 enzymes are also present, in particular CYP3A4 (see Chapter 7) and again certain substrates for the drug may be metabolized during passage across the tract. This effect may be greatly enhanced by the action of the efflux pumps, in particular P-glycoprotein. The range of substrates for P-glycoprotein is large but includes a number of relatively large molecular weight drugs which are also CYP3A4 substrates. Cyclosporin A is one example. This drug shows significant attenuation of absorption across the gastrointestinal tract due to metabolism. Metabolism by the gut is greater than many other examples of CYP3A4 substrates. It can be postulated that in effect absorption of the drug is followed by secretion back into the lumen of the gut by P-glycoprotein. This cyclical process effectively exposes cyclosporin A to “multi-pass” metabolism by CYP3A4 and a resultant reduced appearance of intact cyclosporin A in the circulation.
Detailed structure–activity relationships of P-glycoprotein are not yet available. Some understanding is provided by Seelig [12] who has compared structural features in P-glycoprotein substrates. This analysis has indicated that recognition elements are present in structures and are formed by two (type I) or three electron donor groups (type II) with a fixed spatial separation. The type I element consists of two electron donor groups separated by 2.5 Å, whilst the type II elements has a spatial
42 3 Absorption
separation of the outer groups of 4.6 Å. All molecules that are P-glycoprotein substrates contain at least one of these groups and the affinity of the substrate for P-gly- coprotein depends on the strength and number of electron donor or hydrogen bond acceptor groups. For the purpose of this analysis all groups with an unshared electron pair on an electronegative atom (O, N, S or F and Cl), or groups with a π-elec- tron orbital of an unsaturated system, were considered as electron donors. However, this analysis did not account for the directionality of the H-bonds.
The dramatic effect of a single unit is shown in Figure 3.8 for a series of betaadrenoceptor antagonists.
Fig. 3.8 Structures of propranolol (1), betaxolol (2), metoprolol (3) and talinolol (4) and their respective extraction by the gastointestinal tract (E(g. i.)) and liver E(h)
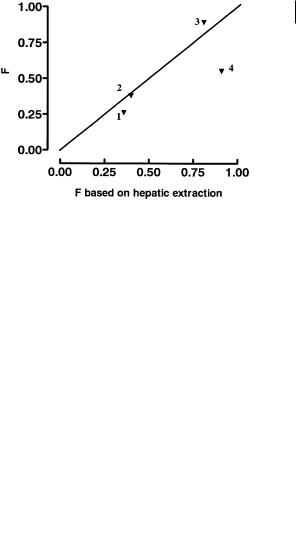
All these compounds are moderately lipophilic and should show excellent ability to cross biological membranes by transcellular absorption. Propranolol, betaxolol and metoprolol all have minimal gut first-pass metabolism, as shown by the low value for E(g. i.). Metabolism and first pass effects for these compounds are largely confirmed to the liver as shown by the values for E(g. i.). In contrast talinolol shows high extraction by the gastrointestinal tract with low liver extraction [13]. These effects are illustrated graphically in Figure 3.9 which shows the bioavailability predicted from hepatic extraction contrasted with that seen in vivo in man.
Noticeably propranolol, betaxolol and metoprolol are close or on the borderline for hepatic first-pass effects, whereas talinolol falls markedly below it. Talinolol has been shown to be a substrate for P-glycoprotein [14]. The effect of the urea function is of key importance within this change, as urea lacks a strong type I unit in terms of Seel-
3.4 Barriers to Membrane Transfer 43
Fig. 3.9 Bioavailability (F) of propranolol (1), betaxolol (2), metoprolol (3) and talinolol (4) found in vivo in man compared to that predicted based solely on hepatic extraction.
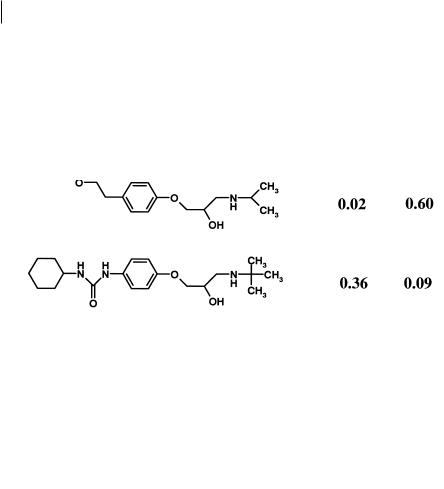
ig’s classification. Other changes in the molecule, such as the tertiary butyl, rather than isopropyl N-substituent are not so important since the related compounds pafenolol and celiprolol (Figure 3.10) also show similar bioavailability.
Fig. 3.10 Structures of pafenolol and celiprolol, derivatives of the talinolol (see Figure 3.6) structure which show similar bioavailability characteristics.
These considerations are important in pro-drug design and add to the complexity referred to earlier. Many active principles in pro-drug programmes are nonlipophilic compounds, possessing a number of H-bond donor and acceptor functions (amide or peptide linkages). Addition of a pro-moiety will raise the lipophilicity and molecular weight. In doing so the final molecule may have the required structure to traverse the lipid core of a membrane, but this advantage is lost by it becoming a substrate for efflux. An example (Figure 3.11) of this is the fibrinogen receptor antagonist L-767,679, a low lipophilicity compound (log P < – 3) with resultant low membrane flux. The benzyl ester (L-775,318) analogue (log P 0.7) also showed limited absorption, and studies in Caco-2 cells (see Section 3.5) showed the compound to be effluxed by P-glycoprotein [15].