

A BRIEF REVIEW OF METHODOLOGY |
23 |
platforms can be established, further technical advances are required to improve general performances and multiplexing capacity.
3.5Fluorescent Imaging
For centuries, light microscopy has constituted the most direct means of monitoring live cell dynamics as they occur. Along with transmitted light observations, fluorescence labeling techniques have generated the greatest advances and successes in the study of the spatial and temporal organization of subcellular structures at a single molecule level. Initially, fluorescent dyes were utilized to localize individual proteins in immobilized and permeabilized dead samples by indirect immunofluorescence, in which an antibody specific for the target protein was used for highly selective recognition. Detection occurs by a second, fluorescently labeled antibody that binds to the constant moiety of the first one [84]. To enable the investigation of structures and dynamics in live cells, a wide range of dyes permeable to the cell membrane have been developed to highlight structural components and, to some extent, cellular functions [69]. However, the permeability of dyes, and thus the general applicability of staining protocols, is affected by the often different composition of the cell membrane and the additional presence of cell walls in nonanimal cells. This problem is partially circumvented by microinjection, at least for those cell classes that can be microinjected and compartments that are accessible. In fact, microinjection is still used to introduce fluorescently labeled oligonucleotides to monitor gene expression in single cells by fluorescence in situ hybridization [85]. In contrast, to track a given protein in living cells with a fluorescent dye, it has to be extracted, purified, tagged with the fluorophore, and re-injected. These procedures are tedious, since proteins with low abundances or those incorporated in complexes are difficult to enrich, and microinjection has to be repeated for each observed cell.
This changed drastically with the cloning of the green fluorescent protein (GFP) from the jellyfish Aequorea. The proteic nature of GTP makes it possible to label fluorescently virtually any protein by fusing the GFP-encoding gene to the end of the gene of interest using recombinant DNA techniques. The native gene in the chromosome can be replaced by the tagged form to label automatically and endogenously all the copies of the protein of interest. GFP fusions replace external labeling protocols and, hence, afford the means to study proteins that are difficult to isolate, to apply live imaging in cells that are not suitable for microinjection, or even to track gene expression in whole organisms [86]. Several mutants of GFP have been isolated with different excitation and emission spectra, such as yellow (YFP), cyan (CFP), or blue fluorescence proteins (BFP) [87]. Additionally, a novel red fluorescent protein (RFP) was cloned from Discosoma coral [88]. These color variants allow for simultaneous tracking of multiple proteins, quantifying their occurrence in complex structures, or monitoring gene expression levels. Boosted by the unlimited availability of fluorescently tagged proteins and the increasing demand for in vivo analyses, several imaging techniques have been developed. We briefly review their basic principles and applications.
3.5.1Photobleaching and Photoactivation
With scanning confocal microscopy, a beam of light can be focused on a small area. If such a localized beam is used to excite a fluorophore, this can inactivate it and lead to
24 DETERMINATION OF COMPLEX REACTION MECHANISMS
an irreversible loss of fluorescence. Upon this so-called photobleaching, fluorescence at the targeted spot can be restored only by replacement of the fluorophore. Therefore, the time for fluorescence recovery after photobleaching (FRAP) is used to infer the turnover of a protein in complexes [89], or estimate diffusion coefficients in cellular compartments [90] and membranes [91]. An extension to FRAP and its related fluorescence loss in photobleaching technique (FLIP) [92] employs two different fluorophores tagged on the same protein. By the selective bleaching of only one fluorophore, this innovation permits the tracking of the localization of bleached proteins over time after the photobleaching event, and to distinguish them from the unbleached fraction by ratiometric measurement.
A proof-of-principle for this method, termed fluorescence localization after photobleaching (FLAP), was provided in experiments with CFP and YFP in the demonstration of the different relocation dynamics between the monomeric and the filamentous forms of actin in living cells [93]. In an alternative to FLAP, similar readouts may be obtained using photoactivation [94], by which the fluorescent emission of the probe is increased upon illumination at a specific wavelength and the activated fluorophores are tracked in time. Photoactivatable GFP variants exhibit a 100-fold increase in fluorescence upon exposure to 400 nm light [87]. Additionally, RFP mutants were isolated with UVinduced green to red fluorescence [95], or a green-induced increase of red fluorescence [96]. Photoactivatable protein can also be obtained using photo-decaging fluorescent tags [97]. Since labeling has to be accomplished externally, this approach is rarely preferred to fluorescent protein fusions. Caged probes have been used, for example, to great advantage in the investigation of phosphorylation-dependent protein–protein interactions [98].
3.5.2 Fluorescence Speckle Microscopy (FSM)
FSM is a method for analyzing the assembly, disassembly, and movement of macromolecular structures in vivo (or in vitro) [99,100]. Compared to photobleaching and photoactivation-based approaches, FSM delivers similar information, but on a larger area of the cell. A small fraction of the monomer proteins that make up the assembled polymeric complex is fluorescently labeled and microinjected. Upon incorporation of labeled samples into the polymer, fluorescent speckles become visible by microscopy because of the variable number of fluorophores in each resolution-limited image region. If the relative amounts of labeled and unlabeled monomers are chosen properly depending on the monomer size, fluorescent emission wavelength, and numerical aperture of the microscope, the speckles mark the macromolecules with a discontinuous pattern similar to a barcode. The movement, appearance, and disappearance of speckles, corresponding to movement, polymerization, and depolymerization of the macromolecule, respectively, are tracked over time by wide field or spinning disk confocal fluorescence microscopy to ensure high temporal (5 s) and spatial resolution (0.25 µm). Image deconvolution and kinetic analysis are then performed by powerful algorithms on the basis of the trajectory from birth to death for each of the many thousands of speckles [101]. FSM has been applied to the study of cytoskeleton dynamics during cell migration, division, and morphogenesis [99,102].
A BRIEF REVIEW OF METHODOLOGY |
25 |
3.5.3Total Internal Reflection Fluorescence Microscopy (TIRFM)
When incident light passes from a medium with a high refractive index to one with a lower index, such as from glass to the aqueous cellular cytosol, total reflection occurs at the interface for incidence angles exceeding a critical value. Despite total reflection, an evanescent field with the same wavelength as the incident light is created in the aqueous phase (the cell) in the proximity of the reflection spot, and decays exponentially in space. In TIRFM, a totally reflected light beam is used to excite selectively those fluorophores that are very close to the coverslip, typically 50–100 nm [103,104]. This technique is optimally suited to explore surface dynamics in live cells at a single molecule resolution. Indeed, it has found important applications in the study of membrane binding, diffusion, and fusion processes [105], endocytosis [106], signaling cascades [107], voltage-gated Ca2+ channels [108], and viral infection [109].
3.5.4 Fluorescence Correlation Spectroscopy (FCS)
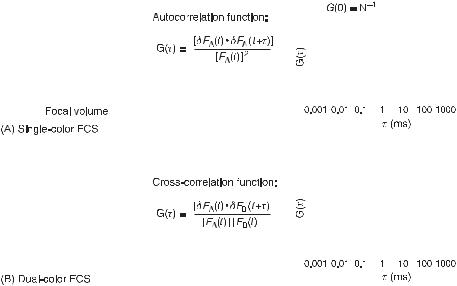
A complementary single molecule detection technique is FCS [110,111] (fig. 3.4). Here, confocal microscopy is used to record minute fluorescence fluctuations in a very small
Fig. 3.4 Scheme of fluorescence correlation spectroscopy (FCS). In single (A) and dual (B) color FCS, the fluorescence in the observation volume of one (X) or two (X, Y) distinct classes of fluorophores, respectively, is monitored over time. The correlation functions are then used for the temporal analysis of the signals to determine the characteristic residence times of the labeled probes and their diffusion or binding constants. The correlation plots depict ideal cases. G(0) is the correlation amplitude, which is inversely proportional to the average number of fluorescent labels simultaneously present in the observation volume (N ).
26 DETERMINATION OF COMPLEX REACTION MECHANISMS
(less than 1 femtoliter) and precisely localized observation volume, within compartments or at their boundary on membranes. Intensity fluctuations are caused (1) by changes in the number of fluorophores in the observation volume, induced by diffusive motion, or (2) by variations in the fluorescence emission during the residence of a fluorophore, as a consequence of molecular interactions, or variations in the excitation or in the microenvironment. For reliable analyses, the number of fluorescent molecules in the observation volume has to be kept small (less than 10), which means that fluorophore concentrations have to be in the nanomolar range. A temporal analysis of the fluorescence fluctuations from the average intensity is then performed using an autocorrelation function to estimate the transition time for events affecting the mobility of the labeled molecule such as association and dissociations reactions [112], or to characterize processes affecting the fluorescent emission such as proton transfers [113], conformational changes [114], or oxygen binding [115]. FCS offers subnanomolar sensitivity and dynamic ranges of time that span over 3–4 orders of magnitude [111].
There are, however, limits in the resolution of heterogeneous populations. In the particular case of multiple diffusing fluorescent species, for example in binding studies, the diffusion times must differ by a factor of 1.6–2.0 to be resolved, corresponding to a 4–8-fold increase in molecular weight. This limitation is alleviated in dual-color fluorescence cross-correlation spectroscopy (DC-FCCS) [116], in which the fluorescence fluctuation is simultaneously recorded in the same observation volume for two different species labeled with distinguishable fluorophores. The fraction of double-labeled and hence associated species is derived from the cross-correlation function between the two fluorescences (fig. 3.4B).
3.5.5 Fluorescence Resonance Energy Transfer (FRET)
This technique is used to sense the proximity of two fluorescently labeled molecules. The fluorophore couple is chosen to have a donor that in the excited state transfers its energy by dipole–dipole coupling to an acceptor, that is, the second fluorophore, which re-emits the light at a longer wavelength [117]. Among others, FRET pairs with appropriate spectral overlaps are BFP–GFP or CFP–YFP. Because the transfer efficiency correlates with the inverse sixth power of the distance between the fluorophores and depends on their spatial orientation, the experimental detection of FRET is possible only for pairs separated in space by 1–10 nm. If position and orientation of the fluorophore pair are favorable and FRET occurs, the fluorescent emission of the donor is quenched whereas the acceptor begins to fluoresce. The transfer efficiency can be derived by the ratio of the two emissions [118].
Alternative approaches to measure FRET involve photobleaching [119] or the donor’s fluorescence lifetime, which is shortened by FRET [120]. Particularly in steady-state FRET experiments, intensity-based FRET techniques are sensitive to cross-talk caused by the partial overlap of the fluorophores’excitation and emission spectra. To obtain exact FRET efficiencies, background fluorescence and FRET-independent variations have to be experimentally quantified for both fluorophores. Two labeling designs are basically available. First, the two fluorophores can be tagged to different molecules to detect their reciprocal binding [121]. Second, both fluorophores are fused to two independent domains of the same molecule, typically a protein, and FRET efficiency depends on conformational changes due to, for example, binding of a ligand. The latter, unimolecular