

40 DETERMINATION OF COMPLEX REACTION MECHANISMS
states. As the figure shows, this task is accomplished in time. The correct identification can be achieved for a given number of reactors only if the number of patterns (stable stationary states) given to the system is not too large (about 13% of the total number of reactors) and the number of errors is limited.
This experiment showed the possibility of implementing a parallel computing machine by macroscopic chemical kinetics. In a parallel machine all reactors (the analogs of electronic elements) interact at all times during the computation. In a sequential computer, such as a Turing machine, each element, such as a given logic gate, interacts with only a few other elements at any time, and does not act at all times.
In neural networks, implemented by electronic components, the connections are made by wires, and the connection strengths are determined by resistors. In a network implemented by macroscopic chemical kinetics the connections are made by mass transfer and the connection strengths are pumping rates.
4.3Computational Functions in Biochemical Reaction Systems
If chemical reaction mechanisms running far from equilibrium, such as bistable systems, can perform computational functions, then we may ask whether such computations occur in well-known biochemical reaction mechanisms, and if they do, what role and purpose they serve. Biochemical reaction networks (BRN), such as glycolysis and the tricarboxylic acid cycle, are an integral part of the machinery with which an organism maintains itself and adapts to its environment. These networks are responsible for numerous cellular tasks such as the maintenance of homoestasis and the creation and propagation of chemical signals of many types, such as indications of hunger or satiation.
It is often difficult to determine the basis of the logic of these regulation processes, even for small parts of a BRN. First, the subnetwork may be highly connected with feedback loops and branching pathways. Second, the many kinetic parameters of the BRN are difficult to measure and may be poorly, or not at all, known. Third, the great range of temporal and spatial scales over which a large BRN can react to the perturbations of its variables makes it difficult to deduce biological control and signal processing from models of the system. Hence we seek new methods for the study of the reaction mechanisms of these complex systems, and we proceed with the analysis of some examples of computational functions in BRNs.
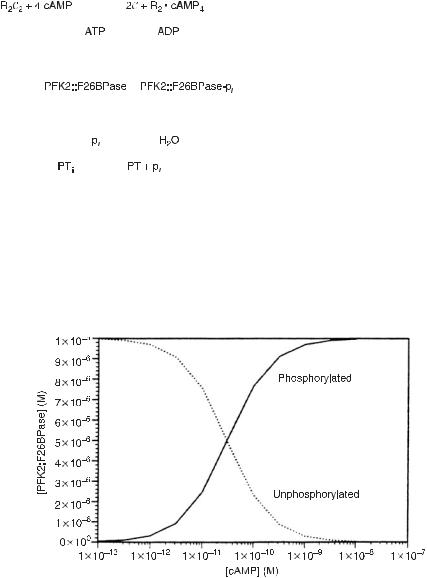
Consider the biochemical reaction mechanism shown in fig. 4.8, which occurs in glycolysis [7]; note the similarity in the structure of this mechanism to that of a model of a chemical neuron shown in fig. 4.1. Calculations of the stable stationary states of the biochemical system of fig. 4.8 are plotted in fig. 4.9. The change from high to low concentration of either compound is not as abrupt as that in fig. 4.2 for the chemical model, but is clearly present. We have identified a computational element, a “fuzzy” chemical neuron, in a biochemical reaction.
Logic gates can be constructed by a variety of chemical reaction mechanisms; for example, relatively simple enzymatic reactions can serve as logic gates [7]. Another important unit consists of cyclic enzymatic reactions, as shown in fig. 4.10. This system is present in glycolysis. We single it out since measurements on its stationary states away from equilibrium have been made and compared with calculations [9]. The experiments
COMPUTATIONS BY MEANS OF MACROSCOPIC CHEMICAL KINETICS |
41 |
Fig. 4.8 A diagram of the phosphorylation/ dephosphorylation cycle of the tandem enzyme PFK2::F26BPase. The lines ending in filled circles indicate that C and PT are catalysts for the phosphorylation and dephosphorylation reactions, respectively. This mechanism has a reaction topology very similar to the reaction mechanism in fig. 4.1. Here, R2C2 represents the tetrameric enzyme, cAMP-dependent protein kinase. R denotes the regulatory subunit and C denotes the catalytic subunit. PT denotes a generic phosphatase which is inhibited by the presence of an inorganic phosphate. The inactive phosphatase is denoted by PTi. The activity of the PFK2 moiety of the tandem enzyme is reduced by phosphorylation whereas that of the F26BPase is increased. This figure is similar to fig. 1 of [22]. (From [7].)
Fig. 4.9 Plot of the steady-state levels of phosphorylated and unphosphorylated PFK2::F26BPase (fig. 4.8) as a function of the concentration of the catalytic subunit of protein kinase C. The transition between low and high concentrations of phosphorylated protein is gradual, unlike the formal neuron shown in fig. 4.2. The kinetics for this system are taken from [22]. (From [7].)
42 DETERMINATION OF COMPLEX REACTION MECHANISMS
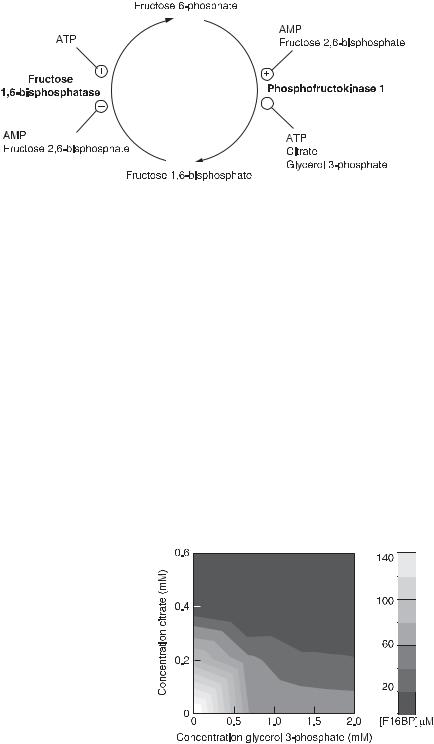
Fig. 4.10 Schematic diagram of the fructose 6-phosphate/fructose 1,6-bisphosphate cycle. Some effectors of the enzymes are noted by lines ending in circles; indicates activators and indicates inhibitors. Enzymes are noted in bold type. (From [9].)
were made in a CSTR: buffered F6P was flowed into the CSTR and the concentrations of AMP, citrate, F16BP, F26BP, and G3P were measured by means of capillary electrophoresis, at a given stationary state determined by the inflow. The concentrations of the enzymes were kept constant.
An example of these measurements is given in fig. 4.11, which shows the concentration of F16BP, the gray scale on the right and in the square, as a function of the concentration of citrate and G3P. This compares very well with a calculation for this system (fig. 4.12). Both the measurements and the calculation show the presence of a NOR gate. If the concentration of F16BP is small then the gate is off; this occurs for all concentrations of both citrate and G3P unless both of these are small, and then the gate is on and the concentration of F16BP is large. We can correlate the F16BP concentration with the output of this system to be glycolysis or gluconeogenesis. Glycolysis is the conversion of glucose to tricarbocyclic molecules and the production of the energetic
Fig. 4.11 Experimentally determined plot of the concentration of F16BP versus the concentrations of effectors citrate and G3P. Black is the lowest concentration of F16BP and white is the highest (see the shaded quantitative scale next to the plot). (From [9].)
COMPUTATIONS BY MEANS OF MACROSCOPIC CHEMICAL KINETICS |
43 |
||
|
|
|
|
|
|
|
|
|
|
|
|
|
|
|
|
|
|
|
|
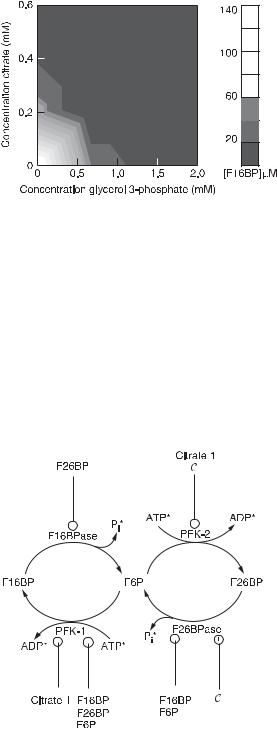
Fig. 4.12 Numerically determined plot of the concentration of F16BP versus the concentrations of effectors citrate and G3P. Black is the lowest concentration of F16BP and white is the highest. (From [9].)
species ATP from ADP and AMP. This occurs for high concentrations of F16BP. Gluconeogenesis is a reverse process of glycolysis and occurs for high concentrations of F6P, that is, low concentrations of F16BP.
If we think of a formal combination of two structures as shown in fig. 4.10 [7], we come to an important part of glycolysis, the hexose phophate system (fig. 4.13). The stationary states of this system (fig. 4.14) constitute a fuzzy aggregation function: an OR gate at low concentrations of citrate and cAMP, and an AND gate at high concentrations. This biological reaction mechanism is a control point in glycolysis/gluconeogenesis. The enzymes in this kinetic mechanism are under allosteric control of many of the
Fig. 4.13 Interconversion of fructose 6-phosphate with fructose 1,6-bisphos- phate and fructose 2,6-bisphosphate. Species marked by asterisks are considered to be held at constant concentration by buffering or flow. Positive (negative) effectors are connected to their enzymes by a line ending with a circle in which there is a plus (minus) sign. (From [7].)