

Understanding the Human Machine - A Primer for Bioengineering - Max E. Valentinuzzi
.pdf328 |
Understanding the Human Machine |
For the former, try to get a CMR better than 100 dB with amplifier's input impedance between 109 and 1010 Ω at 50–60 Hz. For the latter, try to keep the difference below 10 KΩ or, even better, below 5 KΩ. Yes, we know, it is not an easy task, but you belong to the younger generation full of motivation and pep!
5.5.2.2. Inductively Coupled Noise
We were so entangled with the previous analysis and, up to a point, happy with our results, that we forgot the magnetic field generated by the flowing electric currents. If the patient, cables and equipment are arranged in such a way that a closed loop is formed near the magnetic lines (Figure 5.12), a voltage will be induce in the loop, as described by,
Vn = 2 π f B Ak cosθ [V] |
(5.43) |
where
f is frequency, usually 50 or 60 Hz;
B stands for the root mean square value (RMS) of the flux density, in Gauss;
A represents the area of the loop, in cm2;
θ is the angle formed by the magnetic field and the plane of the loop; k = 10–8, constant to be consistent with the CGS system.
Suggestion: Go back to your physics notes and review Faraday's induction law, the associ-
Figure 5.12. MAGNETICALLY COUPLED NOISE. IA stands for instrumentation amplifier.
Chapter 5. Biological Amplifier |
329 |
ated units and how the cosine gets into the equation.
The equation teaches that a reduction in any of the factors brings about a decrease in the induced voltage. Hence, getting away from the magnetic generator (the power line), twisting the power cables to cause an alternation in the magnetic field direction, putting the signal cables very close together to reduce the loop area, searching for an optimal orientation to minimize the effect of the angle, are all on the spot measures to improve the signal to noise ratio.
5.5.3. Electrode Contact Potentials
Every time a metal is placed into contact with an electrolytic solution a redistribution of electric charges takes place. This forms the so-called Helmholtz double layer. We refer to Chapter 4 for a more detailed discussion of the subject. This phenomenon happens even when the electrodes are placed on the skin, either with paste or without it, for the skin always has a fine film of salty water (our perspiration). Movement of the electrodes, pressure applied to them (even lightly), modifies such distribution and along with it the contact potential which is cleanly detected by the amplifier producing large shifts in the recorded signal.
5.5.4. Biopotential Interferences
Other normal electrical signals from the same patient or animal can act as a disturbance blurring or even hiding the desired bioevent. Sometimes, it is easy to determine where the interference comes from; sometimes, it may not. Typical examples are,
Muscle activity (electromyogram or EMG) in the electrocardiogram (ECG);
EMG in brain electrical activity (electroencephalogram or EEG); Maternal ECG in fetal ECG;
Respiratory movements in ECG
Respiratory movements in thoracic impedance records (impedance cardiogram or ICG).
Suggestión: Find other examples. Remember the different physiological systems and their many signals. Take a look at a physiology textbook or go back above.
The first two situations, extremely common, may be confused with interference from other external sources (such as RF interference) because of
330 |
Understanding the Human Machine |
the high frequency of the EMG. It is advisable to ask the patient to relax and keep quiet. In an experimental animal it is more difficult and, occasionally, a mild muscle relaxant is injected. The situation becomes more difficult in patients showing intrinsic tremors (as with some cases of Parkinson disease). Thus, adequate filtering is required favored by the fortunate higher frequency of these disturbances with respect to the ECG and EEG.
The third case has produced innumerable papers for the fetal cardiac signal supplies an essential piece of information to the obstetrician. One disadvantage is the large amplitude of the mother's ECG as compared to the fetus' ECG. Conversely, one advantage is the lower frequency of the mother's ECG in relation to the fetus' (roughly, 1:2). Hence, good filtering (usually digital) combined with averaging techniques can successfully unbury the fetal signal from its mom’s.
In the fourth example, respiratory movements cause a shift in the electrode position (contact potential change) and modulation of the thoracic basal impedance in ICG records. All this takes place at respiration rate (about 10–15 breaths/min), which is rather slow and, thus, easy to remove by filtering it out.
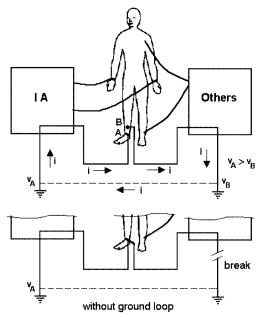
5.5.5. Ground Loops
The situation depicted in Figure 5.13 gives rise to a ground loop manifested by the appearance of a difference of potential (VA – VB), that is, between the ground connection, say, of an instrumentation amplifier and the ground connection of another medical machine, both monitoring the same patient. Obviously, both ground potentials are not the same, and the resulting current produces a common mode voltage drop at the amplifier’s input to be reflected at its output, as previously shown above. If you are lucky, VA may be equal to VB, and your problem automatically vanishes. However, frequently the situation is not so favorable and the only way to remove this kind of interference is by connecting both pieces of equipment to the same ground point (the sometimes so-called starconnection). Besides, one single reference electrode must be used on the patient (Webster, 1992; Tomi Engdahl, 1997–2000, Ground loop problems and how to get rid of them, in www.epanorama.net/documents/groundloop/index.html;
Chapter 5. Biological Amplifier |
331 |
Figure 5.13. GROUND LOOPS
another interesting piece is to be found in http://www.deerfieldlab.com/ana.html).
5.5.6. Other Types of Noise
Still, there are other forms of interference, although their incidence is by and large quantitatively less important or significant. However, they deserve brief description at least (Togawa, Tamura, Öberg et al., 1997).
Static electricity due to frictional movements (against blankets, sheets, pillows), either of the patient, medical personnel or other people around, which may be named triboelectricity (tribo, friction), is able to sustain currents through the patient and any electrode on him/her. If the electrode impedance is high, the voltage drop through them can become an input signal to the IA, as explained before.
Kinetic energy imparted to electrons by temperature produces an internal type of ohmic noise (Pallàs–Areny & Webster, 1999) usually referred to as thermic or Johnson noise (perhaps, it should be better named Schot- tky–Johnson noise; see historical note below) mostly manifested at the
332 |
Understanding the Human Machine |
amplifier input stage. Its root mean square (rms) voltage value is expressed as,
en = (4kTBR)1/ 2 |
(5.44) |
where k = 1.38×10⁻²³ joules/kcal is Boltzmann constant, T in Kelvin degrees represents the absolute temperature of the resistance involved, B in Hz stands for the bandwidth of the system, and R is the resistance value in ohms. Its spectral distribution is uniform and very wide for which reason sometimes is called white noise; besides, it does not depend on the manufacture technology.
Another internal noise is the shot (or Schottky) noise, associated to the carriers flow through a semiconductor junction. Its rms value is given by,
in = (2qIB)1/ 2 |
(5.45) |
where q stands for the electron charge, I is the current through in amps, and B represents the bandwidth in Hz. Similar to the previous one, it is a typical white noise, too. The term shot is derived from the fact that the noise sounds like a handful of B–B shot thrown against a metal surface.
Contact or flicker noise is caused by conductivity fluctuations due to imperfect contact between two different materials (interface effects). It is proportional to the current through, characterized by low frequency components and shows up in any device where such discontinuities are present, as relays, metal/insulators or gates of FET transistors. Flicker noise is proportional to 1/f, where f is the frequency.
Finally, the popcorn-like noise originates in manufacturing defects, mostly metallic impurities in semiconductor junctions. Since current flow at the quantum level is not smooth and predictable, an intermittent burst phenomenon sometimes occurs. This noise, called popcorn noise, consists of pulses of many milliseconds' duration (check in the WEB SITE, Joseph J. Carr and John M. Brown, Introduction to Biomedical Equipment Technology, Prentice Hall PTR).
The student is invited to check and work out the units associated with the formulas above, (5.43) and (5.44). Full details of this rather difficult subject are usually developed in specific electronic courses.
Historical note: In the early years of electronic circuitry, engineers and physicists were trying to solve problems involved in making better vacuum valves. Although many of the problems were related to design and manufacturing techniques, the fundamental problem of noise
Chapter 5. Biological Amplifier |
333 |
was gaining recognition. J.B. Johnson and Harry Nyquist, who worked at Bell laboratories in the United States, would provide some of the answers in the 1920's (Johnson, J.B. “Electronic noise, the first two decades,” IEEE Spectrum, February, 1971). However, Walter Schottky (1886–1976), in Germany, had made before important contributions in a classic paper on noise in valve amplifiers, which was published in 1918. He had reached the conclusion that there would be two sources of noise of a fundamental nature in an amplifier. The first would occur in the input circuit and would result from the random motion of charge caused by the thermal motion of the molecules in the conductors, or what is now known as thermal noise. Since the noise is originated in the input circuit and would appear amplified in the output circuit, he deduced that it would be proportional to Boltzmann constant multiplied by the absolute temperature. In the mid–1920's, Johnson experimentally identified thermal noise and Nyquist analyzed the discovery mathematically, producing a formula of 4kT watts per unit of bandwidth, confirming Schottky's deduction. Schottky's second fundamental source of noise would be caused by the randomness of the emission from the cathode and the randomness of the velocity of the emitted electrons, which is now know as shot noise. This noise was first experimentally identified and measured in Schottky's laboratory. Later studies showed it was linked to factors such as the material and design of the cathode and extended to semiconductor junctions.
5.5.7. Characterization of an Amplifier’s Noise
There are two common ways to quantifying noise of a given amplifier: by the equivalent rms voltage value at the output when the input is short circuited and by the equivalent rms current value also at the output, when the input is open.
The first one is expressed in nV/Hz½ for a given frequency. Due to the 1/f-type of noise (flicker), its value increases at low frequencies. The point where the low frequency noise equals the thermic noise is called frequency cross point; it defines the frequency below which noise becomes frequency-dependent. If the technology of the IA belongs to the bipolar transistor kind, total noise originates essentially as thermic noise of the base resistance and as shot noise of the collector current. When the technology includes FET’s, noise is dominated by the Johnson type at the channel resistance and is usually higher than in the bipolar case; its cross point frequency is also larger.
The second form is a measure of noise due to currents and is expressed in pA/Hz½. In bipolar transistors, the source is shot effect of the base current and also to flicker. Amplifiers with a FET input stage show lower noise currents.

334 |
Understanding the Human Machine |
Figure 5.14. ISOLATION AMPLIFIER
A third way to quantifying noise is the total equivalent voltage, Vnt, which combines all noise types,
Vnt = [4kTBRs +Vn2 +(In Rs )2 ]1/ 2 |
(5.46) |
The student will easily recognize three components: thermic noise, voltage noise and current noise. Total noise measurement and/or evaluation is a subject of great interest and amply described in the virtual literature. The student should search on his/her own.
5.5.8. Isolation Amplifier
This kind of amplifier offers ohmic isolation between its input terminals and its output. Parasitic currents and leaks must be very low and the dielectric breakdown voltage VISO (Figure 5.14) has to be as high as possible. In other words, it must show high input resistance, say, about 10 TΩ, and low input capacitance, say, <10 pF (Sheingold, 1980; Pallàs–Areny & Webster, 1999).
The biological isolation amplifier has as main objective protection of the patient by removing all possible electric shock risks that could result from the interaction between the patient, the amplifier and other equipment, specifically defibrillators and electrosurgery machines. Besides, such isolation often prevents interference from the main.
Isolation acts as a barrier between the patient and any technological piece connected to him/her. It can be achieved using either a transformer, a capacitor or an optical system. Ideally, in an isolated system (Figure 5.14) there is no current flowing through the barrier. This is described by
Chapter 5. Biological Amplifier |
335 |
a parameter called the isolation voltage VISO, between the input reference point and the output reference. Commercial pieces specify a continuous voltage, say 2000 V, actually meaning that the device was tested at least at twice such rated value, or 4000 V.
Since the isolation amp is a safety device, the professional biomedical engineer and any industry manufacturing it must comply in this respect with standards and regulations periodically updated by the American Association for Medical Instrumentation (AAMI).
5.6. Conclusions
We have introduced the student to the basics of the biological amplifier describing its main characteristics and its possible implementation either with one, two or three operational amplifiers. Thereafter, the usual specifications found in the data sheets were explained to proceed thereon with the delicate and always present problem of noise and interference. Practice and study are mandatory to fully master the subject and, for that matter no doubt, the student will be required to take at least a specific bioinstrumentation course. This chapter will serve, we think, as an adequate launching platform and we sincerely hope that, after “enjoying” it, you did not end up as sick as the the poor girl below.
Myriam C. Herrera was born in Tucumán, Argentina, in 1959. She received the Electronics Engineering degree and PhD in Bioengineering from the University of Tucumán (UNT)1, in 1984 and 1996, respectively. Currently, she is Associate Professor at the Department of Bioengineering (DBI), Director of the Biomedical Engineering Undergraduate Program of the Facultad de Ciencias Exactas y Tecnología, UNT, and Principal Professional Research Assistant at INSIBIO2 supported by CONICET3. From 1981 on, she was active at different academic levels. Besides, she is member of the Argentine Society of Bioengineering and President of the Bioengineering Committee of the Argentine Cardiology Federation. In
336 |
Understanding the Human Machine |
1999, she was awarded a special mention of the prize “New Engineers: Medical Engineering” by the Scientific and Technological Promotion Agency, Argentina. She has published several research papers, presented communications in conferences and has spent short training periods in the USA, Bolivia, Colombia and Perú. Her interest lies mainly in bioimpedance, new medical technologies in the areas of cardiac and vascular mechanics and education, too. 1UNT: Universidad Nacional de Tucumán; 2INSIBIO: Instituto Superior de Investigaciones Biológicas; 3CONICET: National Research Council of Argentina.
Chapter 6
The Interpreter: Reading the Signals
“We look at physiological signals, watch them carefully, and many times they even show a nice appearance; the main problem, however, lies on how we read and understand the message carried by them.”
by Max E. Valentinuzzi and Ron S. Leder
6.1. Introduction
The first step of the interpreter in understanding the physiological significance of a signal is observation. The five human physiological senses (vision, audition, touch, smell and taste), probably in this order of importance, are still the human information input channels. Training, education and experience provide the tools with which to observe, analyze and interpret biological signals. It took time and effort to learn the physiological significance of the P, QRS and T components of the normal electrocardiogram or the significance of the dicrotic notch in the arterial blood pressure tracing. Modern signal processing and signal analysis are powerful computational tools to aid in the task of signal interpretation; they can single out small dents, incisures or notches that, otherwise, would pass unnoticed but which are important because they may have significant clinical meaning. Nonetheless, interpretation should not be confused with signal processing and analysis. The latter are techniques that subject the signal to a number of numerical operations (processing) in order to break it down into components of different type and kind (analysis), often following unique shapes and distributions (patterns) so helping in the identification of pathologies or conditions. No new information is produced, for information is usually well hidden in the signal and the task is to uncover it. Interpretation, instead, requires the human intellect, to correlate those components and/or patterns or both with a particu-
337