

Understanding the Human Machine - A Primer for Bioengineering - Max E. Valentinuzzi
.pdf248 |
Understanding the Human Machine |
2.Muscular contraction through the actine-myosin sliding mechanism and the friction associated with it. Sometimes this is termed muscular noise. Skeletal muscle also generates it.
3.Turbulences generated when the movement of blood passes from the laminar to the non-laminar regime, that is, when blood velocity is greater than certain limit value usually related to Reynolds number.
4.Friction in the blood bulk and against the arterial and intracardiac walls.
5.Cavitations produced by collapsing bubbles due to vortices or turbulences. This is a well-known phenomenon that occurs in any system of rapidly moving fluid. It is found everywhere from hydraulic turbines to boat propellers and human joint articulations. Pockets of air or gas or even vacuum form and then disappear with a potentially loud sound.
6.Narrowings of different kind that produce the Venturi effect (an acceleration).
The student is invited to dig a little deeper into the concepts of actine and myosine, two extremely important muscular proteins; also to review laminar and turbulent flow and the meaning of Reynold’s number. Any physiology textbook will serve for the former and physics textbook for the latter. What cavitations are is more elusive and a visit to the WEB is recommended. The phenomenon may take place during deep-sea diving and is associated with the so-called caisson disease or decompression sickness (when the diver returns to sea level too quickly). Another physics subject to review is the Venturi effect.
In fact, heart sounds and noises consist of a complex set of acoustical signals mostly and commonly detected either with the naked ear or, much better, by means of the traditional stethoscope. Clinicians are specifically trained to interpret and to differentiate them from the normal expected pattern. Graphic registration of these acoustical signals, either on paper or on a monitor screen, constitutes the phonocardiogram (PCG).
Four transient heart sounds, associated with the above-mentioned basic physical phenomena, occur during the normal cardiac cycle. The two sounds which mark the beginning and end of systole, and which are heard in all normal subjects or mammalian animals, are the first and second heart sounds. In many subjects, the third heart sound will be heard shortly after the second. In most, the fourth heart sound will be heard immediately before the first heart sound. However, all listeners do not necessarily hear the third and the fourth sounds always.
Chapter 3. Signals: What They Are |
249 |
Because the transient heart sounds correlate to the electrical and mechanical events of the cycle, they provide information on their timing and on the presence or absence of some of the events. Usually the mechanical events on the left and right sides of the heart occur almost simultaneously. Often, the interval is so short that it could only be detected using phonocardiography; however, there are circumstances under which the interval is long enough for it to be detected on auscultation. Even so, it requires good training. If the interval between the events on the left and right sides is sufficient (>30 ms), the sound can be split into two elements.
The intensity of the transient sounds varies in different subjects. For example, they are best heard in fit thin persons, but may be very quiet in fat, barrel-chested individuals. They are louder in an excited subject or during tachycardia. Sounds may be muffled by fluid in the thoracic or
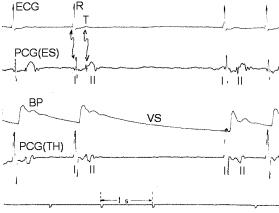
Figure 3.16. PHONOCARDIOGRAMS. These records were obtained from an experimental dog. Channel 1 displays the ECG (II) while channel 2 is the PCG detected with an esophageal probe carrying a small microphone on its tip. The third channel is the carotid blood pressure obtained by means of an external transducer connected to the tubing in turn inserted into the artery. The last channel is also the PCG but this time picked up by a thoracic microphone. The lower time marks, as indicated, give the 1 s calibration. One of the vagus nerves was stimulated triggering a well depicted slowing of the heart VS with a typical diastolic run off. The first sound I (or S1) correlates with the R-wave while the second sound II (or S2) correlates with the T-wave and the dicrotic notch. Records obtained by the author at the Department Bioengineering, UNT, 1978.
250 |
Understanding the Human Machine |
pericardial cavities. Solid tissue, such as tumors or abscesses, which displace the heart or are present between the heart and the chest wall, may result in the sounds being reduced or increased in intensity, depending on the position of the heart valves in relation to the body surface.
Auscultation is that part of the physical examination involving the act of listening with a stethoscope to sounds made by the heart, lungs, and blood. It may be complemented by the phonocardiogram.
It was William Harvey (1578–1657) who, over 400 years ago, referred indirectly to the valve noise in any hydraulic system when he wrote ... “as by the clacks of a water-bellows used to rayse water”. Obviously, he had noticed the phenomenon and was making a descriptive analogy (McGrady, Hoff and Geddes, 1966). But a systematic study of the thoracic sounds and noises is due to René Théophile Hyacinthe Laennec (1781–1826), the French physician who, in 1816, introduced the stethoscope and the method of auscultation producing, thereafter, a famous book entitled De l’Auscultation Médiate, in 1819 (Kliegfield, 1981). James Hope provided a definite demonstration of the valvular origin of cardiac sounds, between 1828 and 1841, after a masterful series of experiments in horses. He hindered the valve’s action with a catheter and the sound disappeared (McGrady, Hoff and Geddes, 1966).
Figure 3.16 displays two phonocardiographic channels showing the approximate correlation in time between the first sound S1 with the electrocardiographic R-wave. S1 is mainly produced by the closure of the two atrioventricular valves (left and right heart). There is also a minor contribution from the opening of the arterial valves, which, shortly after, start both ventricular ejections. The second sound S2 recognizes its origin mainly in the closure of the two arterial valves (aortic and pulmonic valves). It is associated with the electrocardiographic T-wave and, as expected, with the dicrotic notch, too. Opening of the two atrioventricular valves slightly after probably add some components to the sound. Thus, the time interval between the first and the second heart sounds is a rough measure of the ejection period. The long diastolic run off due to the vagal slowing of the heart shows that the signals of the PCG channels are not artifacts. These two sounds easily heard in everyone have been phonetically described as lub-dub. Figure 3.17 offers another view of the PCG, as intravascular sounds detected with microtransducers implanted at the tip of a catheter within the aorta.
Chapter 3. Signals: What They Are |
251 |
Figure 3.17. FIRST AND SECOND HEART SOUNDS. They were recorded with microtransducers installed at the tip of a catheter inserted via the femoral artery into the ascending aorta. The first sound is the double spike coincident with the diastolic pressure and the second sound corresponds to the other double spike coincident with the dicrotic notch. The distance between each pair is a measure of the ejection duration. These microtransducers are currently being manufactured by Millar Instruments, in Houston, TX. Figure after a brochure of this factory, 1972, by permission, with the author’s acknowledgment for the courtesy.
Heart sounds should be distinguished from murmurs. The latter, sometimes called pronoises, are heard during a normally silent period of the cardiac cycle and mostly relate to pathological conditions. A murmur is like a prolonged “whoosh”. It could be due to a narrowing of the aortic or pulmonary valve or to a leak through the mitral or tricuspid valves (both due to acquired or congenital causes), during systole of the ventricles. Figure 3.18 well exemplifies a systolic murmur due to aortic stenosis. But heart murmurs may also be heard when there is signicant narrowing of the mitral or tricuspid valve during diastole (that is during relaxation, when the blood is flowing from the left or right atrium into the re-
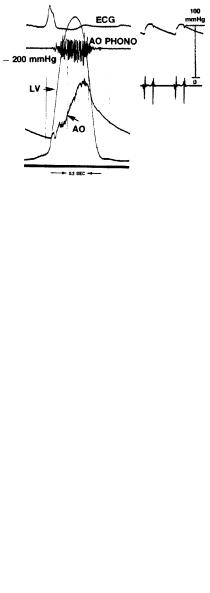
Figure 3.18. SYSTOLIC MURMUR. ECG, PCG, left intraventricular pressure LV and aortic pressure AO recorded with microtip transducers. Narrowing of the aortic valve (stenosis) produces a prolonged murmur, which extends all over systole. The deficient valvular closure affects the rising aortic pressure phase, as clearly manifested in the record. Figure after a brochure of Millar Instrument, Houston, TX, 1972, by permission, with the author’s acknowledgment for the courtesy.
252 |
Understanding the Human Machine |
spective ventricle) due to acquired (say, rheumatic fever) or congenital causes. Similarly, diastolic murmurs may be heard when the aortic or pulmonary valve leaflets do not adequately oppose each other.
The first heart sound (S1) as recorded by a high-resolution phonocardiography consist of 4 sequential components: (1) small low frequency vibrations, usually inaudible, that coincide with the beginning of left ventricular contraction and felt to be muscular in origin; (2) a large highfrequency vibration, easily audible related to mitral valve closure (M1);
(3) followed closely by a second high frequency component related to tricuspid valve closure T1; (4) small frequency vibrations that coincide with the acceleration of blood into the great vessel. The two major components audible at the bedside are the louder M1 best heard at the apex followed by T1 heard best at the left lower sternal border. They are separated by only 20–30ms.
The second heart sound S2 has two components: A2 and P2, coincident with the incisuras of the aorta and pulmonary artery pressure traces, respectively, and terminating the right and left ventricular ejection periods. Right ventricular ejection begins prior to left ventricular ejection, has a longer duration, and terminates after left ventricular ejection, resulting in P2 normally occurring after the A2. Right and left systole are nearly equal in duration, and the pulmonary artery incisura is delayed relative to the aortic incisura, primarily due to a larger interval separating the pulmonary artery incisura from the right ventricular pressure, compared with the same left-sided event. This interval has been called the “hangout interval”. Its duration is felt to be a reflection of the impedance of the vascular bed into which the blood is being received. Normally, it is less than 15ms in the systemic circulation and only slightly prolongs the left ventricular ejection time. In the low resistance, highcapacitance pulmonary bed, however, this interval is normally much greater than on the left, varying between 43 and 86ms, and therefore contributes significantly to the duration of right ventricular ejection.
The third heart sound S3 is due to ventricular turbulences generated during the period of rapid ventricular filling, difficult to be heard and not easily recorded; however, in children and adolescents, chances for its detection are better, probably because of the contractions vigor. Obviously, it is an early diastolic event with low frequency content. It occurs
Chapter 3. Signals: What They Are |
253 |
about 0.14–0.16 seconds after the second sound. The S3 reflects decreased ventricular compliance or increased ventricular diastolic volume. The abnormal S3 is heard in individuals with coronary artery disease, cardiomyopathies or incompetent valves.
The fourth heart S4 sound is attributed to atrial contraction. It is a low frequency sound heard just before the first heart sound, occurring during the late diastolic phase. It is seldom heard in normal hearts. Under certain pathological conditions, however, it may show up, as for example when the ventricles have a decreased compliance or are receiving an increased diastolic volume, also in myocarditis or atrioventricular block. It is usually accentuated with inspiration and may be due to pulmonary valve obstruction, pulmonary stenosis, pulmonary hypertension, or right ventricular myocardial infarction.
Phonocardiography constitutes a subspecialty within the broader field of cardiology. The student is invited to visit the WEB in order to search for more information, be it pathophysiological, clinical or technological.
3.3. Signals Produced by Biomechanical Systems
Diseases, natural catastrophes, wars, human aggressions, and mainly traffic accidents, are producing a growing number of physically maimed young people. Biomechanics, at the base of rehabilitation engineering, can supply devices to help them out along with considerable background knowledge.
Any moving organ or tissue has a biomechanics associated with it: the skeletal voluntary muscles, the involuntary rhythmically contracting myocardium, all smooth muscles (involuntary too) covering blood vessels, urinary canals, gastrointestinal system, reproductive organs at large, and the articulated skeleton in its manifold complex arrangement. In all of them, somehow, force, length and angular changes are manifested as basic events while slightly more complex ones as tension, acceleration and torques also take place. Production of work is a salient characteristic of mechanical systems. We will briefly review in this section the most
254 |
Understanding the Human Machine |
important signals that can be recorded either in the laboratory environment or within the clinical setting.
The electrical signals of skeletal, cardiac and smooth muscles trigger their respective contractions and, thus, they develop force F (measured, say, in dynes, newtons or kilograms-force, the latter unit to be distinguished from kilogram-mass) usually accompanied by a change in muscular length L. The time derivatives of F and L are often used as estimators of contractility; they quantify velocity of contraction (in dynes/s or in cm/s, respectively). In experimental physiology, the myogram and the cardiomyogram are routinely recorded.
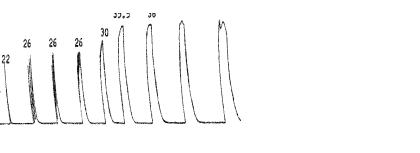
Figure 3.19 shows records obtained from a frog gastronecmius muscle increasing the stimulus frequency. It starts with a twitch on the far left fusing to a sustained pull at 50 pulses per second on the far right. Although the stimulus intensity was not altered, greater tension was produced with repetitive stimuli. This is a characteristic property of skeletal muscle and is referred to as the twitch/tetanus ratio. In this case, the tetanic stimulation developed 1.7 times that developed when single stimuli were given; thus, the efficiency of the tetanic contraction is better than that of a twitch. It is a good example of biomechanics because it shows a combination of a physiological property with the actual production of force and work.
Figure 3.20 shows a set of experimental records obtained from a terrapin (the Argentine Geochelonia chilensis, mostly found in the NW region of
Figure 3.19. SKELETAL MUSCLE CONTRACTION. Lef: Sequence from twitch to full tetanic contraction. Numbers on top indicate the force developed (from 22 to 38 grams). Right: The graph relates tetanic/twitch ratio to stimulus frequency. Record obtained in the Department of Physiology, Baylor College of Medicine, in 1966, when Dr. Hebbel E. Hoff was its Chairman.
Chapter 3. Signals: What They Are |
255 |
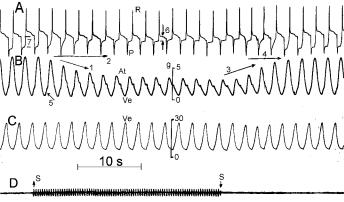
Figure 3.20. CARDIOGRAMS FROM A TERRAPIN (Geochelonia chilensis). Channels from top to bottom are: atrio-ventricular direct electrogram, atrial myogram, ventricular myogram and finally below the interval of right vagal simulation. The two calibration bars, 5 and 30 grams-force, quantify force of contraction, respectively, for the atrium and for the ventricle. Records obtained by the author at the Department of Bioengineering, UNT, 1972.
this country). After demedulation (pithing), the plastron was carefully cut open with a circular saw and the pericardium gently dissected through to expose the heart. An atrio-ventricular electrographic lead was recorded from one hook-electrode inserted in the right atrial appendage and another similar electrode inserted into the ventricular apex. This is the record shown by the first channel A. In it, the two main electrical cardiac components are seen: a monophasic-inverted atrial P-wave —with a depression marked as 7— and the ventricular R-wave with an elevation marked as 6. The depression and the elevation indicate damage to both, the atrium and the ventricle, probably due to the small wound produced by the hooks. These two hook-electrodes were also attached to two myographs, respectively, via a non-extensible string to simultaneously record the mechanical atrial and ventricular cardiograms (channels B and C). There are two vertical bars that show both calibrations in gramsforce. Obviously, the ventricular pull was much stronger than the atrial one.
Cardiac frequency can easily be calculated as about 57 beats/s, a typical value for this kind of animal during the springtime season in a subtropi-
256 |
Understanding the Human Machine |
cal region as the province of Tucuman is in Argentina. The right vagus nerve was mildly stimulated (SS interval in channel D) to elicit the classical and clearly distinguished vagal cardiac effects: The negative bathmotropic effec, or decrease of the duration of the atrial monophasic wave (follow arrow 2) and the negative inotropic effect or decrease of the force of atrial contraction (follow arrow 1). Please notice that the atrial myogram has two waves: one, At, upward, is the true atrial contraction that follows the electrical P-wave; the other is interference from the ventricle, the downwards Ve-wave because since both chambers are anatomically coupled, the ventricle pulls the atrium down when it contracts. The Vewave clearly follows the electrical R-component. On the right hand side of the figure, arrows 3 and 4 signal the recovery of both effects after vagal stimulation was off. Thus, these records represent a good example of physiological cardiac biomechanics (see Chapter 2, Section 2).
Surface tension, defined as F/L, where the force F is applied perpendicularly to a unit length over the surface of a tissue, can be studied over the epicardial surface with a multichannel arrangement of small strain gauges (see also Chapter 2, Section 2). Strain is another important geometrical parameter defined as relative change in length, say, during contraction (see Chapter 2, Laplace’s Law). Usually, such experimental results of complex design supply background material for the development of models. For example, M.P. Nash and P.J. Hunter, from the University of Auckland, New Zealand (check the internet site for more details) studied heart mechanics through mathematical modeling based on in vitro biaxial tests and observations of cardiac microstructure to describe the stressstrain properties of myocardial tissue. They presented stress and strain distributions for the passive heart.
The group of Tatsushi Tokuyasu, Shin’ichiro Oota, Ken’ichi Asami, Tadashi Kitamura, Gen’ichi Sakaguchi, Tadaaki Koyama, and Masashi Komeda (Kyushu Institute of Technology, Dept. of Mechanical Systems Eng., 680–4 Kawazu, Iizuka, Fukuoka 820–8502, Japan, http://www.imcs.mse.kyutech.ac.jp) developed a most interesting and fascinating training system for cardiac muscle palpation. Touching the cardiac muscle is necessary to assess the mechanical conditions of muscle before cardiac surgery. Cardiac palpation is the only way to make surgical plans for left ventricular plastic surgery. The training system for cardiac palpa-
Chapter 3. Signals: What They Are |
257 |
tion these authors have developed consists of a Magnetic Resonance Imaging (MRI)-based virtual left ventricular image and a one-dimensional manipulator as a haptic device. Mechanical properties of the cardiac muscles of a dog and a pig are embedded in the virtual heart. Experiments showed that the developed training system enables users to feel the reactional force to the virtual heart surface from the manipulator in real time. Obviously, epicardial and wall stress constitute biomechanical input signals to the detecting system.
Haptics (from Greek, haptesthai, to touch, refers to something relating to or based on the sense of touch) is the study of how to couple the human sense of touch with a computergenerated world. One problem with current virtual reality systems is the lack of stimulus for the sense of touch. For example, if a user tries to grab a virtual cup there is not a non-visual way to let the user know that the cup is in contact with the user's virtual hand. Also, there is not a mechanism to keep the virtual hand from passing through the cup. Haptic research attempts to solve these problems and can be subdivided into two sub-fields, force (kinesthetic) feedback and tactile feedback. The student is encouraged to search for more information on this attractive and relatively new field.
1
Another type of useful signal is the combination of, say, force with its time derivative or length or pressure also with their respective time derivatives. These are sometimes called phase diagrams (Eucker, Lisauskas, Singh et al., 1999). They may supply complementary information to evaluating a given biomechanical system. However, their interpretation is not straightforward and, so far, they have limited use. Besides, the term “phase diagrams” is also used in physical chemistry and in chaos theory tending to be confusing or misleading if not precisely identified.
The pressure exerted in a joint, as for example the knee or a vertebral disk, is well documented (Goel & Weinstein, 1990). Sometimes, the values may reach the breaking point of the materials involved. Wilke, Neef, Caimi et al. (1999), in Germany, for example, conducted intradiscal pressure measurements with one volunteer performing various activities normally found in daily life, sports, and spinal therapy. The goal was to measure that pressure because loading of the spine still is not well understood. The most important in vivo data are from pioneering intradiscal pressure measurements recorded by Nachemson during the 1960’s. Since that time, there have been few data to corroborate or dispute those find-