

Understanding the Human Machine - A Primer for Bioengineering - Max E. Valentinuzzi
.pdf238 |
Understanding the Human Machine |
The magnetomyogram (MMG) is defined as the recording of one component of the magnetic field vector as a function of time due to currents generated by skeletal muscle. Slowly changing or even dc components are recordable by this technique; besides, since no electrodes are needed, contact potentials and interface problems are totally non-existent. Figure 3.9 displays an example. Two MMG’s are shown recorded from the elbow and the palm of the hand (Cohen & Givler, 1972).
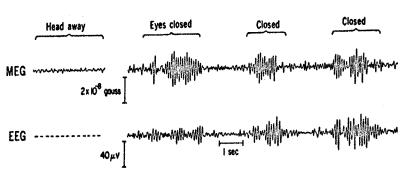
The magnetoencephalogram (MEG) represents the third signal associated to physiological electrical temporal changes, this time from the cerebral neurons. There is abundant bibliography reporting it. Cohen (1972), one of the pioneers in the field, reported the records shown in Figure 3.10, where the traditional effect of closing the eyes is clearly seen. There are possible situations in which the measurement of the brain’s magnetic field can reveal information that is either unavailable or very difficult to obtain with the EEG, i.e., dc components and existence of closed loop currents that do not produce differences of potential on the scalp. In both cases, there are magnetic fields.
3.2.4. Bioimpedancimetric Signals
Impedance, in simple words, is a quantitative measure of the hindrance offered by a given system when an applied force-like quantity tries to cause or maintain the passage of a fluid-like quantity through the system. By and large, impedance is a complex relation of the first quantity (as
Figure 3.9. MAGNETOMYOGRAM. Records obtained from the elbow and palm of the hand regions showing clearly voluntary contraction and relaxation of the muscles involved in the movements. Observe the smallness of its amplitude. By permission, after Cohen and Givler, 1972.
Chapter 3. Signals: What They Are |
239 |
Figure 3.10. MAGNETOENCEPHALOGRAM. The upper channel shows the MEG and the lower one the EEG. Both display the alpha rhythm from the brain of a normal subject. The magnetometer was located at the left occipital region, as were the bipolar set of EEG leads. With the eyes closed, as expected, both signals are greatly enhanced. With permission, modified after Cohen (1972).
mechanical force, hydraulic pressure, electric voltage, magnetomotive force or temperature gradient) to the second one (as velocity, volume flux, electric current, magnetic flux or heat). Possible units in each case are (dynes×s/cm), (dynes×s/cm5), (volts×s/coulombs = ohms), (amp/volts×s), (°C×s/cal), with the proviso that the second, third and fourth cases correspond, respectively, to Poiseuille’s, Ohm’s and Hopkinson’s laws (Morucci, Valentinuzzi, Rigaud et al., 1996).
The impedance concept finds applications in physiology and medicine, as for example, as described above in Chapter 2 in the cardiovascular system (impediment to the blood flow in any vessel, especially in the aorta), or in the respiratory system (impediment to the air flow through the airways), or in otolaryngology, where the acoustic impedance is one of the parameters frequently used to evaluate ear function). Probably, other examples could be found, say, in the gastrointestinal tract or in the reproductive system. However, in this section, we deal exclusively with electrical impedance, as defined by the generalized Ohm’s law. Its inverse, admittance, can also be used.
3.2.4.1. Mechanisms to change impedance
A physiological variable induces modifications in the electrical impedance offered by a biological system between any two points. Moreover,
240 |
Understanding the Human Machine |
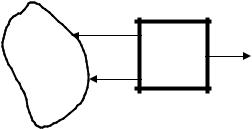
an impedance meter could be connected to such points yielding, at its output, a signal proportional to the physiological variable, but in terms of impedance, either modulus or phase or both. In other words, the impedance meter plays the role of a transducer in the sense that it transforms one kind of change into another kind (Figure 3.11). This signal is obviously of electrical nature, for either a voltage or a current usually manifests it.
To understand the mechanisms by which a physiological variable can produce modifications in the biological impedance opposing the passage of an electric current, two very simple and common electrical engineering models will be considered: the cylindrical resistor and the capacitor of parallel plates.
In the first case, the resistance between the two ends of a cylinder of length L and cross-sectional area A is given by
R = ρ |
L |
(3.1) |
|
A |
|||
|
|
where ρ, in (ohms×cm), represents the resistivity of the material the cylinder is made of. Its inverse, 1/ρ, is the conductivity σ. For example, the resistivity of human blood and plasma is, respectively, about 135 and 55 ohms×cm. Values for other tissues have been reported in the literature (Geddes & Baker, 1967). The constancy of this parameter and its numerical determination for biological materials is still a valid subject of
A |
I |
|
|
←ZAB |
O |
BS |
|
IM |
|
|
|
|
B |
|
Figure 3.11. THE IMPEDANCIMETRIC SIGNAL. An impedance meter IM looks into the impedance ZAB offered by the biological system BS. To detect the impedance, a voltage EAB between points A and B must be applied forcing a current I through BS. Some physiological variable in the latter changes the impedance and the meter produces an output O. A similar diagram can be drawn in terms of admittance. The student is encouraged to do it.
Chapter 3. Signals: What They Are |
241 |
research, especially in vivo. Equation (3.1) clearly shows that any geometrical change will also cause a change in resistance.
In the second case, we consider a capacitor of parallel plates of area A, separated by a distance d, with an insulating material in between. If the material is vacuum, the capacitance value is Co; if, instead, some other insulator is placed, C will be the value of the capacitance. The relationship K = C/Co defines the so-called dielectric constant of the insulating material. Besides, the capacitance Co is given by a simple and wellknown expression,
Co = εo |
A |
(3.2) |
|
d |
|||
|
|
where εo = 8.85×10⁻¹² coulombs2/N×m2 stands for the permittivity of vacuum (Tippens, 1973). From the above-said definition of dielectric constant and by the use of equation (3.2), the following is obtained,
C = KCo = Kεo |
A |
=ε |
A |
(3.3) |
|||
d |
|
d |
|
||||
|
|
|
|||||
where ε represents the permittivity of the insulating medium. It is easy to verify that K = ε/εo allowing the dielectric constant of the insulating medium to also be called relative permittivity. There is still a paucity of full knowledge of this characteristic property in biological materials. By the same token, as mentioned above for the resistive case, if a physiological variable somehow induces changes in the permittivity or in the geometry of the system under study, modifications will also be produced in the reactive component of the biological impedance presented by the system. Foster and Schwan (1989) offered a list of permittivity values for some biological tissues. For example, the relative permittivity of blood they reported is 4×10³, measured at 100 kHz, while that of skeletal muscle is 1×10⁷ at 10 Hz and 8×10⁴ at 10 kHz. In other words, it falls as the testing frequency increases. Such behavior is typical of any biological tissue. Observe that relative permittivity (as any relative parameter), because of its very definition, is just a dimensionless number.
3.2.4.2. Concept of biological impedance
If a voltage EAB is applied across any biological tissue, a current I will tend to traverse the tissue, finding electrical impedance that is mathematically described by the complex relation between EAB and I (Figure
242 |
Understanding the Human Machine |
3.11). This is similar to the technological impedance definition. The biological impedance ZB usually shows a constant component Zo and a timedependent variational part ∆Z which may vary with different factors of the living tissue, such as its geometry, temperature, biochemistry, or others. Thus,
ZB = Z0 +∆Z |
(3.4) |
which can also be broken down into the resistive and reactive components. Usually, the variational part delta is what really matters because it contains the information about the changes induced by the physiological variable. Hence, most of the time the constant component Zo is discarded.
3.2.4.3. Some examples of physiological impedancimetric signals
− Respiration
The impedance technique as a method of detecting respiration is based upon the close correlation found experimentally between changes in the respired volumes and changes in transthoracic impedance; i.e., during inspiration, the impedance increases, while during expiration, it decreases. The precise origin of these impedance modifications has not been well explained yet, but the idea has proved to be useful and easy to implement (Morucci, Valentinuzzi, Rigaud et al., 1996).
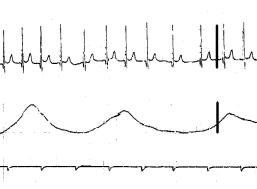
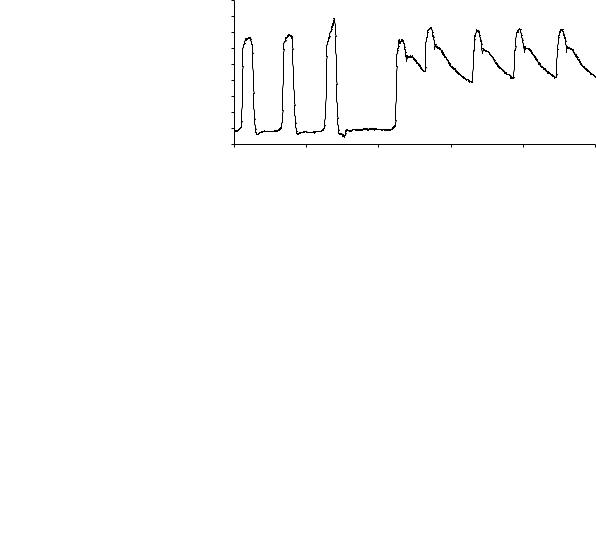
Figure 3.12 shows records obtained from an 8-year-old girl using the same pair of electrodes placed bilaterally at the xiphoid level and on the mid-axillary line. The first channel is the surface electrocardiogram and the second is respiration (inspiration upward). The figure shows also the time marks at 1 s each. There is an increase in cardiac frequency during inspiration and a decrease during expiration. This physiological phenomenon is known as the respiratory heart rate response (RHRR), which is more marked in children than in the adult. The respiratory impedancimetric signal is quite handy for the newborn, for children in general and also for weak people who may find difficulties breathing into a spirometer. It is also useful in animals, from the small one, as the mouse, to big animals like the cow or horse. Calibration in absolute terms, that is, in ohms per cubic centimeter, remains a problem with a highly restricted answer (Geddes and Baker, 1989; Morucci, Valentinuzzi, Rigaud et al., 1996).
Chapter 3. Signals: What They Are |
243 |
Figure 3.12. RESPIRATION RECORDED WITH IMPEDANCE. The upper channel is the surface ECG and the second channel is the transthoracic impedance. Channel 3 indicates the time marks 1 s apart. The heavy dark vertical bars display calibrations: 1mV for the ECG and 5 ohms for impedance. Records obtained by the author at the Department of Physiology, Baylor College of Medicine, Houston, TX, 1968.
− Impedance cardiography
The respiratory signal recorded with the impedance concept contains also a faster and much smaller component, which is contributed by the heart contractions. When adequately recorded and processed, it is possible to obtain stroke volume by application of a simple theory (Geddes and Baker, 1989; Morucci, Valentinuzzi, Rigaud et al., 1996).
− Other bioimpedancimetric signals
The impedance technique in biology is a subspecialty in itself by far beyond the scope of this textbook. Suffice it to say that it can be used to evaluate the circulation of the extremities, intraventricular volumes, brain circulation, total body water, muscular contractions and a variety of physiological and biological events. In fact, it is only limited by human ingenuity (Geddes and Baker, 1989; Morucci, Valentinuzzi, Rigaud et al., 1996; Riu, Rossell, Bragós et al., 1999). The latter authors are active in this subject at the Universitat Politècnica de Catalunya, Barcelona, Spain.
The interested student is invited to search in the literature for the multiple applications of the impedance technique describing the kind of signals they produce. There are several websites with ample information. Use the word “bioimpedance” to find them.
244 |
Understanding the Human Machine |
As an exercise, try to see why a skeletal muscle, the uterus, the stomach, the vagina, a microbial culture, may cause a change in their respective impedances when either a bipolar or tetrapolar lead system of electrodes are adequately placed. The first three should detect movement, the fourth should give information regarding ovulation in women and estral conditions in animals like mares or cows, and the latter should be related to bacterial growth.
3.2.5. Biohydraulic Events and their Signals
The electrical activity gives the “go”, but pressure sustains the flow, which, in the end, keeps the tissues alive.
This term —biohydraulics— is not common, however, it is descriptive. It refers to the pressure and flow developed by fluids in the very many body cavities. In particular, we associate it mainly with the so-called hemodynamics in medical practice, i.e., with cardiovascular compartments and their moving blood contents.
The variables playing a role in the cardiovascular system (CVS) have been introduced and discussed in Chapter 2. One of them, blood pressure in general, represents a matter of concern and study, but arterial blood pressure is particularly important for the wealth of information it contains and because of the current easiness to measure it. Almost everybody is familiar with the arm cuff and the small instrument used daily by practicioners, nurses, and even laypeople at hospitals and homes.
Stephen Hales (1677–1761) —minister at Teddington in Middlessex— was the first to actually measure arterial blood pressure in the horse publishing his results in a famous opera entitled Statical Essays, in 1733 (Willius and Keys, 1941).
|
180 |
|
|
|
|
160 |
|
|
|
[mmHg] |
140 |
|
|
|
120 |
|
|
|
|
100 |
|
|
|
|
Pressure |
80 |
|
|
|
60 |
|
|
Mean pressure |
|
40 |
|
|
|
|
|
|
|
|
|
|
20 |
|
|
|
|
0 |
|
|
|
|
7 |
8 |
9 |
10 |
Time [s]
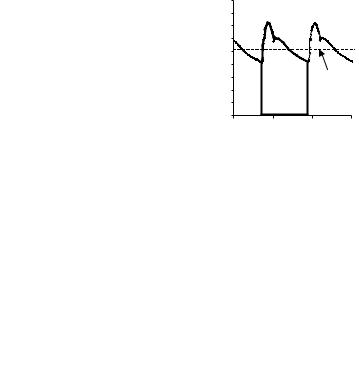
Figure 3.13. ARTERIAL BLOOD PRESSURE. It represents and ideal record showing the maximum or systolic pressure, the minimum or diastolic pressure and the well-known mean pressure defined mathematically as the area under one cycle divided by its duration. Record obtained in the Department of Bioengineering, UNT, 1996.
Chapter 3. Signals: What They Are |
245 |
His verbatim description goes like this: “In December I caused a mare to be tied down alive on her back; she was 14 hands high, and about 14 years of age, had a fistula on her withers, was neither very lean nor yet lusty. Having laid open the left crural artery about 3 inches from her belly, I inserted into it a brass pipe whose bore was 1/6 of an inch in diameter; and to that, by means of another brass pipe which was fitly adapted to it, I fixed a glass tube, of nearly the same diameter, which was 9 feet in length. Then untying the ligature on the artery, the blood rose in the tube 8 feet 3 inches perpendicular above the level of the left ventricle of the heart, but it not attain its full height at once.”
He had performed the first measurement of blood pressure by direct cannulation and had invented the open tube vertical manometer. The unit of measurement was inches of blood, nearly equal to water for blood is slightly denser than the former. The student should find out what the withers and the crural artery are. Besides, he/she should think whether the animal was anesthetized or not. When was anesthesia introduced?
The development, which ensued in the 250 years that followed after the scientific event described above, constitutes a fascinating piece of history nicely told by Geddes (1970) in a delightful book. Nowadays, we are able to record blood pressure continuously as a function of time (Figure 3.13). This signal is routinely obtained in research laboratories and during many types of surgical procedures. One of the technical problems
|
180 |
|
|
3 |
|
|
|
|
|
|
160 |
1 |
2 |
4 |
5 |
6 |
7 |
8 |
|
|
140 |
|
|||||||
[mmHg] |
|
|
|
|
|
|
|||
|
|
|
|
|
|
|
|
||
120 |
|
|
|
|
|
|
|
|
|
100 |
|
|
|
|
|
|
|
|
|
Pressure |
80 |
|
|
|
|
|
|
|
|
60 |
|
|
|
|
|
|
|
|
|
40 |
|
|
|
|
|
|
|
|
|
|
|
|
|
|
|
|
|
|
|
|
20 |
|
|
|
|
|
|
|
|
|
0 |
|
|
|
|
|
|
|
|
|
0 |
|
2 |
|
4 |
|
6 |
8 |
10 |
Time [s]
Figure 3.14. BLOOD PRESSURE AS A TIME COURSE EVENT. Experimental canine blood pressure record obtained form the left ventricle (beats 1,2,3) and the aorta (beats 4–8) as a microtip catheter was withdrawn from the ventricle. The dicrotic notch is clearly seen, meaning an acceptable faithful reproduction. If the notch disappears, it may mean incorrect instrumental detection, that is, not enough harmonics are included by the recording system (see text). Records obtained at the Department of Bioengineering, 1996.
246 |
Understanding the Human Machine |
encountered is the faithful reproduction of the event, which is related to the harmonic content of the signal. It has been determined that in this particular case of arterial pressure, the spectrum must go from zero frequency (or dc) up to about the 10th harmonic (Geddes, 1970; Geddes, 1984). Figure 3.14 displays an actual arterial blood pressure record from an anesthetized dog.
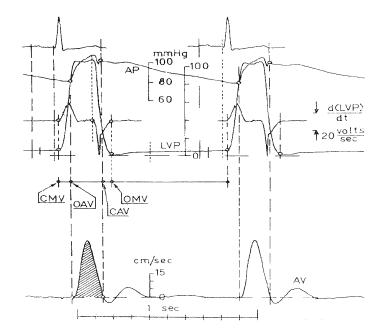
Figure 3.15. SET OF SIGNALS FROM THE CVS (two electrical and three of biohydraulic origin). These are five channels obtained from an anesthetized dog (with fentanyl, droperidol and sodium pentobarbital) using a high-speed recorder. Channel 1 is the ECG, lead II, clearly showing two consecutive beats that were the trigger of the other events. The second channel AP is arterial blood pressure picked up at the root of the aorta with a microtip transducer. It clearly shows the dicrotic notch, which marks the closure of the aortic valve. The third channel is the time derivative (electronically obtained) of the fourth channel, the intraventricular pressure. That derivative is to evaluate myocardial contractility. Finally, the last channel is blood velocity in the upper portion of the aorta detected with a miniature electromagnetic transducer. The lower horizontal bar shows time marks 1s apart. Records obtained by the author at the Department of Physiology, Baylor College of Medicine, Houston, TX, 1976.
Chapter 3. Signals: What They Are |
247 |
Study subject: Determine the conditions for the faithful reproduction of arterial blood pressure in the dog, the rabbit, the mouse and the hummingbird. Hint: Take into account the normal expected cardiac frequency. Search in the literature for different arterial blood pressure records, from different species and also from different arteries within the same subject.
Blood flow is the other biohydraulic event of great significance but not easy to measure or record. Figure 3.15 depicts an excellent set of five signals from the heart. The left ventricle ejects blood in cyclic spurts (see Chapter 2) when the aortic valve is opened (from OAV to CAV in the figure). The area under the velocity curve (dashed) measures stroke volume (velocity in cm/s × ejection time in s) when multiplied by the aortic cross-sectional area in square cm. In this particular case, a postmortem examination gave an aortic diameter of 1.5 cm meaning a cross-sectional area of 1.77 cm2. This led to a stroke volume of 5.8 cm3/beat and a cardiac output of 377 cm3/min at 65 beats/min. The animal (15 kg of body weight) had filaria (heart worms in the common language, rather frequent in the state of Texas, where the experiment was carried out) so accounting for the low value. A dog of this weight should have given in the order of 1,200 cm3/min for cardiac output. CMV and OMV in the figure stand for closure and opening, respectively, of the mitral valve. The student is invited to review the section on the CVS in Chapter 2 to better understand Figure 3.15.
Find out what heartworms are (filaria). As mentioned above, it is a rather common disease in dogs in the State of Texas. How is it transmitted?
Heart sounds are classified here as a biohydraulic kind of signal, admitting that the criterion is rather arbitrary. It might be called a paraphenomenon because, as the prefix para- indicates, it suggests something auxiliary or derivative from the main word, and precisely, heart sounds are the audible manifestation of important biohydraulic events supplying significant pathophysiological information of clinical value.
The origins of these sounds can be traced back to several causes:
1. Closure and opening of the cardiac valves, the former more than the latter, which produce sudden acceleration and deceleration of blood leading to vibrations that propagate to the anatomical vicinity of the source.