

OutlookPub2009
.pdfCharts and Price Projections: FAPRI 2009 Agricultural Outlook / 25
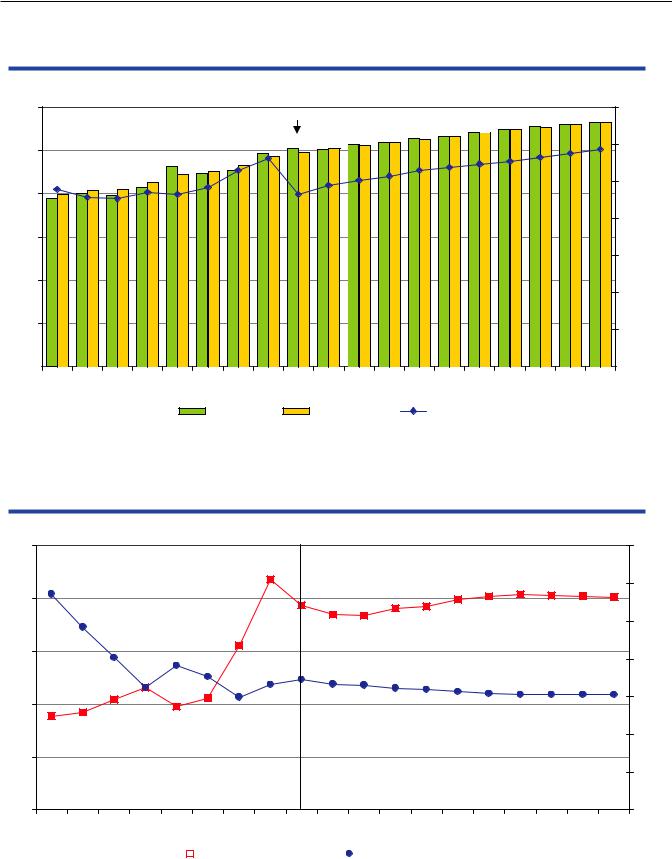
World Rice Stocks-to-Use Ratio Versus Price
Dollars per Metric Ton |
|
|
|
|
|
|
|
|
Percent |
|
600 |
|
|
|
|
|
|
|
|
|
40 |
500 |
|
|
|
|
|
|
|
|
|
35 |
|
|
|
|
|
|
|
|
|
|
|
|
|
|
|
|
|
|
|
|
|
30 |
400 |
|
|
|
|
|
|
|
|
|
25 |
|
|
|
|
|
|
|
|
|
|
|
300 |
|
|
|
|
|
|
|
|
|
20 |
200 |
|
|
|
|
|
|
|
|
|
15 |
|
|
|
|
|
|
|
|
|
|
|
|
|
|
|
|
|
|
|
|
|
10 |
100 |
|
|
|
|
|
|
|
|
|
5 |
|
|
|
|
|
|
|
|
|
|
|
0 |
|
|
|
|
|
|
|
|
|
0 |
1998/99 |
2000/01 |
2002/03 |
2004/05 |
2006/07 |
2008/09 |
2010/11 |
2012/13 |
2014/15 |
2016/17 |
2018/19 |

 FOB Bangkok 100% B Grade
  Stocks-to-Use Ratio
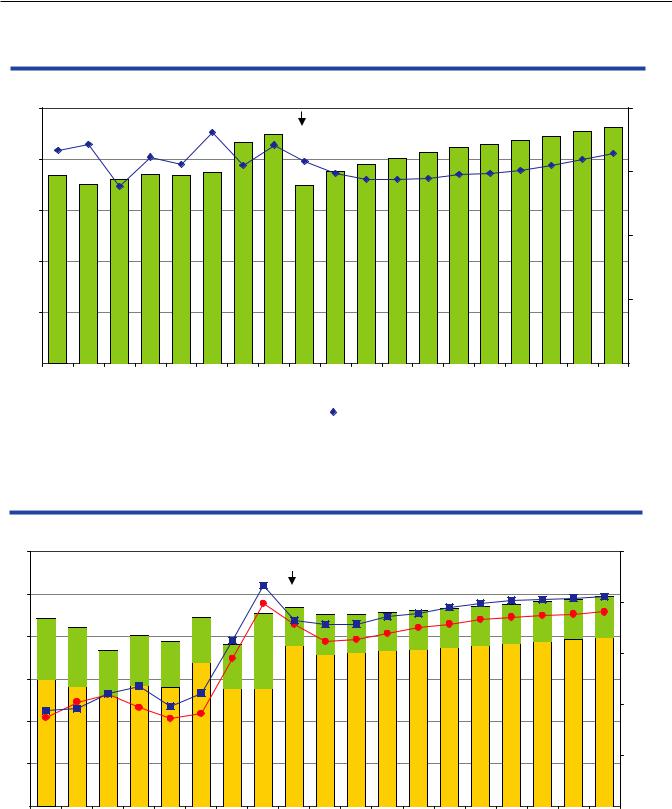
World Rice Net Exports
Thousand Metric Tons
35,000
30,000
25,000
20,000
15,000
10,000
5,000 |
|
|
|
|
|
|
|
|
|
|
0 |
|
|
|
|
|
|
|
|
|
|
1998/99 |
2000/01 |
2002/03 |
2004/05 |
2006/07 |
2008/09 |
2010/11 |
2012/13 |
2014/15 |
2016/17 |
2018/19 |

 India
India 
 Pakistan
 Thailand
 U.S.
U.S. 
 Vietnam
26 / Charts and Price Projections: FAPRI 2009 Agricultural Outlook
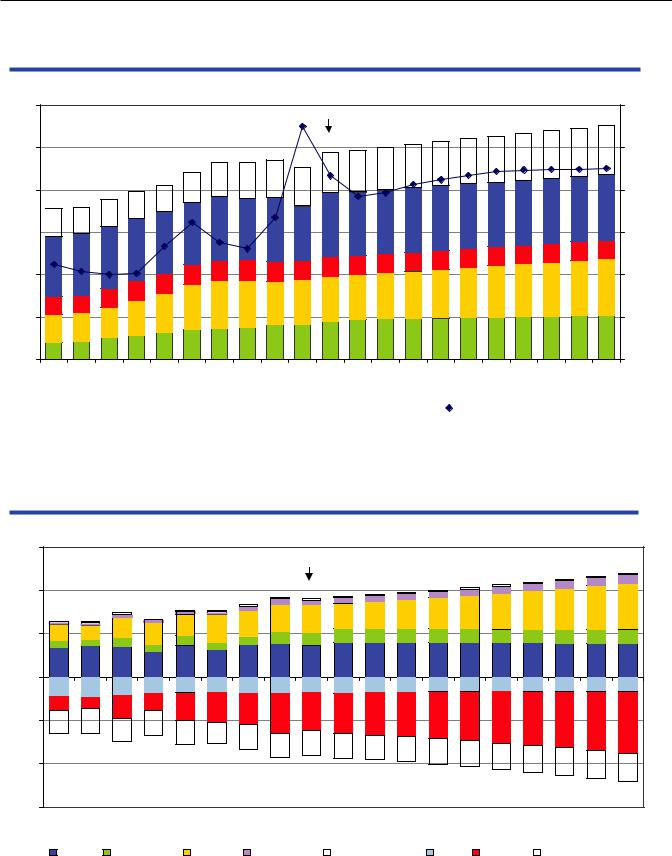
World Coarse Grain Supply and Utilization
Million Metric Tons |
Million Metric Tons |
1200 |
|
|
|
|
|
|
|
|
140 |
1000 |
|
|
|
|
|
|
|
|
120 |
|
|
|
|
|
|
|
|
|
|
800 |
|
|
|
|
|
|
|
|
100 |
|
|
|
|
|
|
|
|
|
|
|
|
|
|
|
|
|
|
|
80 |
600 |
|
|
|
|
|
|
|
|
|
|
|
|
|
|
|
|
|
|
60 |
400 |
|
|
|
|
|
|
|
|
40 |
|
|
|
|
|
|
|
|
|
|
200 |
|
|
|
|
|
|
|
|
20 |
|
|
|
|
|
|
|
|
|
|
2000/01 |
2002/03 |
2004/05 |
2006/07 |
2008/09 |
2010/11 |
2012/13 |
2014/15 |
2016/17 |
2018/19 |
Production |
Consumption |
Net Trade |
World Corn Stocks-to-Use Ratio Versus Price
Dollars per Metric Ton |
|
|
|
|
|
|
|
Percent |
|
250 |
|
|
|
|
|
|
|
|
35 |
|
|
|
|
|
|
|
|
|
30 |
200 |
|
|
|
|
|
|
|
|
|
|
|
|
|
|
|
|
|
|
25 |
150 |
|
|
|
|
|
|
|
|
20 |
|
|
|
|
|
|
|
|
|
|
100 |
|
|
|
|
|
|
|
|
15 |
|
|
|
|
|
|
|
|
|
|
|
|
|
|
|
|
|
|
|
10 |
50 |
|
|
|
|
|
|
|
|
|
|
|
|
|
|
|
|
|
|
5 |
0 |
|
|
|
|
|
|
|
|
0 |
2000/01 |
2002/03 |
2004/05 |
2006/07 |
2008/09 |
2010/11 |
2012/13 |
2014/15 |
2016/17 |
2018/19 |
|
|
|
U.S. FOB Gulf Price |
|
Stocks-to-Use Ratio |
|
|
|
|
Charts and Price Projections: FAPRI 2009 Agricultural Outlook / 27
World Corn Net Trade and U.S. Market Share
Million Metric Tons |
Percent |
100 |
|
|
|
|
|
|
|
|
80 |
80 |
|
|
|
|
|
|
|
|
60 |
|
|
|
|
|
|
|
|
|
|
60 |
|
|
|
|
|
|
|
|
|
|
|
|
|
|
|
|
|
|
40 |
40 |
|
|
|
|
|
|
|
|
|
20 |
|
|
|
|
|
|
|
|
20 |
|
|
|
|
|
|
|
|
|
|
|
|
|
|
|
|
|
|
|
0 |
2000/01 |
2002/03 |
2004/05 |
2006/07 |
2008/09 |
2010/11 |
2012/13 |
2014/15 |
2016/17 |
2018/19 |
|
Net Trade |
|
U.S. Market Share |
|
|
||
|
World Barley and Sorghum Net Trade and Prices
Million Metric Tons |
U.S. Dollar per Metric Ton |
30 |
|
|
|
|
|
|
|
|
250 |
25 |
|
|
|
|
|
|
|
|
200 |
|
|
|
|
|
|
|
|
|
|
20 |
|
|
|
|
|
|
|
|
|
|
|
|
|
|
|
|
|
|
150 |
15 |
|
|
|
|
|
|
|
|
|
|
|
|
|
|
|
|
|
|
100 |
10 |
|
|
|
|
|
|
|
|
|
5 |
|
|
|
|
|
|
|
|
50 |
|
|
|
|
|
|
|
|
|
|
|
|
|
|
|
|
|
|
|
0 |
2000/01 |
2002/03 |
2004/05 |
2006/07 |
2008/09 |
2010/11 |
2012/13 |
2014/15 |
2016/17 |
2018/19 |

 Barley Net Trade
  Sorghum Net Trade
  Barley Price, Canada Feed FOB
 Sorghum Price, FOB Gulf
28 / Charts and Price Projections: FAPRI 2009 Agricultural Outlook
World Soybean Area Harvested and Price
Million Hectares
120
100
80
60 

40
20 |
0 |
Dollars per Metric Ton
600
500
400
300
200
100 |
0 |
1998/99 |
2000/01 |
2002/03 |
2004/05 |
2006/07 |
2008/09 |
2010/11 |
2012/13 |
2014/15 |
2016/17 |
2018/19 |
|||||||
|
|
Argentina |
|
|
Brazil |
|
China |
|
U.S. |
|
Other |
|
Soybean Price, Rotterdam |
||||
|
|
|
|
|
|
|
|
||||||||||
|
|
|
|
|
|
||||||||||||
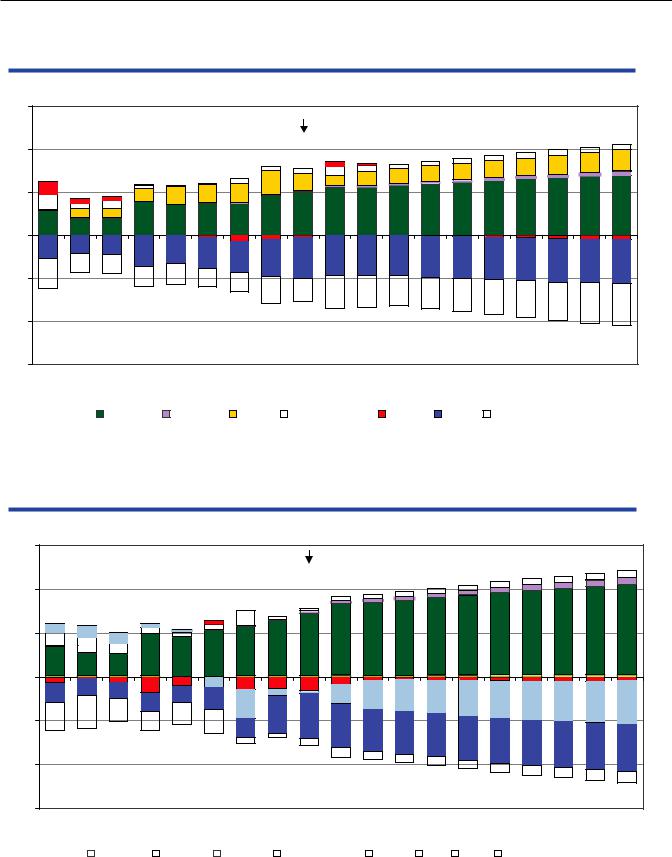
World Soybean Net Trade
Million Metric Tons
120 |
|
|
|
|
|
|
|
|
|
80 |
|
|
|
|
|
|
|
|
|
40 |
|
|
|
|
|
|
|
|
|
0 |
|
|
|
|
|
|
|
|
|
-40 |
|
|
|
|
|
|
|
|
|
-80 |
|
|
|
|
|
|
|
|
|
-120 |
|
|
|
|
|
|
|
|
|
2000/01 |
2002/03 |
2004/05 |
2006/07 |
2008/09 |
2010/11 |
2012/13 |
2014/15 |
2016/17 |
2018/19 |
U.S. |
Argentina |
Brazil |
Paraguay |
Other Exports |
EU |
China |
Other Imports |
||

Charts and Price Projections: FAPRI 2009 Agricultural Outlook / 29
World Soybean Crush
Million Metric Tons
300
250
200
150
100 |
50 |
0 |
2000/01 |
2002/03 |
2004/05 |
2006/07 |
2008/09 |
2010/11 |
2012/13 |
2014/15 |
2016/17 |
2018/19 |
||||||||||||
|
|
Argentina |
|
Brazil |
|
|
China |
|
|
EU |
|
|
India |
|
|
Japan |
|
|
U.S. |
Other |
|
|
|
|
|
|
|
|
|
|
|||||||||||||
|
|
|
|
|
|
|
|
|
|||||||||||||
World Soybean Meal Net Trade
Million Metric Tons
80 |
|
|
|
|
|
|
|
|
|
|
|
60 |
|
|
|
|
|
|
|
|
|
|
|
40 |
|
|
|
|
|
|
|
|
|
|
|
20 |
|
|
|
|
|
|
|
|
|
|
|
0 |
|
|
|
|
|
|
|
|
|
|
|
-20 |
|
|
|
|
|
|
|
|
|
|
|
-40 |
|
|
|
|
|
|
|
|
|
|
|
-60 |
|
|
|
|
|
|
|
|
|
|
|
-80 |
|
|
|
|
|
|
|
|
|
|
|
2000/01 |
2002/03 |
2004/05 |
2006/07 |
2008/09 |
2010/11 |
2012/13 |
2014/15 |
2016/17 |
2018/19 |
||
|
U.S. |
Argentina |
Brazil |
Other Exports |
EU |
Japan |
Mexico |
Other Imports |
|
||

30 / Charts and Price Projections: FAPRI 2009 Agricultural Outlook
World Soybean Oil Net Trade
Million Metric Tons
15 |
|
|
|
|
|
|
|
|
|
10 |
|
|
|
|
|
|
|
|
|
5 |
|
|
|
|
|
|
|
|
|
0 |
|
|
|
|
|
|
|
|
|
-5 |
|
|
|
|
|
|
|
|
|
-10 |
|
|
|
|
|
|
|
|
|
-15 |
|
|
|
|
|
|
|
|
|
2000/01 |
2002/03 |
2004/05 |
2006/07 |
2008/09 |
2010/11 |
2012/13 |
2014/15 |
2016/17 |
2018/19 |
|
Argentina |
Brazil |
U.S. |
Other Exports |
China |
India |
Other Imports |
|
|
Soybean Oil Per Capita Consumption in Selected Countries
Kilograms per Person
30 |
|
|
|
|
|
|
|
|
|
25 |
|
|
|
|
|
|
|
|
|
20 |
|
|
|
|
|
|
|
|
|
15 |
|
|
|
|
|
|
|
|
|
10 |
|
|
|
|
|
|
|
|
|
5 |
|
|
|
|
|
|
|
|
|
0 |
|
|
|
|
|
|
|
|
|
2000/01 |
2002/03 |
2004/05 |
2006/07 |
2008/09 |
2010/11 |
2012/13 |
2014/15 |
2016/17 |
2018/19 |
|
China |
India |
Japan |
U.S. |
EU |
Taiwan |
Brazil |
|
|

Charts and Price Projections: FAPRI 2009 Agricultural Outlook / 31
World Rapeseed Area Harvested and Price
Million Hectares |
Dollars per Metric Ton |
35 |
700 |
30 |
600 |
25 |
500 |
20 |
400 |
15 |
300 |
10 |
200 |
5 |
100 |
0 |
2000/01 |
2002/03 |
2004/05 |
2006/07 |
2008/09 |
2010/11 |
2012/13 |
2014/15 |
2016/17 |
2018/19 |
|||||||
|
|
Australia |
|
Canada |
|
China |
|
EU |
|
India |
|
Other |
|
Rapeseed Price, Hamburg |
||
|
|
|
|
|
|
|
|
|||||||||
|
|
|
|
|
|
|
||||||||||
World Rapeseed Net Trade
Million Metric Tons
12 |
|
|
|
|
|
|
|
|
|
|
8 |
|
|
|
|
|
|
|
|
|
|
4 |
|
|
|
|
|
|
|
|
|
|
0 |
|
|
|
|
|
|
|
|
|
|
-4 |
|
|
|
|
|
|
|
|
|
|
-8 |
|
|
|
|
|
|
|
|
|
|
-12 |
|
|
|
|
|
|
|
|
|
|
2000/01 |
2002/03 |
2004/05 |
2006/07 |
2008/09 |
2010/11 |
2012/13 |
2014/15 |
2016/17 |
2018/19 |
|
|
Canada |
Other CIS |
Ukraine |
Other Exports |
China |
EU |
Japan |
Other Imports |
|
|
32 / Charts and Price Projections: FAPRI 2009 Agricultural Outlook
World Rapeseed Meal Net Trade
Million Metric Tons
6 |
|
|
|
|
|
|
|
|
|
|
4 |
|
|
|
|
|
|
|
|
|
|
2 |
|
|
|
|
|
|
|
|
|
|
0 |
|
|
|
|
|
|
|
|
|
|
-2 |
|
|
|
|
|
|
|
|
|
|
-4 |
|
|
|
|
|
|
|
|
|
|
-6 |
|
|
|
|
|
|
|
|
|
|
2000/01 |
2002/03 |
2004/05 |
2006/07 |
2008/09 |
2010/11 |
2012/13 |
2014/15 |
2016/17 |
2018/19 |
|
|
Canada |
Ukraine |
India |
Other Exports |
China |
U.S. |
Other Imports |
|
||
World Rapeseed Oil Net Trade
Million Metric Tons
3.0 |
2.0 |
1.0 |
0.0 |
-1.0 |
-2.0 |
-3.0 |
2000/01 |
2002/03 |
2004/05 |
2006/07 |
2008/09 |
2010/11 |
2012/13 |
2014/15 |
2016/17 |
2018/19 |
|||||||||
|
|
Australia |
|
Canada |
|
Ukraine |
Other Exports |
|
China |
|
|
EU |
|
U.S. |
Other Imports |
|
||
|
|
|
|
|
|
|
|
|||||||||||
|
|
|
|
|
|
|
|
|||||||||||

|
|
Charts and Price Projections: FAPRI 2009 Agricultural Outlook / 33 |
|||
|
World Sunflower Area Harvested and Price |
|
|
|
|
|
|
|
|
||
|
Million Hectares |
Dollars per Metric Ton |
|||
30 |
|
|
800 |
||
|
|
||||
700
25
|
600 |
20 |
500 |
|
|
15 |
400 |
10 |
300 |
|
|
|
200 |
5 |
100 |
|
|
0 |
0 |
2000/01 |
2002/03 |
2004/05 |
2006/07 |
2008/09 |
2010/11 |
2012/13 |
2014/15 |
2016/17 |
2018/19 |
|||
|
|
|
Argentina |
|
|
|
|
China |
|
|
|
|
|
|
|
|
|
|
|
|
|
||||
|
|
|
|
|
|
|
|
|
||||
|
|
|
EU |
|
|
|
|
|
Other CIS |
|
|
|
|
|
|
|
|
|
|
|
|
|
|||
|
|
|
|
|
|
|
|
|
|
|||
|
|
|
Ukraine |
|
|
|
|
|
Other |
|
|
|
|
|
|
|
|
|
|
|
|
|
|||
|
|
|
|
|
|
|
|
|
|
|||
|
|
|
Sunflower Price, CIF Lower Rhine |
|
|
|
|
|
|
|||
|
|
|
|
|
|
|
|
|
||||
World Sunflower Net Trade
Million Metric Tons
3 |
|
|
|
|
|
|
|
|
|
2 |
|
|
|
|
|
|
|
|
|
1 |
|
|
|
|
|
|
|
|
|
0 |
|
|
|
|
|
|
|
|
|
-1 |
|
|
|
|
|
|
|
|
|
-2 |
|
|
|
|
|
|
|
|
|
-3 |
|
|
|
|
|
|
|
|
|
2000/01 |
2002/03 |
2004/05 |
2006/07 |
2008/09 |
2010/11 |
2012/13 |
2014/15 |
2016/17 |
2018/19 |

 Argentina
 Other CIS
 Ukraine
 Other Exports
 EU
EU 
 Other Imports

34 / Charts and Price Projections: FAPRI 2009 Agricultural Outlook
World Sunflower Meal Net Trade
Million Metric Tons
6
4
2 |
0 |
-2 |
-4
-6
2000/01 |
2002/03 |
2004/05 |
2006/07 |
2008/09 |
2010/11 |
2012/13 |
|
2014/15 |
2016/17 |
2018/19 |
|||||||
|
|
|
Argentina |
|
Other CIS |
|
Ukraine |
Other Exports |
|
|
EU |
Other Imports |
|
||||
|
|
|
|
|
|
|
|||||||||||
|
|
|
|
|
|
|
|||||||||||
World Sunflower Oil Net Trade
Million Metric Tons
6
4
2 |
0 |
-2 |
-4
-6
2000/01 |
2002/03 |
2004/05 |
2006/07 |
2008/09 |
2010/11 |
2012/13 |
2014/15 |
2016/17 |
2018/19 |
|||||||||
|
|
Argentina |
|
|
Other CIS |
|
|
Ukraine |
Other Exports |
|
China |
|
EU |
Other Imports |
|
|||
|
|
|
|
|
|
|
||||||||||||
|
|
|
|
|
|
|
||||||||||||