

OutlookPub2009
.pdfCharts and Price Projections: FAPRI 2009 Agricultural Outlook / 15
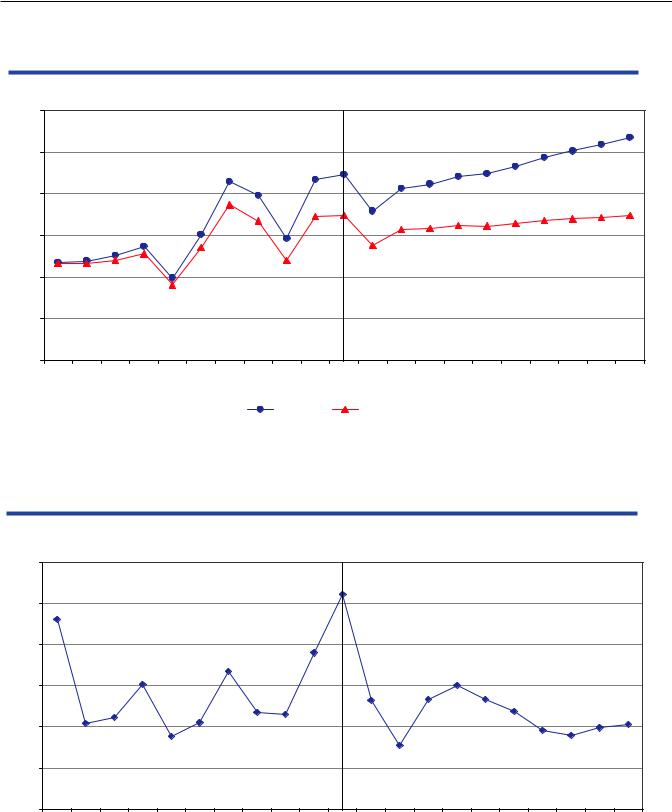
U.S. Biofuel Use Mandates
Billion Gallons
30 |
|
|
|
|
|
|
|
|
|
|
|
|
|
25 |
|
|
|
|
|
|
|
|
|
|
|
|
|
20 |
|
|
|
|
|
|
|
|
|
|
|
|
|
15 |
|
|
|
|
|
|
|
|
|
|
|
|
|
10 |
|
|
|
|
|
|
|
|
|
|
|
|
|
5 |
|
|
|
|
|
|
|
|
|
|
|
|
|
0 |
|
|
|
|
|
|
|
|
|
|
|
|
|
2005 |
2006 |
2007 |
2008 |
2009 |
2010 |
2011 |
2012 |
2013 |
2014 |
2015 |
2016 |
2017 |
2018 |
|
|
|
|
|
Conventional |
Advanced |
|
|
|
|
|
||
U.S. Conservation Reserve Program Area
Million Acres
40 |
|
|
|
|
|
|
|
|
|
|
|
|
|
35 |
|
|
|
|
|
|
|
|
|
|
|
|
|
30 |
|
|
|
|
|
|
|
|
|
|
|
|
|
25 |
|
|
|
|
|
|
|
|
|
|
|
|
|
20 |
|
|
|
|
|
|
|
|
|
|
|
|
|
15 |
|
|
|
|
|
|
|
|
|
|
|
|
|
10 |
|
|
|
|
|
|
|
|
|
|
|
|
|
5 |
|
|
|
|
|
|
|
|
|
|
|
|
|
0 |
|
|
|
|
|
|
|
|
|
|
|
|
|
2005 |
2006 |
2007 |
2008 |
2009 |
2010 |
2011 |
2012 |
2013 |
2014 |
2015 |
2016 |
2017 |
2018 |
16 / Charts and Price Projections: FAPRI 2009 Agricultural Outlook
U.S. Crop Planted Area
Million Acres
100 |
|
|
|
|
|
|
|
|
|
|
90 |
|
|
|
|
|
|
|
|
|
|
80 |
|
|
|
|
|
|
|
|
|
|
70 |
|
|
|
|
|
|
|
|
|
|
60 |
|
|
|
|
|
|
|
|
|
|
50 |
|
|
|
|
|
|
|
|
|
|
98/99 |
00/01 |
02/03 |
04/05 |
06/07 |
08/09 |
10/11 |
12/13 |
14/15 |
16/17 |
18/19 |
|
|
|
|
Wheat |
Corn |
Soybeans |
|
|
|
|
U.S. Crop Exports
Billion Bushels
3.0 |
|
|
|
|
|
|
|
|
|
|
2.5 |
|
|
|
|
|
|
|
|
|
|
2.0 |
|
|
|
|
|
|
|
|
|
|
1.5 |
|
|
|
|
|
|
|
|
|
|
1.0 |
|
|
|
|
|
|
|
|
|
|
0.5 |
|
|
|
|
|
|
|
|
|
|
0.0 |
|
|
|
|
|
|
|
|
|
|
98/99 |
00/01 |
02/03 |
04/05 |
06/07 |
08/09 |
10/11 |
12/13 |
14/15 |
16/17 |
18/19 |
|
|
|
|
Wheat |
Corn |
Soybeans |
|
|
|
|

Charts and Price Projections: FAPRI 2009 Agricultural Outlook / 17
U.S. Crop Prices
Dollars per Bushel
12 |
|
|
|
|
|
|
|
|
|
|
10 |
|
|
|
|
|
|
|
|
|
|
8 |
|
|
|
|
|
|
|
|
|
|
6 |
|
|
|
|
|
|
|
|
|
|
4 |
|
|
|
|
|
|
|
|
|
|
2 |
|
|
|
|
|
|
|
|
|
|
0 |
|
|
|
|
|
|
|
|
|
|
98/99 |
00/01 |
02/03 |
04/05 |
06/07 |
08/09 |
10/11 |
12/13 |
14/15 |
16/17 |
18/19 |
|
|
|
|
Wheat |
Corn |
Soybeans |
|
|
|
|
U.S. Feed and Residual Disappearance
Million Metric Tons
250
200 |
150 |
100
50
0
98/99 |
00/01 |
02/03 |
04/05 |
06/07 |
08/09 |
10/11 |
12/13 |
14/15 |
|||||||
|
|
|
|
Corn |
|
|
Corn By-Products |
|
|
Other Grains |
|
Oilseed Meals |
|||
|
|
|
|
|
|
|
|||||||||
|
|
|
|
|
|
|
|||||||||
16/17 |
18/19 |

18 / Charts and Price Projections: FAPRI 2009 Agricultural Outlook
U.S. Biofuel Production
Billion Gallons
20 |
|
|
|
|
|
|
|
|
|
|
|
|
|
|
|
|
|
16 |
|
|
|
|
|
|
|
|
|
|
|
|
|
|
|
|
|
12 |
|
|
|
|
|
|
|
|
|
|
|
|
|
|
|
|
|
8 |
|
|
|
|
|
|
|
|
|
|
|
|
|
|
|
|
|
4 |
|
|
|
|
|
|
|
|
|
|
|
|
|
|
|
|
|
2001 |
2002 |
2003 |
2004 |
2005 |
2006 |
2007 |
2008 |
2009 |
2010 |
2011 |
2012 |
2013 |
2014 |
2015 |
2016 |
2017 |
2018 |
|
Corn-based |
|
Other ethanol |
|
Biodiesel |
|
|
|
|||
|
|
|
U.S. Farm-Level Prices Paid Indices
Index, 1990-1992=100 |
|
|
|
|
|
|
|
|
|
|
450 |
|
|
|
|
|
|
|
|
|
|
400 |
|
|
|
|
|
|
|
|
|
|
350 |
|
|
|
|
|
|
|
|
|
|
300 |
|
|
|
|
|
|
|
|
|
|
250 |
|
|
|
|
|
|
|
|
|
|
200 |
|
|
|
|
|
|
|
|
|
|
150 |
|
|
|
|
|
|
|
|
|
|
100 |
|
|
|
|
|
|
|
|
|
|
50 |
|
|
|
|
|
|
|
|
|
|
0 |
|
|
|
|
|
|
|
|
|
|
1998 |
2000 |
2002 |
2004 |
2006 |
2008 |
2010 |
2012 |
2014 |
2016 |
2018 |
|
|
|
|
Fertilizer |
Fuel |
|
|
|
|
|
Charts and Price Projections: FAPRI 2009 Agricultural Outlook / 19
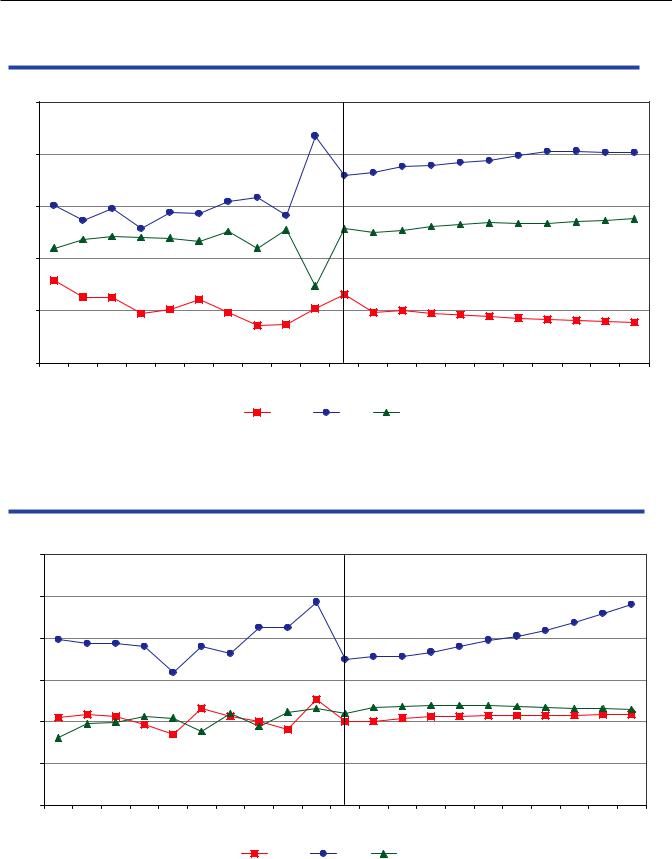
U.S. Cattle and Barrow and Gilt Prices
Dollars per cwt
120 |
|
|
|
|
|
|
|
|
|
|
100 |
|
|
|
|
|
|
|
|
|
|
80 |
|
|
|
|
|
|
|
|
|
|
60 |
|
|
|
|
|
|
|
|
|
|
40 |
|
|
|
|
|
|
|
|
|
|
20 |
|
|
|
|
|
|
|
|
|
|
0 |
|
|
|
|
|
|
|
|
|
|
1998 |
2000 |
2002 |
2004 |
2006 |
2008 |
2010 |
2012 |
2014 |
2016 |
2018 |

 Barrows and Gilts, Nat'l Base*
  NB Direct Fed Steers * National Base 51% - 52% Lean Equivalent
U.S. Poultry Wholesale Prices
Cents per Pound
100 |
|
|
|
|
|
|
|
|
|
|
90 |
|
|
|
|
|
|
|
|
|
|
80 |
|
|
|
|
|
|
|
|
|
|
70 |
|
|
|
|
|
|
|
|
|
|
60 |
|
|
|
|
|
|
|
|
|
|
50 |
|
|
|
|
|
|
|
|
|
|
40 |
|
|
|
|
|
|
|
|
|
|
1998 |
2000 |
2002 |
2004 |
2006 |
2008 |
2010 |
2012 |
2014 |
2016 |
2018 |
|
|
|
12-City Broiler |
|
Eastern Region Turkey |
|
|
|
|
20 / Charts and Price Projections: FAPRI 2009 Agricultural Outlook
U.S. Livestock Production
Billion Pounds
45 |
|
|
|
|
|
|
|
|
|
|
40 |
|
|
|
|
|
|
|
|
|
|
35 |
|
|
|
|
|
|
|
|
|
|
30 |
|
|
|
|
|
|
|
|
|
|
25 |
|
|
|
|
|
|
|
|
|
|
20 |
|
|
|
|
|
|
|
|
|
|
15 |
|
|
|
|
|
|
|
|
|
|
10 |
|
|
|
|
|
|
|
|
|
|
1998 |
2000 |
2002 |
2004 |
2006 |
2008 |
2010 |
2012 |
2014 |
2016 |
2018 |
|
|
|
|
Beef |
Pork |
|
Broilers |
|
|
|
U.S. Meat Net Exports
Billion Pounds
10 |
|
|
|
|
|
|
|
|
|
|
8 |
|
|
|
|
|
|
|
|
|
|
6 |
|
|
|
|
|
|
|
|
|
|
4 |
|
|
|
|
|
|
|
|
|
|
2 |
|
|
|
|
|
|
|
|
|
|
0 |
|
|
|
|
|
|
|
|
|
|
-2 |
|
|
|
|
|
|
|
|
|
|
-4 |
|
|
|
|
|
|
|
|
|
|
1998 |
2000 |
2002 |
2004 |
2006 |
2008 |
2010 |
2012 |
2014 |
2016 |
2018 |
|
|
|
|
Beef |
Pork |
Broilers |
|
|
|
|

Charts and Price Projections: FAPRI 2009 Agricultural Outlook / 21
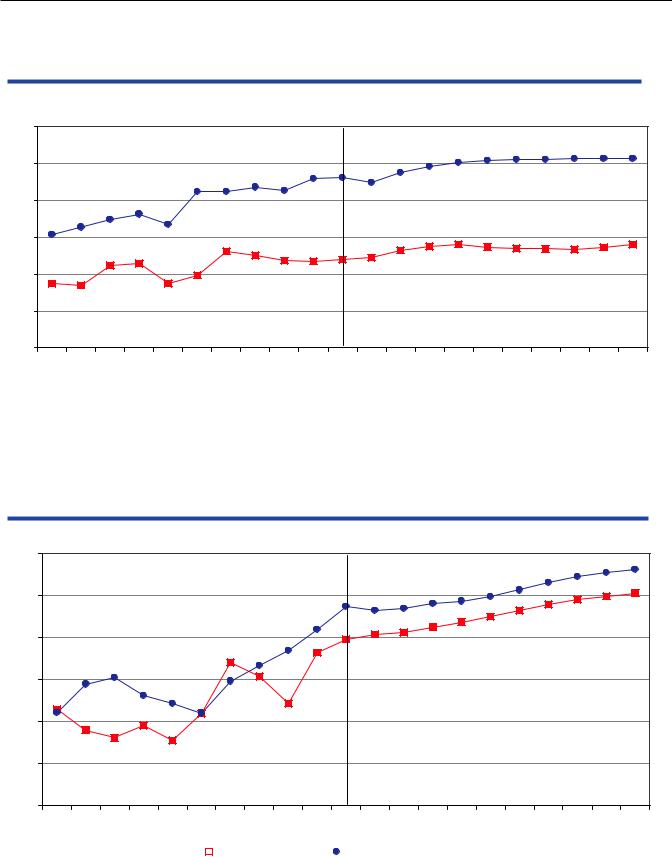
U.S. Milk Production
Billion Pounds
220 |
|
|
|
|
|
|
|
|
|
|
210 |
|
|
|
|
|
|
|
|
|
|
200 |
|
|
|
|
|
|
|
|
|
|
190 |
|
|
|
|
|
|
|
|
|
|
180 |
|
|
|
|
|
|
|
|
|
|
170 |
|
|
|
|
|
|
|
|
|
|
160 |
|
|
|
|
|
|
|
|
|
|
150 |
|
|
|
|
|
|
|
|
|
|
140 |
|
|
|
|
|
|
|
|
|
|
1998 |
2000 |
2002 |
2004 |
2006 |
2008 |
2010 |
2012 |
2014 |
2016 |
2018 |
U.S. Milk Prices
Dollars per cwt
20 |
|
|
|
|
|
|
|
|
|
|
18 |
|
|
|
|
|
|
|
|
|
|
16 |
|
|
|
|
|
|
|
|
|
|
14 |
|
|
|
|
|
|
|
|
|
|
12 |
|
|
|
|
|
|
|
|
|
|
10 |
|
|
|
|
|
|
|
|
|
|
8 |
|
|
|
|
|
|
|
|
|
|
1998 |
2000 |
2002 |
2004 |
2006 |
2008 |
2010 |
2012 |
2014 |
2016 |
2018 |
Class III |
Class IV |
All Milk |
22 / Charts and Price Projections: FAPRI 2009 Agricultural Outlook
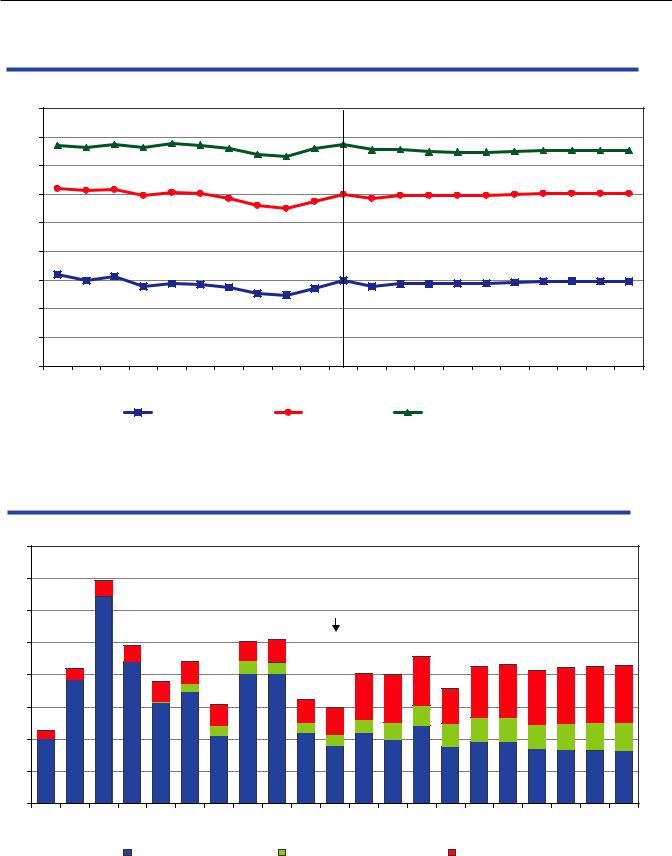
U.S. Land Use
Million Acres
380 |
|
|
|
|
|
|
|
|
|
|
360 |
|
|
|
|
|
|
|
|
|
|
340 |
|
|
|
|
|
|
|
|
|
|
320 |
|
|
|
|
|
|
|
|
|
|
300 |
|
|
|
|
|
|
|
|
|
|
280 |
|
|
|
|
|
|
|
|
|
|
260 |
|
|
|
|
|
|
|
|
|
|
240 |
|
|
|
|
|
|
|
|
|
|
220 |
|
|
|
|
|
|
|
|
|
|
200 |
|
|
|
|
|
|
|
|
|
|
1998 |
2000 |
2002 |
2004 |
2006 |
2008 |
2010 |
2012 |
2014 |
2016 |
2018 |
|
|
13 Crop Planted Area |
|
13 Crops + Hay |
|
13 Crops + Hay + CRP |
|
|
||
Mandatory U.S. Government Outlays, Fiscal Year
Billion Dollars
40 |
|
|
|
|
|
|
|
|
|
|
35 |
|
|
|
|
|
|
|
|
|
|
30 |
|
|
|
|
|
|
|
|
|
|
25 |
|
|
|
|
|
|
|
|
|
|
20 |
|
|
|
|
|
|
|
|
|
|
15 |
|
|
|
|
|
|
|
|
|
|
10 |
|
|
|
|
|
|
|
|
|
|
5 |
|
|
|
|
|
|
|
|
|
|
0 |
|
|
|
|
|
|
|
|
|
|
98/99 |
00/01 |
02/03 |
04/05 |
06/07 |
08/09 |
10/11 |
12/13 |
14/15 |
16/17 |
18/19 |
|
|
Net CCC Outlays |
NRCS Conservation |
Crop Insurance |
|
|
||||
Charts and Price Projections: FAPRI 2009 Agricultural Outlook / 23
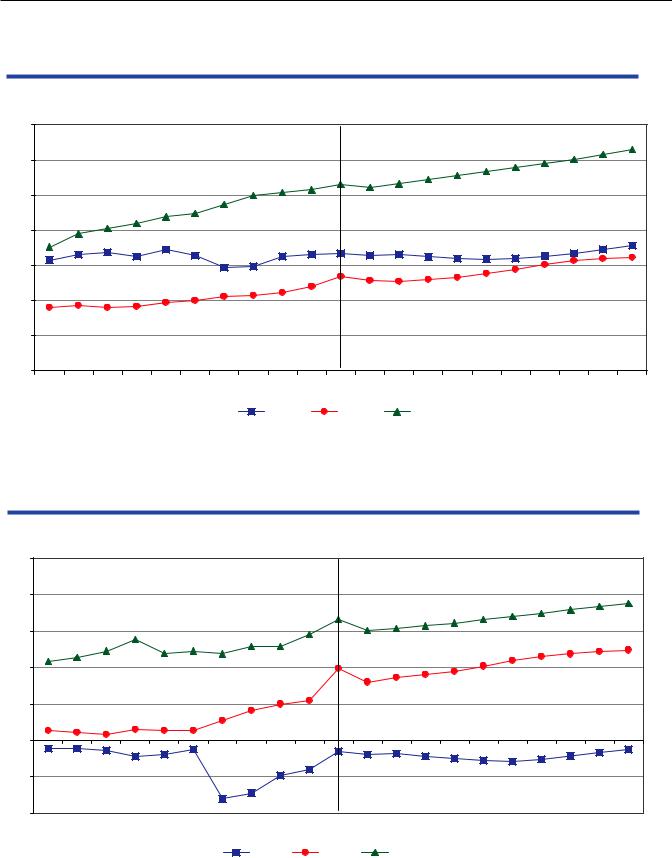
U.S. Farm Income
Billion Dollars
120 |
|
|
|
|
|
|
|
|
|
|
100 |
|
|
|
|
|
|
|
|
|
|
80 |
|
|
|
|
|
|
|
|
|
|
60 |
|
|
|
|
|
|
|
|
|
|
40 |
|
|
|
|
|
|
|
|
|
|
20 |
|
|
|
|
|
|
|
|
|
|
0 |
|
|
|
|
|
|
|
|
|
|
1998 |
2000 |
2002 |
2004 |
2006 |
2008 |
2010 |
2012 |
2014 |
2016 |
2018 |
|
|
|
|
Net Farm |
|
Real NFI (1997$) |
|
|
|
|
U.S. Consumer Price Index for Food
Percent *
6.0 |
|
|
|
|
|
|
|
|
|
|
5.0 |
|
|
|
|
|
|
|
|
|
|
4.0 |
|
|
|
|
|
|
|
|
|
|
3.0 |
|
|
|
|
|
|
|
|
|
|
2.0 |
|
|
|
|
|
|
|
|
|
|
1.0 |
|
|
|
|
|
|
|
|
|
|
0.0 |
|
|
|
|
|
|
|
|
|
|
1998 |
2000 |
2002 |
2004 |
2006 |
2008 |
2010 |
2012 |
2014 |
2016 |
2018 |
* Percentage increase in CPI for food vs. previous year.
24 / Charts and Price Projections: FAPRI 2009 Agricultural Outlook
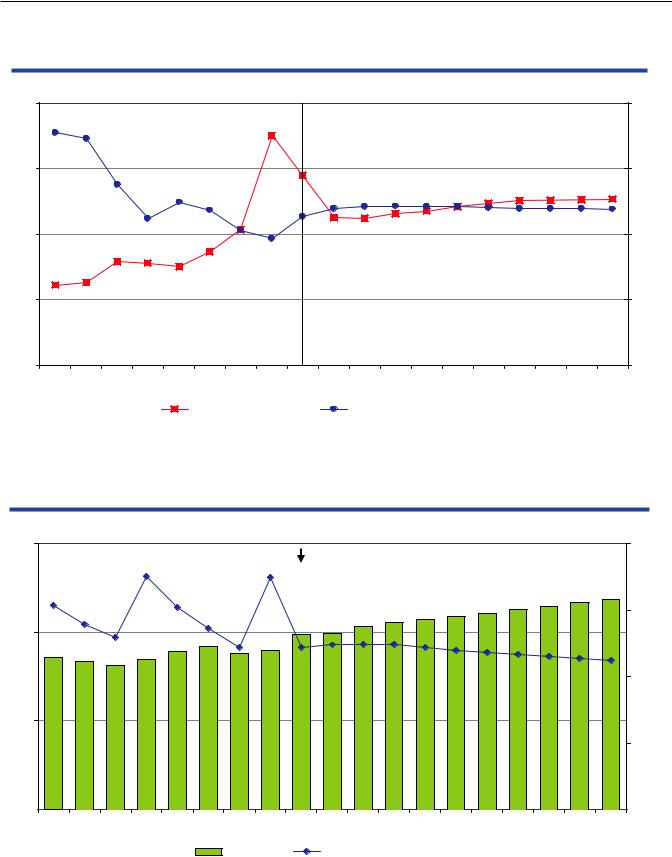
World Wheat Stocks-to-Use Ratio Versus Price
Dollars per Metric Ton |
|
|
|
|
|
|
|
Percent |
|
400 |
|
|
|
|
|
|
|
|
40 |
300 |
|
|
|
|
|
|
|
|
30 |
200 |
|
|
|
|
|
|
|
|
20 |
100 |
|
|
|
|
|
|
|
|
10 |
0 |
|
|
|
|
|
|
|
|
0 |
2000/01 |
2002/03 |
2004/05 |
2006/07 |
2008/09 |
2010/11 |
2012/13 |
2014/15 |
2016/17 |
2018/19 |
|
|
U.S. FOB Gulf Price |
Stocks-to-Use Ratio |
|
|
|
|||
World Wheat Net Trade and U.S. Market Share
Million Metric Tons |
Percent |
|
150 |
|
|
|
|
|
|
|
|
40 |
|
|
|
|
|
|
|
|
|
30 |
100 |
|
|
|
|
|
|
|
|
|
|
|
|
|
|
|
|
|
|
20 |
50 |
|
|
|
|
|
|
|
|
|
|
|
|
|
|
|
|
|
|
10 |
|
|
|
|
|
|
|
|
|
0 |
2000/01 |
2002/03 |
2004/05 |
2006/07 |
2008/09 |
2010/11 |
2012/13 |
2014/15 |
2016/17 |
2018/19 |
|
|
|
Net Trade |
|
U.S. Market Share |
|
|
|
|