

ЛЕКЦИИ ФШФС_2007 / НАШИ СТАТЬИ / JCTE477_РЭ_5_05_Англ
.pdfJournal of Communications Technology and Electronics, Vol. 50, No. 5, 2005, pp. 477–502. Translated from Radiotekhnika i Elektronika, Vol. 50, No. 5, 2005, pp. 517–551. Original Russian Text Copyright © 2005 by Zhigal’skii.
English Translation Copyright © 2005 by MAIK “Nauka /Interperiodica” (Russia).
REVIEW
Nondestructive Quality Control
of Integrated Circuits by Electrical Noise and Nonlinearity Characteristics
G. P. Zhigal’skii
Received September 14, 2004
Abstract—An overview is presented of different types of electrical noise in solids in relation to metal films, contacts, and transistors used in submicrometer IC technologies. Techniques are described for investigating nonequilibrium 1/f fluctuations in the conductance of one-port passive network whereby nonequilibrium flicker noise is extracted from total noise. A summary is presented of the work on harmonic distortions and equilibrium and nonequilibrium flicker noise in conducting thin films and different types of contacts. The physical principles are presented for nondestructive quality control by flicker noise and nonlinearity characteristics as applied to thin-film interconnections, ohmic contacts, Au/Cu thermocompression bonds, flip-chip solder bonds, MOS structures, and film resistors. It is shown that nonequilibrium flicker noise is more informative about the quality of passive parts (thin-film interconnections, film resistors, and contacts) as compared with equilibrium flicker noise. Fundamentals are set out for nondestructive quality control by the 1/f γ noise and nonlinearity characteristics of test IC elements, where γ is the frequency exponent. Experimental results are presented concerning the influence of metallization and ohmic-contact defects on LF current-consumption fluctuations in CMOS circuits, a phenomenon that might be employed in screening of very large-scale integrated circuits and systems.
INTRODUCTION
Reliability has become a major concern in the design of electronic systems containing hundreds of large-scale integrated circuits (LSICs) and very largescale integrated circuits (VLSICs); this is particularly true of ICs intended for long-term operation. Note also that the reliability of modern ICs is mainly determined by the quality of their passive constituent parts: interconnections, contact pads, resistors, vias, and dielectric films.
In microelectronics high-quality thin films of metals or alloys are widely used to make interconnections, resistors, and ohmic contacts. Interconnections and contacts experience high current densities and thermal stress during operation. These enhance different degradation processes, which gradually change the electrical characteristics of films and contacts until a sudden failure occurs. Investigations have revealed that interconnections and contacts are involved in most failures [1, 2]. It is therefore highly desirable to develop rapid nondestructive methods for the quality control of metal films and film and ohmic contacts. As the term is usually understood in relation to an IC, a nondestructive method is one that detects latent defects by indirect evidence while preserving the capabilities of the IC. An advantage of nondestructive quality control is that it can be readily incorporated into fabrication processes and product tests.
In recent decades, an approach has emerged whereby IC reliability is estimated by measuring the power spectral density (PSD) of flicker noise and the
nonlinearity of the current–voltage characteristic (CVC) for passive circuit parts (metal films, film and ohmic contacts, vias, solder bonds, MOS structures, etc.) [1–4]. Flicker noise is characterized by power spectral density varying as 1/f γ, where γ is a constant. The procedure is most effective if performed in process. Usually, nondestructive control methods are assumed to be the methods using indirect features for detection of latent defects without any changes in quality, parameters, and characteristics of the tested device. Nondestructive control offers some advantages over other control methods. It can be directly introduced into the IC manufacturing processes and test procedures. The most effective method is the IC quality control at the manufacturing stage that uses measurements of the PSD of the 1/fγ noise and nonlinearity parameters of CVCs of test structures for various types of passive components: metal films, film, and ohmic contacts, interconnections, soldered connections, metal–oxide– semiconductor (MOS) structures, etc. There is considerable experimental evidence that latent defects in and damage to passive circuit elements or interconnections can appear as elevated flicker noise. A related strategy is to measure fluctuations in current consumption. It applies to both finished ICs and a system as a whole.
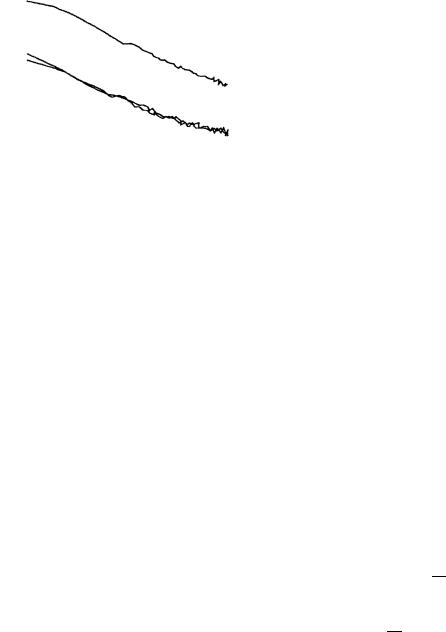
However, the reduction of latent-defect density due to advances in manufacturing technology has made dc measurements of 1/f noise inadequate for this purpose. The following example illustrates this point. Figure 1 shows the effect of annealing measured under a direct current of I0 = 3 mA on two different Ni–Cr film resis-
477
478 ZHIGAL’SKII
SV, V2/Hz |
|
|
|
|
tant types of noise in this case are thermal noise, shot |
||
10– 12 |
|
|
|
|
|
|
noise, generation–recombination noise, and 1/f noise. |
|
|
|
|
||||
|
|
|
|
|
|
Although generation–recombination noise and shot |
|
|
|
|
|
|
|
|
|
10– 13 |
|
|
1' |
|
|
noise are not found in metal films and ohmic contacts, |
|
|
|
|
|
|
these can exhibit a similar noise spectral density if fab- |
||
10– 14 |
|
|
|
|
|
|
ricated on the submicrometer level. The above types of |
|
|
|
|
|
|
||
|
1, 2 |
2' |
|
|
noise will be examined individually so that the reader |
||
10– 15 |
|
|
|
|
|
|
can gain an understanding of how electrical noise is |
|
|
|
|
|
|
|
produced in different constituent parts of modern ICs |
10– 16 |
|
|
|
|
|
|
(interconnections, resistors, contacts, vias, MOS struc- |
|
|
|
|
|
|
||
|
|
|
|
|
|
|
tures, etc.). |
10– 17 |
|
|
|
|
|
|
|
|
|
|
|
|
|
|
|
|
|
101 |
102 f, Hz |
||||
100 |
|||||||
1A. Thermal Noise
Fig. 1. Effect of annealing on two different Ni–Cr film resistors, R1 and R2, that originally displayed the same noise power spectral density. Measurements were performed under a direct current of 3 mA [4] for 420 h at an annealing temperature of 520 K. Curves 1 and 2 represent the power spectral densities for R1 and R2, respectively, before the annealing. Curves 1' and 2' refer to R1 and R2, respectively, after the annealing (dR/R = 0.04, dR/R < 0.005).
tors, R1 and R2, that have originally displayed the same power spectral density of 1/f noise [4]. The annealing temperature and duration were 520 K and 420 h, respectively. The heat treatment caused the 1/f noise in R1 to increase by two orders of magnitude and the resistance to deviate by 4%, indications of annealinginduced damage. The noise in R2 remained unchanged and the resistance drift was less than 0.5%. These indicate that two resistors with the same power spectral density of flicker noise observed under dc conditions may differ greatly in temperature stability. Thus, the strategy has to be modified.
This review begins with an overview of mechanisms underlying different types of electrical noise in metal films and contacts. An analysis is then given for theoretical and experimental results concerning equilibrium and nonequilibrium 1/f noise and the nonlinear behavior of the current–voltage characteristic (CVC) in the context of metal and alloy films, ohmic contacts, Auwire bonds to Cu contact pads, flip-chip solder bonds, and film resistors. This analysis provides the groundwork for a discussion of nondestructive quality control as applied to passive circuit parts. Measurement techniques are then examined for nonequilibrium flicker noise in one-port passive networks. The review also covers the characterization of CMOS LSICs and electronic systems by measured fluctuations in current consumption.
1.ELECTRICAL NOISE IN SOLIDS AND SOLID-STATE DEVICES
In solids there are several types of electrical noise that differ in nature and mathematical description. In solid-state electronics, major noise sources are resistors, contacts, diodes, and transistors. The most impor-
The thermal motion of free electrons in a conductor produces currents on a microscopic scale. At any point of time, the flow of electrons in one direction may be stronger than in the others, owing to the chaotic character of electron motion. As a result, the voltage across the conductor is subject to faint fluctuations, which depend on the conductor resistance R and temperature T. These fluctuations are known as thermal noise. As electrons travel over the conductor, they collide with ions at lattice sites; with lattice defects; and, more rarely, with one another. The electron velocity is estimated at 107 cm/s, even at room temperature. The corresponding collision rate is so high the current pulse produced by an electron has a duration as short as τ ~ 10–13 s. The fluctuating voltage is thus made up of numerous random pulses, and its power spectral density is flat over
frequencies up to fmax ≈ 0.5πτ ~ 1013 Hz. For this reason, thermal noise is characterized as white noise.
Thermal noise exists whether or not a direct current flows through the conductor. It depends on the atomic structure of the material, and its level is a function of R and T only.
At thermal equilibrium, the Nyquist noise theorem applies [1, 2]. With common operating temperatures, this theorem implies that the mean-square thermal-
noise voltage component U2T , measured in square volts, obeys the relation
U2T = 4kT ReZ∆f ,
where the overbar means averaging over time, k is the Boltzmann constant (k = 1.38 × 10⁻²³ J/K), T is the absolute temperature; Z is the conductor impedance (in ohms); and ∆f is the bandwidth of the circuit or instrument (in hertz).
In the case of a nonlinear CVC, the impedance must be replaced with the differential resistance at the operating point.
Note that the Nyquist noise theorem is true only for systems at thermal equilibrium. Furthermore, it applies only at frequencies f such that 2π f/kT 1, where is the Planck constant ( = 6.62 × 10⁻³²/2π J s). Otherwise,
JOURNAL OF COMMUNICATIONS TECHNOLOGY AND ELECTRONICS Vol. 50 No. 5 2005

NONDESTRUCTIVE QUALITY CONTROL OF INTEGRATED CIRCUITS |
479 |
the above equation must be modified to include quantum phenomena [1].
For a specimen of resistance R, the power spectral density of thermal noise is given by
ST |
UT2 |
= ------ = 4kTR. |
|
|
∆f |
1B. Hot-Electron (Diffusion) Noise
If a semiconductor is placed in a sufficiently strong electric field, its electron gas becomes a nonequilibrium system because the mean kinetic energy of electrons is raised above their thermal energy, 3/2kT. Electrons in this state are called hot electrons. With such fields, Ohm’s law fails and the current through the semiconductor varies in a nonlinear manner with field strength. The reason for such behavior is the electron mobility being a function of field strength. The Nyquist noise theorem does not apply in this case. Aside from thermal noise, the semiconductor plasma exhibits the noise associated with random electron–lattice energy transfer and with the fluctuating absorption of externally supplied power [1]. This type of noise is known as diffusion noise. Its power spectral density is also flat over a wide frequency range. Diffusion noise is the most common type of electrical noise in solids. With diffusion noise, dissipation occurs by fluctuations, whereas thermal noise is due to the fluctuations associated with the internal energy of the system. Diffusion noise can be used for device quality assessment in some cases.
1C. Shot Noise
Shot noise results from the discrete nature of electric charge. It is common in solid-state and vacuum electronics. Consider, for example, a vacuum diode in which electrons leave the cathode and hit the anode at random and independent points of time. If the diode is at saturation, every electron emitted will reach the anode to produce a current pulse through an external circuit, the pulse width being determined by the transit time τ. The resulting fluctuating component of anode current is given by the Schottky equation:
i2sh = 2eI0∆f ,
where I0 is the mean anode current (in amperes) [1, 2].
The spectrum of shot noise is bounded above by
1/2πτ.
In semiconductor devices, shot noise is generated by biased p–n junctions, and its level depends on the bias polarity and magnitude. Note that both majority and minority carriers contribute to shot noise, the contribution of the latter varying with operating conditions.
Current I through a semiconductor diode can be treated as consisting of two independent components:
the diffusion minority-carrier current Isat exp(U/ϕT) = I + Isat and the drift majority-carrier current Isat , where Isat is the saturation current, U is the applied voltage, and ϕT = kT/e. The two current components fluctuate independently to produce shot noise. At low frequencies, its power spectral density is as follows [5]:
Ssh = |
ish2 |
= |
U |
= 2e( I + 2Isat ) |
----- |
2eIsat exp ----- + 2eIsat |
|||
|
∆f |
|
ϕT |
|
(in A2/Hz).
In homogeneous conductors, shot noise is related to the drift velocity of carriers, whereas thermal noise is determined by their thermal velocity. In metals, shot noise is insignificant because the drift velocity is small compared with the thermal velocity.
From the preceding discussion, it should be clear that thermal and shot noise are inherent in electronic devices. They represent the minimum possible noise level.
1D. Generation–Recombination Noise
Generation–recombination noise occurs in semiconductors owing to fluctuations in free-carrier density as a result of fluctuating carrier recombination and generation via trapping levels, which are produced by impurities and lattice disturbances [1, 2, 5].
For a semiconductor that carries current I0 , the power spectral density of generation–recombination noise is given by
|
4I02 |
|
|
|
|
Sgr( f ) = |
∆ N2τ |
|
|||
------- |
-------------------- |
, |
|||
N02 |
1 + ω2τ2 |
||||
where N is the fluctuating total number of carriers in the semiconductor, N0 is the total number of carriers at
equilibrium, ∆N = N – N0, ∆ N2 is the averaged value of ∆N squared, τ is the carrier lifetime, f is the frequency, and ω = 2πf is the cyclic frequency [1, 5].
Assume that individual carriers are independent of
one another, and N is a Poisson variable. Then ∆ N2 = N0 [5]. Furthermore, we notice that the power spectral
density remains at Sgr0 = (4 I20 τ)/N0 for ωτ 1; if ω2τ2 1, the spectral density varies as 1/ω2, constituting the Lorentz profile. Lifetime τ can be found from frequency f0 such that Sgr( f0) = Sgr0/2, because τ = 1/2πf0 .
Metal films also exhibit a Lorentzian–Debye spectrum if vacancy sinks are distributed uniformly over the film and the probability of annihilation for any vacancy has a uniform distribution over any period within its lifetime. Such a fluctuation spectrum was observed by Celasco in Al films with a mean grain size of ~0.5 µm;
JOURNAL OF COMMUNICATIONS TECHNOLOGY AND ELECTRONICS Vol. 50 No. 5 2005
480 |
|
|
|
|
|
|
|
|
|
|
|
ZHIGAL’SKII |
|
||
|
|
|
|
|
|
|
|
|
|
|
|
|
noise spectral component. Assuming that fmin = 10–6 Hz, |
||
|
|
|
|
|
|
|
|
|
|
|
|
|
|||
|
|
|
|
|
|
|
|
|
|
|
|
|
we obtain τmax ≈ 1.6 × 10⁵ s ≈ 4 months. The minimum |
||
∆I |
|
|
|
|
|
|
|
|
|
value of τ may be taken as τmin = 1/2πfmax , where fmax is |
|||||
|
|
|
|
|
|
|
|
|
|
|
|
|
the maximum noise spectral component. |
||
|
|
|
|
|
t1 |
|
|
|
t2 |
|
A mechanism of 1/f noise in solids that would |
||||
|
|
|
|
|
|
|
|
|
|||||||
|
|
|
|
|
|
|
|
|
account for such a wide variation in relaxation time has |
||||||
|
|
|
|
|
|
|
|
|
|
|
|
|
yet to be identified. Existing models fall into two gen- |
||
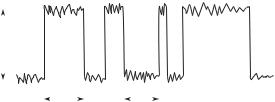
Fig. 2. Typical pattern of current RTS noise, on which white |
eral classes: time-independent and time-dependent. |
||||||||||||||
noise is superimposed. |
|
|
|
|
|
The former class is made up of equilibrium models that |
|||||||||
|
|
|
|
|
|
|
|
|
|
|
|
|
represent |
time-independent noise. Time-dependent |
|
it was attributed to thermally activated vacancies. |
models deal with transitions to thermal equilibrium and |
||||||||||||||
with aging. In general, 1/f noise is thought to be linked |
|||||||||||||||
Details are given in the review by Zhigal’skii [6]. |
with fluctuations in macroscopic system parameters. |
||||||||||||||
|
|
|
|
|
|
|
|
|
|
|
|
|
For metals and semiconductors, it is believed to be |
||
|
|
|
|
|
|
|
1E. 1/f Noise |
related to conductance fluctuations that exist indepen- |
|||||||
|
|
|
|
|
|
|
dently of current. In homogeneous media, conductance |
||||||||
This type of noise occurs in metal films, contact |
|||||||||||||||
fluctuations may result from fluctuations in the number |
|||||||||||||||
regions, and other passive and active circuit elements, |
and mobility of carriers, temperature fluctuations, dif- |
||||||||||||||
except for wire-wound resistors [1, 2, 5]. As the fre- |
fusion-induced changes in the lattice, solid-state chem- |
||||||||||||||
quency is decreased, the noise becomes progressively |
ical reactions, and creation and annihilation of micro- |
||||||||||||||
stronger and can ultimately outgrow the equilibrium |
scopic lattice defects. If 1/f noise does arise from con- |
||||||||||||||
thermal noise by up to three orders of magnitude. For |
ductance fluctuations (R = 1/G), its power spectral |
||||||||||||||
this reason, 1/f noise is sometimes called excess noise |
density should vary as applied direct current squared. |
||||||||||||||
despite the fact that it also includes generation–recom- |
Departure from the square-law relation may stem |
||||||||||||||
bination noise. Physically, 1/f noise is linked to fluctu- |
|||||||||||||||
from the voltage varying in a nonlinear manner with |
|||||||||||||||
ations in carrier mobility due to phonon scattering and |
|||||||||||||||
current, in which case nonequilibrium flicker noise is |
|||||||||||||||
is inherent in solids (see Section 2). |
|||||||||||||||
produced. Factors that contribute to conductance fluc- |
|||||||||||||||
Historically, 1/f noise was first detected in 1925 by |
|||||||||||||||
tuations in films and at interfaces will be discussed in |
|||||||||||||||
Johnson during his studies of oxide-cathode tubes. It |
|||||||||||||||
Section 2. |
|||||||||||||||
was attributed to slow random variations in emission |
|||||||||||||||
|
|
||||||||||||||
efficiency. The power spectral density of flicker noise is |
|
|
|||||||||||||
usually approximated by |
|
|
|
|
|
1F. Plosive or Random-Telegraph-Signal Noise |
|||||||||
|
|
|
|
|
|
|
|
|
|
|
|
|
|||
|
|
|
|
|
S( f , I) |
= K1 Iα / f γ , |
Random-telegraph-signal (RTS) noise switches |
||||||||
|
|
|
|
|
|
|
|
|
|
|
|
|
between two or more distinct levels as illustrated in |
||
where f is the frequency; I is the current; and K1, a, and |
Fig. 2, with randomly varying periods for which the |
||||||||||||||
current stays at each level [1, 2]. For a reverse-biased |
|||||||||||||||
γ are constants of the material [1, 2]. For films, a ≈ 2 if |
|||||||||||||||
p−n junction, RTS noise is thought to result from the |
|||||||||||||||
the current is sufficiently low to avoid local overheat- |
|||||||||||||||
random transitions of the surface between the conduct- |
|||||||||||||||
ing. In many cases, γ is close to unity: 0.8 ≤ γ ≤ 1.4 [6], |
|||||||||||||||
ing and |
nonconducting states. For a forward-biased |
||||||||||||||
hence the name 1/f noise. The frequency exponent can |
|||||||||||||||
junction, RTS noise is attributed to crystal defects at the |
|||||||||||||||
be evaluated by plotting a logarithmic graph of S(f) and |
|||||||||||||||
junction |
itself. Experimental evidence points to the |
||||||||||||||
finding the slope of the straight line as follows: γ = |
|||||||||||||||
defects being dislocations. |
|||||||||||||||
∆log10S/∆log10f. |
|
|
|
|
|
||||||||||
|
|
|
|
|
RTS noise is also found in submicrometer metal |
||||||||||
Almost all electronic |
|
materials and IC elements |
|||||||||||||
|
films and contacts containing moderate numbers of car- |
||||||||||||||
show 1/f γ fluctuations. In fact, these are also observed |
|||||||||||||||
rier scattering centers and vacancy sources and sinks. |
|||||||||||||||
in many natural systems, including biological ones. |
|||||||||||||||
For example, Caro [7] observed two-level mesoscopic |
|||||||||||||||
At frequencies higher than several kilohertz, 1/f |
|||||||||||||||
fluctuations of resistance in point contacts made from |
|||||||||||||||
noise is weaker than thermal and shot noise for many |
Au films of diameter 2a in the range 5–30 nm, the con- |
||||||||||||||
devices operated at ordinary levels of a current. How- |
tact resistance exceeding 10 Ω . The measurements |
||||||||||||||
ever, carbon resistors were found to display 1/f γ noise |
were made at a low bias voltage (≈50 mV) and a tem- |
||||||||||||||
over a frequency range as wide as 10–7–106 Hz [1, 6]. |
perature of ≈4.2 K. The contact radius was much |
||||||||||||||
There is experimental evidence that 1/f noise is caused |
smaller than the electron mean free path, so ballistic |
||||||||||||||
by processes with widely varying values of relaxation |
transport was achieved. The RTS noise had a Lorentz- |
||||||||||||||
time τ. Since the noise spectrum extends to very low |
ian spectrum, and the rate of transitions increased rap- |
||||||||||||||
frequencies, the underlying processes should occur on |
idly with bias voltage. The obtained data imply that the |
||||||||||||||
large timescales. The maximum value of τ may be esti- |
defects should have scattering cross sections on the |
||||||||||||||
mated as τmax = 1/2πfmin , where fmin is the minimum |
scale of an atom [7]. |
||||||||||||||
JOURNAL OF COMMUNICATIONS TECHNOLOGY AND ELECTRONICS Vol. 50 No. 5 2005
NONDESTRUCTIVE QUALITY CONTROL OF INTEGRATED CIRCUITS |
481 |
Yet another example is submicrometer field-effect transistors, in which RTS noise results from fluctuations in channel resistance due to migration of single carriers from the channel to oxide traps and back. The resulting current pulses, though low, can be used to explore the dynamics of carrier capture and emission by single traps, as well as to determine trap parameters. The noise becomes increasingly apparent as the feature sizes decrease.
Advances in submicrometer technology furthered research into RTS noise in semiconductor devices. A common mechanism was thus found to underlie three types of excess noise associated with carrier-density fluctuations. These are generation–recombination noise, flicker noise (the ∆n model) [1], and RTS noise. This last type predominates in nanoscale structures. As the size of a device increases, so does the number of traps, and RTS noise changes into noise with a 1/f spectral density. In metal films, the number of vacancy sources and sinks and, hence, quasi-equilibrium vacancy density increase with the minimum feature size. The vacancies have a wide range of activation energies, and fluctuations in their density produce noise with a 1/f spectral density (see Section 2B).
RTS noise is also found in the current consumption of digital CMOS circuits sustaining open faults in the metallization pattern or contact windows (see Section 6).
Like generation–recombination noise, RTS noise has a Lorentzian spectrum:
Sbur( f ) = |
Aτ0 I02 |
|
-------------------- |
, |
|
1 + ω2τ02 |
where A is a constant and τ0 is such that
1 |
1 |
1 |
---- = |
---- |
+ ----, |
τ0 |
τ1 |
τ2 |
in which τ1 and τ2 are the mean values of t1 and t2 , respectively, as shown in Fig. 2 [2]. For semiconductors, τ1 and τ2 refer to carrier capture and emission, respectively, by traps. For metal films and contacts, they refer to the creation and annihilation of vacancy defects.
2. PHYSICAL MECHANISMS OF 1/f NOISE AND NONLINEARITY OF CVCs
OF METAL FILMS AND CONTACTS
It is thought that 1/f noise in solids results from fluctuations in conductance. These fluctuations may also correspond to the absence of current in a specimen. Their equilibrium nature was shown by Voss and Clark [8] who made direct thermal-noise measurements on InSb films and Nb film islands in the absence of current. The noise was found to have a 1/f spectral density that remained unchanged on passing of current through the specimen, irrespective of the time pattern of the current (constant, sinusoidal, or pulsed). This is evidence that
the noise is due to equilibrium fluctuations in conductance. Let us call this type of 1/f γ fluctuation equilibrium flicker noise or equilibrium 1/f noise. It is characterized by a = 2 and, as a rule, γ ≈ 1.
Conducting films and contacts also display another type of noise, with a 1/f γ spectral density, if subjected to electric current, ionizing irradiation, deformation, etc. This is termed nonequilibrium flicker noise or nonequilibrium 1/f γ noise. Its power spectral density may vary as I2 , and γ is 2 or larger. An in-depth analysis of this type of noise was given by Zhigal’skii [9]. Equilibrium and nonequilibrium flicker noise can coexist.
Nonequilibrium flicker noise is more informative than equilibrium flicker noise because it can give clues about lattice disturbances and is very sensitive to latent defects. In many cases, it is the only source of such information. As an example, the noise can be useful for predicting the electromigration immunity of thin-film interconnections [4, 10, 11].
This section examines major types and mechanisms of equilibrium and nonequilibrium 1/f noise in metal films and contacts.
2A. Equilibrium 1/f Noise Due to Phonon Scattering
For equilibrium 1/f noise in metal films, Hooge and Hoppenbrouwers [12] proposed this empirical formula
S( f ) = |
SV ( f ) |
SR( f ) |
|
αH |
|
–1 |
|
|
V2 = |
R2 |
= |
--------- |
, Hz |
|
, |
(1) |
|
N0 f |
|
where V is the voltage across the specimen, R is the specimen resistance, SV( f ) and SR( f ) are the respective power spectral densities of fluctuations in V and R, αH = 2 × 10⁻³ is the Hooge constant, and N0 is the total number of carriers in the specimen. Furthermore,
N0 = ncVeff, |
(2) |
where nc is the carrier density and Veff is the effective volume of the specimen.
Equation (1) applies to structurally uniform films with a low density of mobile and fixed defects.
The noise described by Eq. (1) is commonly attributed to fluctuations in carrier mobility due to phonon scattering, whether or not a current flows through the specimen. In general, the phonon-scattering mechanism of equilibrium 1/f noise is supported by the fact that the noise level falls with a decreasing contribution of phonon scattering to the overall specimen resistance, as observed in semiconductor films doped with impurities of high ionization potential [13]. Equation (1) can be modified to apply to such semiconductors by replacing αH with
α = αH( µ/µalt )2, |
(3) |
where µ is the mobility influenced by carrier scattering from phonons, lattice defects, impurity atoms, and the
JOURNAL OF COMMUNICATIONS TECHNOLOGY AND ELECTRONICS Vol. 50 No. 5 2005
482 |
ZHIGAL’SKII |
surface [13, 14]. Phonon scattering and other factors can be characterized by their respective mobilities µlat and µdef such that
1 |
= |
1 |
+ |
1 |
. |
(4a) |
-- |
µ------lat |
µ-------def |
||||
µ |
|
|
|
|
The mobility-fluctuation model presumes that of the two constituent mobilities only µlat fluctuates. Accordingly,
δµ |
= |
|
µ |
2 |
δµlat, |
(4b) |
|
|
|
||||
|
|
|
------ |
|
|
|
|
|
|
µlat |
|
|
|
from which Eq. (3) follows [14]. Furthermore, αH = αlat = 2 × 10⁻³. The respective power spectral densities
Slat and S of fluctuations in µlat and µ obey the following relations [14]:
SR |
= |
S |
= |
α |
Slat |
αH |
(5) |
----- |
---- |
---------, |
------ |
= ---------. |
|||
R2 |
|
µ2 |
|
f N0 |
µlat2 |
f N0 |
|
Hooge parameter αH was evaluated experimentally for many semiconductor materials and metals, the values lying in the range 10–8 < α < 10–1 [6, 13].
More specifically, the phonon-scattering mechanism is presumed to consist in fluctuations in the cross section of acoustic-phonon scattering. Experiments by Musha [15] have shown that the intensity of light scattered by acoustic phonons in quartz indeed displays fluctuations with a 1/f spectral density. The number of acoustic phonons per mode is seen as the quantity that fluctuates. However, no model that yields an analytical expression for the phonon noise yet exists. Note also that the equilibrium 1/f noise described by Eq. (1) is inherent in solids and solid-state devices, as are thermal and shot noise.
The phonon-scattering noise component varies slowly with temperature, mainly owing to µlat being a function of temperature [12].
When the noise power spectral density varies as V2 and γ is close to unity, the dimensionless parameter
α = S------------------------V ( f ) N0 f |
(6) |
V2 |
|
is often used to evaluate the noise level [6]. The parameter enables one to compare the level of 1/f noise observed in an experiment with that of the noise to which Eq. (1) applies.
Phonon-scattering dissipation leads to a departure from Ohm’s law in metal films. If the sinusoidal current I(t) = I1 sin2πf1t is passed through a film, the resulting third voltage harmonic is given by
U3 = 0.25RT K2ρ0ρf( T )αf I13, |
(7) |
where RT is the thermal resistance; K = L/bh, with L, b, and h being the film length, width, and thickness,
respectively; ρ0 is the temperature-independent component of film resistivity; ρf(T) is the film resistivity as a function of absolute temperature T; and αf is the temperature coefficient of resistance for the film [6].
The equilibrium 1/f noise and nonlinear CVC associated with phonon scattering cannot indicate the presence of lattice defects and, thus, are unsuitable for nondestructive quality control.
2B. Equilibrium 1/f Noise Due to Vacancies
Zhigal’skii [6] developed a model of equilibrium 1/f noise that relates fluctuations in metal-film conductance or contact resistance to fluctuations in the number of quasi-equilibrium vacancies on the grounds that a relatively small amount of energy is required for their creation and migration. Again the mechanism works whether or not a current flows through the specimen.
Metal thin films tend to be structurally inhomogeneous. They contain different types of vacancy sources and sinks, which are distributed nonuniformly over the film. Vacancies arise and disappear under the action of lattice thermal vibrations. The energy of vacancy creation is specific to the type of vacancy source, because the number of bonds that must be broken for a vacancy to arise depends on where the atom is located [16]. The characteristic positions are grain boundaries, dislocations, asperities, pore walls, etc.
In reality, the lattice of a metal film is not at thermal equilibrium. Defects present in the film increase its free energy and act as vacancy sources and sinks. In doing so, they can change their position or size with time; for example, dislocations can migrate and pores can grow. The density of microscopic defects decreases under annealing. Furnace annealing can bring defects to a quasi-equilibrium state in which they are stationary or almost so. Every vacancy source can therefore be characterized by its quasi-equilibrium vacancy density [16]. At quasi-equilibrium, the 1/f noise due to fluctuations in the number of vacancies can be regarded as almost time-invariant. This is referred to as quasi-equilibrium 1/f noise.
A change in external conditions (temperature, current, mechanical stress, etc.) can drive the film and its 1/f noise away from equilibrium [9].
At thermal equilibrium, the respective rates of vacancy creation and annihilation are equal, so the mean vacancy density is time-independent. Vacancy lifetime τvac in a film is given by
τvac = |
Lvac2 |
|
|
--------------- |
, |
(8) |
|
π2 Dvac |
where Lvac is the distance between vacancy sinks and Dvac is the vacancy diffusion coefficient [16].
The set of the vacancy lifetimes is related to the distribution of the activation energy for vacancy diffu-
JOURNAL OF COMMUNICATIONS TECHNOLOGY AND ELECTRONICS Vol. 50 No. 5 2005
NONDESTRUCTIVE QUALITY CONTROL OF INTEGRATED CIRCUITS |
483 |
sion [16, 17] and to the distribution of Dvac . The activation energy and Lvac are subject to random variation over the bulk of the film. The random nature of the diffusion activation energy stems from the multiplicity of structural imperfections. In practicable metal films, the spatial variation of vacancy-sink density produces a wide variety of relaxation times, so that the resulting 1/f noise should occupy a wide frequency range [6, 18]. At quasi-equilibrium, vacancy creation is sustained by the internal energy of the crystal; this process is of a statistical nature. As vacancy creation involves defects with widely differing activation energies, the wideband character of the noise can be explained by the simultaneous action of many relaxation stochastic processes [19, 20].
The review by Zhigal’skii [6] demonstrates the existence of a wide range of relevant activation energies in Mo films. It also sets out physical reasons for the wide ranges of activation energies for creation and annihilation of quasi-equilibrium vacancies in metal films. Reasons are also given for widely differing relaxation times. As a result, 1/f noise in the range ≈4 × 10⁻⁹ to ≈1010 Hz is explained.
Potemkin et al. [18] found that the noise power spectral density can be written as
Svac0 = KU20∆n2vac0/ f = KU02nvac0/Na f , V2/Hz. (9a)
Here, K is a constant of the metal film and nvac0 is defined as nvac0 = Nvac0/N‡ , where Nvac0 is the tempera- ture-dependent number of quasi-equilibrium vacancies
and N‡ is the number of atoms in the film.
Equation (9a) applies to the noise produced by the simultaneous action of relaxation processes relating to creation and annihilation of quasi-equilibrium vacancies [9, 18]. It is derived by the well-known summation technique for relaxation processes differing in charac-
teristic time [19, 20] and assumes that ( ∆ Nvac0 )2 =
Nvac0 [5]. Consequently, ∆n2vac0 = nvac0/N‡.
According to Ohm’s law the fall in voltage in a film is expressed as U0 = RI0 , where I0 is a direct current and R is the resistance of the film. We substitute U0 = RI0 into Eq. (9a) to obtain
Svac0 = |
K1 I02nvac0/N‡ f , V2/Hz, |
(9b) |
where K1 = KR2. |
|
|
As is known [17, 21], |
|
|
nvac0 |
= A exp[ –( Evac/kT ) ], |
(10) |
where the preexponential factor A is related to entropy [17] and Evac is the activation energy of vacancy creation. For films, A can be much greater than unity [6].
The vacancy model is supported by a considerable amount of experimental data on the effects of different factors on noise level; these factors include annealing, aging, internal stress, and temperature [6]. An important piece of evidence is a connection between noise level and the third-harmonic distortion, which was found by both measurement [6] and calculation [22, 23].
Equations (9a), (9b), and (10) show that the noise spectral density obeys the Arrhenius equation, in which the activation energy Evac corresponds to vacancy creation at grain boundaries, micropore walls, and other lattice defects. In many experiments, Evac has been found to be equal to the work required for breaking one or two bonds [6].
Dissipation due to quasi-equilibrium vacancy scattering produces the third-harmonic distortion. If the sinusoidal current I(t) = I1 sin2πf1t is passed through a film, the resulting third harmonic of voltage has the amplitude
U3 = 0.25RT K2ρ01ρf( T )
(11)
× [ αf + ( AA1 Evac/kT20ρ01 ) exp( Evac/kT0 ) ] I31,
where A1 is a constant [22, 23].
The vacancy-induced noise and the voltage–current nonlinearity can be useful for nondestructive detection of defects in and damage to metal films and contacts.
2C. Nonequilibrium 1/f Noise in Metal Films and Contacts
If direct current I0 is passed through a practicable one-port passive network, circuit resistance R will vary in a random manner with time and in a nonlinear manner with current. Let us express the dependence as
R(I0, t) = R0(t) + N(I0, t), |
(12) |
where R0 is independent of I0 and N(I0, t) = 0 when I0 = 0 [24].
The nonlinear term R(I0, t) may be approximated in different ways. With a polynomial approximation containing k + 1 terms, Eq. (12) becomes
k |
|
R( I0, t) = R0( t) + ∑ Rn( t) I0n, |
(13) |
n = 1
where Rn are independent of n (n = 1, 2, …, k) [25, 26].
The individual terms of the polynomial represent different mechanisms of carrier transport and scattering. These mechanisms include scattering from phonons and mobile vacancies, which are responsible for the third-order term [6]. The classical and tunnel transport across grain boundaries or contacts are also relevant [1, 27, 28].
JOURNAL OF COMMUNICATIONS TECHNOLOGY AND ELECTRONICS Vol. 50 No. 5 2005

484 |
ZHIGAL’SKII |
It is easily seen that fluctuations in R0 correspond to equilibrium noise (i.e., the one independent of current), whereas fluctuations in Rn (n = 1, 2, 3, …) represent the nonequilibrium noise induced by current I0 .
For industrial applications, it may be advantageous to employ a simpler approximation:
R( I0, t) = R0( t)[ 1 + ZI0β – 1 ], |
(14) |
where Z and β are constants that characterize the nonlinear CVC [24].
With both approximations, the relationship between voltage V across the circuit and current I through it can be written as
V(I, t) = R(I, t)I = R0(t)I + N(I, t)I, |
(15) |
where N(I, t) is a nonlinear function of I. Note that I consists of a dc and an ac component in the general case.
The magnitude of the nonlinearity may be measured
by the dimensionless ratio |
|
KN = N( I)/R0, |
(16) |
where N(I) and R0 are obtained by averaging N(I, t) and R0(t), respectively, over time.
As in [24], the nonlinearity will be regarded low if
N(I, t) R0(t). |
(17) |
If N(I, t) and R0(t) are uncorrelated, the power spectral density SV( f ) of voltage flicker noise for a given I0 is in general expanded as
SV ( I0, f ) = SRL( f ) I02 + SRN( I0, f ) I02, |
(18) |
where SRL( f ) and SRN(I0, f ) are the power spectral densities relating to the linear and nonlinear resistance components, respectively. Accordingly, the first and second right-hand summands of Eq. (18) correspond to equilibrium and nonequilibrium resistance fluctuations, respectively.
Under dc conditions the two spectral densities cannot be measured individually, which prevents us from extracting the nonequilibrium noise component. At low I0 , nonequilibrium 1/f noise tends to be buried under equilibrium noise (this is often the case with high-qual- ity metal films when the current density is less than 106 A/cm2).
As metal films and ohmic contacts do not deviate greatly from Ohm’s law, Rn should decrease rapidly with an increase in n; furthermore, we can assume that
R0 Rn for all n at normal operating |
currents. |
Accordingly, we neglect Rn with n > 2 to obtain |
|
V ( t) = R0( t) I0 + R1( t) I02 + R2( t) I03, |
(19) |
so that
∆V ( t) = ∆ R0( t) I0 + ∆ R1( t) I20 + ∆ R2( t) I30, (20)
where ∆V(t) = V(t) – V and ∆Rn(t) = Rn(t) – Rn (n = 0,
1, 2) represent fluctuations in V and Rn from their respective mean values.
If R0(t), R1(t), and R2(t) fluctuate in an uncorrelated manner,
SV ( I0, f ) = SR0( f ) I20 + SR1( f ) I40 + SR2( f ) I60, (21)
where SR0, SR1, and SR2 are the respective power spectral densities of the fluctuations in R0, R1, and R2 (see Eq. (19)).
We see that under nonequilibrium conditions the noise spectral density as a function of current deviates from a square-law relationship, especially at high currents. At low currents one can observe only equilibrium flicker noise corresponding to the first right-hand term of Eq. (21).
Conducting films and contacts display different types of nonequilibrium flicker noise with specific mechanisms [9]. The noise may or may not vary with time, depending on external conditions and the microstructure of the film. Below we shall briefly discuss experimental results concerning nonequilibrium flicker noises in metal films and contacts; more details can be found in [9].
Some types of nonequilibrium flicker noise have γ ≥ 2, whereas other types have γ close to unity. In metal films, current-induced flicker noise can be produced
(i) by vacancy creation due to dissipation throughout the film or at local inhomogeneities or (ii) by migration of metal atoms along grain boundaries or over the whole lattice. The first type of noise does not change with time, whereas the second type is time-dependent. This is known as electromigration noise.
With oxide or nitride inclusions at grain boundaries or contacts, a third type of nonequilibrium flicker noise may arise owing to nonmetallic conduction mechanisms, although these contribute insignificantly to the net resistance. The noise is time-independent. This is observed in Mo films with oxidized grain boundaries, which have been deposited at a low rate [25, 29].
Nonequilibrium 1/f γ noise also occurs in films whose structure is not at thermal equilibrium; furthermore, it can be produced by ionizing irradiation or deformation [9].
Let us now consider the case of vacancy creation by dissipation [9]. As the current is increased, the film temperature and the number of nonequilibrium vacancies increases. Once this exceeds the equilibrium number of vacancies for room temperature, as given by Eq. (10), nonequilibrium flicker noise will become stronger than equilibrium flicker noise [9, 26], so that the power spec-
JOURNAL OF COMMUNICATIONS TECHNOLOGY AND ELECTRONICS Vol. 50 No. 5 2005
NONDESTRUCTIVE QUALITY CONTROL OF INTEGRATED CIRCUITS |
485 |
|
SV, arb. units |
SV, arb. units |
|
1 |
10– 11 |
|
104 |
|
|
2 |
|
|
|
|
2 |
102 |
10– 13 |
|
|
|
|
|
|
|
|
|
|
|
|
|
|
|
|
|
|
|
|
|
|
|
|
|
|
|
|
|
|
|
|
|
|
|
|
|
|
|
|
|
|
|
|
|
|
|
|
|
|
|
|
|
|
|
|
|
|
|
|
|
|
|
|
|
|
|
|
|
|
|
|
|
|
|
|
|
|
1 |
|
|
|
|
|
|
100 |
|
|
|
|
|
|
|
|
|
|
|
|
|
|
|
10– 15 |
|
|
|
|
|
|
|
|
|
|
|
|
|
|
|
|
|
|
|
|
|
|
|
|
|
|
|
|
|
|
|
|
|
|
|
|
|
||
0 |
1 |
2 |
4 |
8 10 |
0.2 |
0.5 |
1.0 |
2.0 |
5.0 |
||||||||||||||||||
|
|
|
|
|
|
|
|
|
|
|
I, mA |
|
|
|
|
|
|
|
|
|
|
I, mA |
|||||
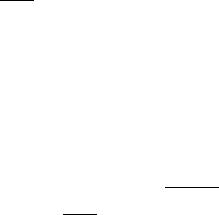
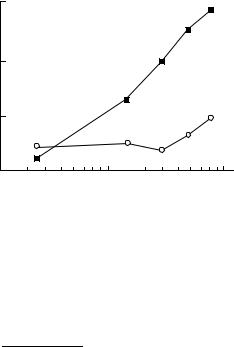
Fig. 3. Power spectral density of current-induced 1/f noise vs. direct current for a Cr film having an elevated vacancy density, the film being 160 nm thick and 0.37 mm wide [26]. Curves 1 and 2 are obtained at 2 and 5 Hz, respectively.
Fig. 4. Power spectral density of current-induced 1/f noise vs. direct current for Ni–Cr films with R = 500 Ω at T = 300 K [4]. Curves 1 and 2 correspond to n = 2 and 4.5, respectively.
tral density of 1/f γ noise will be governed by the second |
Figure 4 displays the noise–current characteristic |
|||
right-hand term of Eq. (21). |
for Ni–Cr films [4]. The noise can be represented as |
|||
Figure 3 shows how the power spectral density of 1/f |
SV I0n . If I0 < 1.75 mA, n ≈ 2; otherwise, n = 3.5 to |
|||
noise varies with direct current in a Cr film having an |
4.5. Furthermore, γ = 1.3 for I0 = 0.5 to 3.0 mA at T = |
|||
elevated vacancy density [26]. The vacancy-creation |
300 K. |
|
|
|
mechanism in this case is supported by the fact that the |
To summarize, the above results for Cr, Ni–Cr, and |
|||
noise power spectral density as a function of tempera- |
||||
Al–Cu films are |
evidence for |
the vacancy-creation |
||
ture obeys the Arrhenius equation with an activation |
||||
mechanism of nonequilibrium flicker noise at high cur- |
||||
energy of Evac = 0.6 eV (at 35 Hz). Note that the |
||||
rent densities. The noise power spectral density as a |
||||
observed noise level is four to five orders of magnitude |
||||
function of temperature obeys the Arrhenius equation, |
||||
greater than that given by Eq. (1) with the carrier den- |
||||
and the noise–current relationship has the form SV j04 |
||||
sity taken as nc = 1.7 × 1022 cm–3 [26]. |
||||
Figure 3 indicates that SV In, in which n varies |
at high currents. This type of nonequilibrium flicker noise |
|||
is characterized by γ in the range 1.0–1.3 [4, 26, 30]. |
||||
with current density j. It has been found that n ≈ 2 if j < |
|
|
|
|
3 × 10³ A/cm2 and n ≈ 4 if j > 104 A/cm2 . At low cur- |
|
|
|
|
rents the flicker noise is due to fluctuations in the num- |
logSV |
|
|
|
ber of quasi-equilibrium vacancies (the noise is repre- |
– 13 |
|
|
|
sented by SR0( f ) in Eq. (21)). As the current is |
1 |
|
||
|
|
|||
increased, the nonequilibrium flicker noise will ulti- |
|
|
|
|
mately outgrow the equilibrium flicker noise (see |
|
|
|
|
above) [26]. |
|
|
|
|
Similar forms of the noise–current relationship were |
– 14 |
2 |
|
|
observed in Ni–Cr thin films with resistance of 500– |
|
|
||
|
|
|
||
4000 Ω [4] and in Al–Cu thin films (20 wt % Cu) depos- |
|
3 |
|
|
ited on preoxidized Si substrates by vacuum evapora- |
|
|
||
|
|
|
||
tion (the films were 1.3 mm long, 20 µm wide, and |
– 15 |
|
|
|
300 nm thick) [30]. In the Al–Cu films, the noise power |
|
|
||
|
|
|
||
spectral density obeys to reasonable accuracy a square- |
|
|
|
|
law relationship at j0 ≤ 2.1 × 10⁶ A/cm2; when j0 = (2.1– |
10.3 |
10.5 |
10.7 |
|
3.2) × 106 A/cm2 , the spectral density behaves as j04 . |
|
|
log j |
|
The noise is also characterized by γ in the range 1.07– |
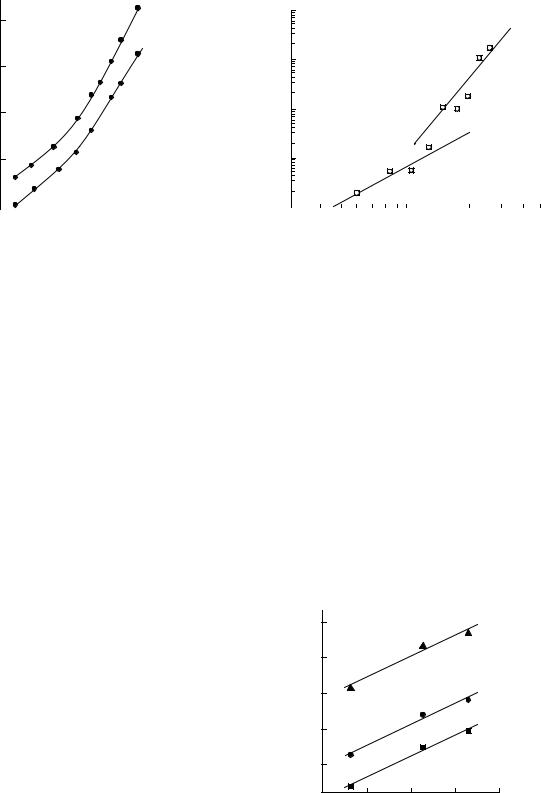
Fig. 5. Current-density dependence of 1/f 2 noise observed |
|||
1.22 (±0.05). |
in Al–Si(1%) films at (1) 485, (2) 500, and (3) 530 K [11]. |
|||
JOURNAL OF COMMUNICATIONS TECHNOLOGY AND ELECTRONICS Vol. 50 No. 5 2005
486 |
|
|
|
|
ZHIGAL’SKII |
||
|
S /R2 × 1014, Hz– 1 |
|
|
The nonequilibrium-noise spectral densities SR1 and |
|||
|
R |
|
|
|
SR2 , which appear in Eq. (21), provide clues about dif- |
||
|
101 |
|
|
|
|||
|
|
|
|
|
|
ferent types of latent defects in contacts, interconnec- |
|
|
|
|
1 |
|
tions, vias, and film resistors. |
||
|
|
|
|
It is seen from Eq. (21) that the noise spectral den- |
|||
|
100 |
|
|
|
|||
|
|
|
|
sity measured under dc conditions covers both an equi- |
|||
|
|
|
|
|
|
||
|
|
|
|
|
|
librium and a nonequilibrium noise component. These |
|
|
|
|
|
|
|
differ in magnitude and depend on measurement condi- |
|
|
10 |
– 1 |
|
|
2 |
tions (current and temperature) and specimen micro- |
|
|
|
|
|
structure (grains, inclusions, etc.). Note that the non- |
|||
|
|
|
|
|
|
||
|
|
|
|
|
|
equilibrium component is often buried under the equi- |
|
|
10– 2 |
|
|
|
librium component, although the former can be |
||
|
100 |
|
101 |
stronger than the latter if the current density is suffi- |
|||
|
|
10– 1 |
|
ciently high. Nevertheless, experimental techniques are |
|||
|
|
|
I02, MA2 cm– 4 |
||||
|
|
|
available that enable extraction of the nonequilibrium |
||||
Fig. 6. SR/R2 vs. dc density squared for Al–Cu films (1) with |
noise component; see Section 2 for details. |
||||||
A final point: Although the established practices in |
|||||||
and (2) without electromigration-induced damage [26]. |
|||||||
|
|
|
|
|
|
nondestructive quality control tend to treat the two |
|
If there is correlation between ∆Rn(t) (n = 0, 1, 2) in |
types of flicker noise indiscriminately, it should be rec- |
||||||
ognized that the nonequilibrium flicker noise is often |
|||||||
Eq. (20), the right-hand side of Eq. (21) must in general |
more informative. |
||||||
be modified to include a thirdand a fifth-degree term |
|
||||||
in I0 . If, for example, ∆R0(t) and ∆R1(t) are correlated, |
2D. Electromigration 1/f 2 Noise |
||||||
|
|
|
3 |
|
|
||
SV(I) ∆ R0( t)∆ R1( t) I0 . Indeed, Neri et al. [11] |
|
||||||
observed a cubic noise–current relationship for elec- |
Electromigration 1/f 2 noise is unique among the |
||||||
tromigration 1/f 2 |
noise in Al–Si films, as shown in |
types of nonequilibrium flicker noise in that it is used |
|||||
Fig. 5. |
|
|
|
|
for predicting the immunity of thin-film interconnec- |
||
If a film has an imperfect crystal structure or con- |
tions to electromigration. It has received the most atten- |
||||||
tion in the literature. |
|||||||
tains nonuniformly distributed impurities, its sheet |
|||||||
|
|||||||
resistance is also nonuniform, with the result that the |
Electromigration 1/f 2 noise is found in films of alu- |
||||||
film conductance will show nonequilibrium fluctua- |
minum or its alloys at elevated temperatures and high |
||||||
tions associated with overheating at sites of elevated |
currents [2, 9–11, 31–36]. It is attributed to atomic |
||||||
current density (j |
> 106 A/cm2), where intense creation |
migration along grain boundaries or over the lattice [10, |
|||||
|
|
0 |
|
|
11, 37, 38]. As the applied current is increased, γ grows |
||
of mobile lattice defects (predominantly vacancies) |
|||||||
occurs. The resulting voltage noise should have a value |
from 1 to more than 2. For example, Diligenti et al. [34] |
||||||
of S |
~ I4 . |
|
|
|
reported γ = 2 to 2.6 as measured on Al and Al–Si films |
||
V |
|
0 |
|
|
|
at j0 = (1.3–2.5) × 106 A/cm2 in the temperature range |
|
The above mechanism was identified in metal films |
320–410 K. |
||||||
|
|||||||
with electromigration-induced damage [26]. Figure 6 |
To detect electromigration noise under dc condi- |
||||||
presents a graph of SR/R2 against I02 for Al–Cu films |
|||||||
tions, measurements of power spectral density should |
|||||||
with and without such damage. For the fault-free film, |
be conducted at a frequency range below 1 Hz |
||||||
(0.01−1.00 Hz in most cases) in order to reduce inter- |
|||||||
we notice that with increasing j0 the noise spectral den- |
|||||||
ference by equilibrium 1/f noise. In annealed and undis- |
|||||||
sity remains almost the same, while j |
|
< 2 MA/cm2 , |
|||||
0 |
turbed (e.g., unstrained) metal films, this noise compo- |
||||||
implying that SV I02 . The noise is low and α = 8 × 10⁻³ |
nent is associated with fluctuations in carrier mobility |
||||||
as calculated by Eq. (6) with carrier density nc taken as |
due to scattering by the lattice or quasi-equilibrium |
||||||
vacancies. The noise is time-independent. By contrast, |
|||||||
1.8 × 1023 cm–3 [26]. In fact, nonequilibrium flicker |
|||||||
electromigration noise is produced by transport of the |
|||||||
noise is not detected while j0 < 2.2 MA/cm2 whether at |
|||||||
material toward sinks of different types in the bulk of the |
|||||||
room temperature or at 523 K. In the presence of dam- |
film (lattice diffusion) or by transport along grain bound- |
||||||
age, |
the relative |
noise spectral density |
varies as I02 |
aries (grain-boundary diffusion); either process leads to |
|||
(Fig. 6, curve 1), implying SV I04 . This indicates that |
irreversible structural changes in the film [1, 37]. Elec- |
||||||
tromigration noise is inherently time-dependent. With a |
|||||||
nonequilibrium flicker noise is produced by the above |
fixed j0 , its power spectral density grows with tempera- |
||||||
mechanism. |
|
|
|
ture and γ reaches 2 [10]. |
|||
JOURNAL OF COMMUNICATIONS TECHNOLOGY AND ELECTRONICS Vol. 50 No. 5 2005