

ЛЕКЦИИ ФШФС_2007 / НАШИ СТАТЬИ / JCTE334 Galchenko 2000
.pdfJournal of Communications Technology and Electronics, Vol. 45, No. 3, 2000, pp. 334–338. Translated from Radiotekhnika i Elektronika, Vol. 45, No. 3, 2000, pp. 362–366. Original Russian Text Copyright © 2000 by Gal’chenko, Zhigal’skii.
English Translation Copyright © 2000 by MAIK “Nauka /Interperiodica” (Russia).
PHYSICAL PROCESSES
IN ELECTRON DEVICES
Diagnostics of Large-Scale Integrated Circuits Based on Complementary Metal–Oxide–Semiconductor
Structures Using LF Fluctuations
of the Consumption Current
V. R. Gal’chenko and G. P. Zhigal’skii
Received September 23, 1999
Abstract—LF fluctuations of the consumption current in 537RU6 and 1617RU6 large-scale integrated circuits (LSICs) based on complementary metal–oxide–semiconductor (CMOS) structures are experimentally investigated in the frequency band 1–2 kHz for developing a nondestructive quality control method. The spectral density of the consumption current fluctuations of these microcircuits (MCs) depends on frequency as 1/fγ , where, for different MCs of the test sample, the exponent of the spectrum is γ ≈ 0.9–1.2. It is shown that LF current fluctuations in the LSIC supply circuit serve as an informative parameter of MC quality and can be used for detecting and identifying latent defects. Since LSICs exhibiting high-intensity current fluctuations in the supply circuit contain latent local defects, they should be categorized as potentially unreliable. We recommend diagnosing integrated MCs by controlling the level and behavior of the LF current fluctuations in the supply circuit.
INTRODUCTION
One of the most pressing problems of modern microelectronics is improving the reliability of integrated microcircuits (IMCs). Standard methods of electrophysical control are not sensitive enough to provide the on-line detection of latent defects in the structural components of large-scale integrated circuits (LSICs) implemented in complementary metal–oxide–semi- conductor (CMOS) technology. Therefore, it is necessary to develop new efficient methods of microcircuit (MC) diagnostics which identify individual IMCs with potentially unreliable and unstable electric characteristics. In the last few years, nondestructive quality control of various electronic devices has been performed by measuring the excess (1/f) noise [1–5]. Numerous experiments demonstrate that the excess noise produced by passive and active elements of electronic devices and integrated circuits (ICs) increases when devices contain latent defects or damages. These defects of metal–oxide–semiconductor (MOS) ICs include microdefects of silicon or SiO2 crystal lattice, dislocations, ionic impurities, traps, surface states, etc., and macrodefects of different sorts, such as scratches, cracks, topological disturbances, thickness inhomogeneities of metal and dielectric layers (especially on the oxide steps), strains in thin films [6], and so on.
Measurements of the 1/f noise in MOS transistors [2, 7, 8] and CMOS digital ICs [9, 10] performed to evaluate the quality of these devices demonstrate the high sensitivity and efficiency of this method. For example, the estimate of the 1/f noise level in MOS transistors measured before the radiation treatment
enables one to predict the radiation resistance of these devices to the threshold-voltage drift [2]. The diagnostics of the 564 complementary metal–dielectric–semi- conductor (CMDS) IC using the LF noise of MOS transistors integrated in this MC are described in [10]. It is found that the noise level increases with the radiation dose, the rate of this increase being greater for MOS transistors that exhibit a higher spectral density (SD) of the noise power before the radiation treatment.
In this paper, LF fluctuations of the consumption current in 537RU6 and 1617RU6 CMOS LSICs are experimentally investigated. These investigations are aimed at developing a method of nondestructive quality control of similar devices using the level and behavior of observed fluctuations.
TEST SAMPLES
AND INVESTIGATION TECHNIQUE
We investigate 537RU6 and 1617RU6 RAM CMOS LSICs that are regularly produced. For the experiments, we choose LSIC samples satisfying the performance criterion according to the specification. The 537RU6 and 1617RU6 LSICs are static memory MCs implemented in the CMOS technology. Since, during the measurements of the LF noise and consumption current, the resolution signal input is commuted, its state
can be CE = 0 or CE = 1. When CE = 0 or CE = 1, the MC operates in the active and information storage modes, respectively. The rest of the LSIC pins are connected to the common bus; i.e., in the process of measurements, they are in the logical-zero state. For each
334
DIAGNOSTICS OF LARGE-SCALE INTEGRATED CIRCUITS |
335 |
MC under control, the SD of LF fluctuations of the LSIC consumption static current is recorded at supply voltage Ucc , which takes different values in the range from 4.0 to 6.0 V and does not exceed the overload capacity. The supply voltage varies discretely with a 0.5-V step. The static-mode consumption current is monitored at Ucc = 3.0 and 5.0 V according to the technique of the performance specification.
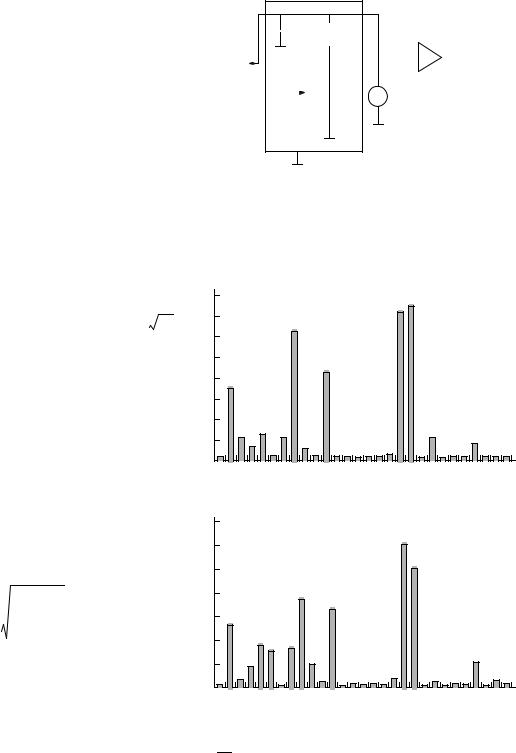
Figure 1 displays the circuit diagram used for measuring the SD of LF fluctuations of the LSIC static consumption current. The LSIC is powered by accumulator battery Es through 15-kΩ potentiometer R1 , and the supply voltage is controlled by voltmeter V. The LSIC operation modes are governed by the input circuit commutation unit (1). The capacitors C1 = 50 µF (electrolytic) and C2 = 0.1 µF (ceramic) filter interference in the LSIC supply circuit. The voltage fluctuations induced on the resistor R2 = 10 kΩ due to fluctuations of the LSIC consumption current are applied to low-noise amplifier (2) with a gain of about 104 and the intrinsic
noise level (adjusted to the input) en ≤ 30 nV/ Hz observed in the frequency band 1–100 Hz. Below, the current fluctuations in the supply circuit of the controlled LSIC are called the MC noise. The MC amplified noise arrives at SK4-72 spectrum analyzer 3. Oscilloscope 4 is used for monitoring the signal arriving from the output of the low-noise amplifier. The input unit with the LSIC incorporated in the contact device is electrically shielded (in Fig. 1, the shield is marked by a dashed line). The thermal noise of load resistor R2 and the preamplifier noise are taken into account in the processing of the experimental results. SD S(f) of the noise power is measured in the frequency band 1−2 kHz. The on-line noise estimation of an LSIC from the test sample is provided by measuring effective voltage Ue in the frequency band 1–8 Hz by the SK4-72 spectrum analyzer, so that Ue is determined by the expression
f 2
Ue = ∫ S( f )d f ,
f 1
where S(f) is the SD of the MC noise power, f1 = 1 Hz, and f2 = 8 Hz. During measurements of voltage Ue , the averaging time constant was 10 s.
EXPERIMENTAL RESULTS
Investigations show that, in the static mode, the SD of CMOS LSIC consumption current fluctuations depends on frequency as 1/fγ , where the exponent of the spectrum is γ ≈ 0.9–1.2 for different MCs of the test sample. Figure 2 shows the diagrams of the effective noise voltage generated by 537RU6 LSICs supplied at 4.0 V (Fig. 2a) and 5.5 V (Fig. 2b) for the test sample of 537RU6 LSICs including 29 MCs. The diagrams demonstrate that this sample contains MCs whose noise levels differ by one to two orders of magnitude.
Es |
|
|
|
|
C1 |
|
C2 |
|
|
R2 |
|
C3 |
|
|||||||||||||||
|
|
|
|
|
|
|
|
|
||||||||||||||||||||
|
|
|
|
|
|
|
|
|
|
|
|
|
|
|
|
|
||||||||||||
|
|
|
|
|
|
|
|
|
|
|
|
|
|
|
||||||||||||||
|
|
|
|
|
|
|
|
|
|
|
|
|
|
|
|
|
|
|
|
|
|
|
|
|
|
|
||
|
|
|
|
|
|
|
|
|
|
|
|
|
|
|
|
|
|
|
|
|
|
|
|
|
|
|
||
|
|
+ |
R1 |
|
|
|
|
|
|
|
|
2 |
|
|
3 |
|||||||||||||
|
|
|
|
|
|
|
|
|
|
|||||||||||||||||||
|
|
|
|
|
|
|
|
|
|
|
|
|
|
|
|
|
|
|
|
|||||||||
|
|
|
|
|
|
|
|
|
|
|
|
|
|
|
|
|
|
|
|
|||||||||
|
|
|
|
|
CMOS |
V |
|
|
|
|
|
|
|
|
|
|
||||||||||||
|
|
|
|
|
|
|
|
|
|
|
|
|
|
|
|
|
|
|
|
|
|
|
4 |
|||||
|
|
|
|
|
|
|
|
|
|
|
|
|
|
LSIC |
|
|
|
|
|
|
|
|
|
|||||
|
|
|
|
|
|
|
|
|
|
|
|
|
|
|
|
|
|
|
|
|
|
|
||||||
|
|
|
|
|
|
|
|
|
|
|
|
|
|
|
|
|
|
|
|
|
|
|
|
|
||||
|
|
|
|
|
|
|
|
|
|
|
|
|
|
|
|
|
|
|
|
|
|
|
|
|
|
|
|
|
|
|
|
1 |
|
|
|
|
|
|
|
|
|
|
|
|
|
|
|
|
|
|
|
|
|
||||
|
|
|
|
|
|
|
|
|
|
|
|
|
|
|
|
|
|
|
|
|
|
|||||||
Fig. 1. Circuit diagram used for measurements of the SD of fluctuations of the LSIC static consumption current: Es is
the power supply, V is a dc voltmeter, 1 is the input circuit commutation unit, 2 is a low-noise amplifier, 3 is an oscilloscope, and 4 is an SK4-72 spectrum analyzer.
Ue , rel. units |
|
|
|
|
|
|
|
|
|
|
|
|
|
16 |
|
|
|
|
|
(a) |
|
|
|
|
|
|
|
12 |
|
|
|
|
|
|
|
|
|
|
|
|
|
8 |
|
|
|
|
|
|
|
|
|
|
|
|
|
4 |
|
|
|
|
|
|
|
|
|
|
|
|
|
0 |
4 |
6 |
8 |
10 |
12 |
14 |
16 |
18 |
20 |
22 |
24 |
26 |
28 |
2 |
|||||||||||||
LSIC number
Ue , rel. units |
|
|
|
|
(b) |
|
|
|
|
|
|
||
|
|
|
|
|
|
|
|
|
|
|
|
||
30 |
|
|
|
|
|
|
|
|
|
|
|
|
|
20 |
|
|
|
|
|
|
|
|
|
|
|
|
|
10 |
|
|
|
|
|
|
|
|
|
|
|
|
|
0 |
4 |
6 |
8 |
10 |
12 |
14 |
16 |
18 |
20 |
22 |
24 |
26 |
28 |
2 |
|||||||||||||
LSIC number
Fig. 2. Diagrams of the effective noise voltage in the mode
CE = 0 for a 537RU6 LSIC (the sample volume is N = 29 pieces) measured at the supply voltage Ucc = (a) 4.0 and
(b) 5.5 V.
These differences increase with the supply voltage; however, even at the minimum value in the operating range of supply voltage (Ucc = 4.0 V), the noise levels of MCs differ by a magnitude of tens of times. Note that
JOURNAL OF COMMUNICATIONS TECHNOLOGY AND ELECTRONICS Vol. 45 No. 3 2000
336 GAL’CHENKO, ZHIGAL’SKII
Ue , rel. units |
|
supply voltage increases up to 5.0–5.5 V (curve 13 in |
|
|
|
Fig. 3). The investigations show that these MCs have |
|
40 |
13 |
irregular voltage–current characteristics (VCCs) which |
|
are typical for the breakdown region. In addition, some |
|||
|
20 |
||
30 |
LSICs exhibit these specific properties only beyond the |
||
21 |
permissible supply voltage range corresponding to the |
||
|
10 |
performance specification, namely, in the voltage range |
|
20 |
5.5–6.0 V. For some MCs, the level of current fluctua- |
||
|
tions abruptly decreases with the subsequent increase |
||
|
|
||
10 |
|
of the voltage after the stationary electric breakdown is |
|
|
formed at a fixed value of Ucc . This effect can be attrib- |
4uted to the decrease of the LSIC differential resistance
0 |
|
|
|
|
8 |
in the supply circuit due to the electric breakdown. |
|
4.0 |
4.5 |
5.0 |
5.5 |
6.0 Ucc |
An example of this type of circuit is LSIC 8 (Fig. 3, |
Fig. |
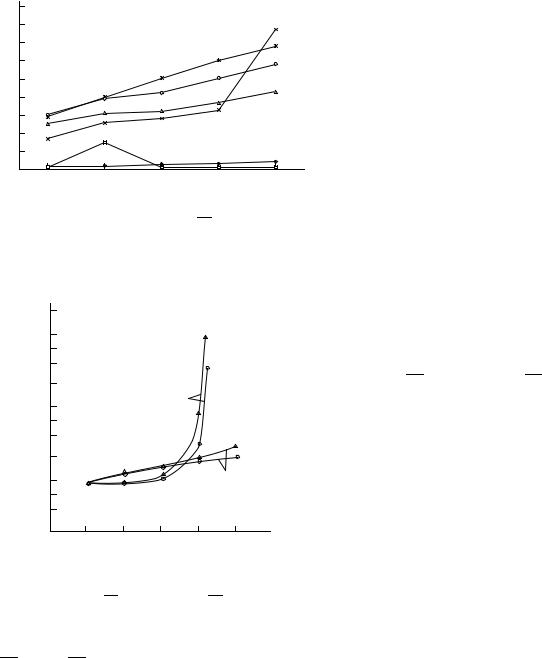
3. Typical dependences of 537RU6 LSIC effective |
curve 8). |
||||
|
||||||
noise voltage vs. supply voltage for CE = 0. The curve numbers correspond to the MC numbers in the sample with N = 29 pieces. MC N4 is a low-noise circuit.
S, rel. units 102
5
3
2
101
5 |
|
1 |
|
|
|
3 |
|
|
2 |
|
|
100 |
|
|
5 |
|
2 |
3 |
|
|
2 |
|
|
10–1 |
|
6 Ucc, V |
4 |
5 |
Fig. 4. Effective noise voltage vs. supply voltage for (1) 1617RU6 and (2) 537RU6 LSICs operating in different
modes: (triangles) CE = 0 and (circles) CE = 1.
the noise level slightly depends on the LSIC mode
( CE = 0 or CE = 1). Such a large spread in effective noise voltages observed for different LSIC specimens in the static mode gives grounds to suppose that certain high-noise LSIC specimens have latent defects.
Compare the most typical dependences of the noise level versus the supply voltage presented in Figs. 3 and 4. Figure 3 demonstrates that the low-noise LSIC of the test sample (LSIC 4) exhibits a weak dependence of effective noise voltage Ue on the supply voltage. When Ucc increases from 4.0 to 6.0 V, the noise level of these circuits increases only by 20–40%. At the same time, some LSICs with a high noise level observed at Ucc = 4.0 V exhibit a substantial increase of Ue when the
When a LSIC contains several latent defects causing a local electric breakdown, the dependence Ue = f(Ucc) may be nonmonotonic due to the superposition of fluctuating current components flowing through MC regions with different breakdown voltages. Thus, the behavior of the level of current fluctuations depending on the LSIC supply voltage can provide information about specific properties of the LSIC latent defects.
Figure 4 presents the effective noise voltage versus the supply voltage for 537RU6 and 1617RU6 LSICs in
the storage ( CE = 1) and active ( CE = 0) modes for the group of LSICs with a relatively low noise level observed at Ucc = 4.0 V. As the supply voltage increases and becomes higher than 5.0 V, the noise of the 1617RU6 LSIC abruptly increases both in the storage and active modes. A physical analysis of this MC revealed the presence of a latent manufacturing defect which caused a local electric breakdown and manifested itself at a supply voltage higher than the overload capacity 5.5 V.
Investigations of samples of certain sets of CMOS LSICs show a high correlation between the level of fluctuations of the consumption current in the storage mode and the static consumption current (linear correlation). In particular, for the test sample, the correlation coefficient between the measured effective noise voltage and consumption current Icc in the static mode is K{Ue0, e1; Icc} = 0.6–0.9 for Ucc = 4.0–5.5 V. Therefore, one may conclude that it suffices to measure the consumption current in the static mode in order to evaluate the CMOS LSIC quality. However, this is not the case for the following reasons. First, for numerous highnoise LSICs, the consumption current does not exceed the standard of the performance specification at a supply voltage lower than the overload capacity. Second, when the consumption current in a high-noise LSIC, whose parameters slowly fluctuate in time, is measured automatically, only one value of fluctuating variable Icc at a certain random time moment is recorded. This value does not indicate the actual level of the consumption current fluctuations. Therefore, measurements of static consumption current Icc of a high-noise LSIC do
JOURNAL OF COMMUNICATIONS TECHNOLOGY AND ELECTRONICS Vol. 45 No. 3 2000
DIAGNOSTICS OF LARGE-SCALE INTEGRATED CIRCUITS |
337 |
not always provide information about its latent defects or the physical process that causes substantial current fluctuations in the supply circuit. At the same time, for nondestructive LSIC quality control, fluctuations of the LSIC consumption current observed in the static mode can give more reliable information than measurements of the static consumption current.
Additional investigations of high-noise LSICs combined with physical analysis of failures showed that these LSICs contained latent defects typical for CMOS technology, such as structure disturbances of polysilicon resistors, Al-film degradation due to electrocorrosion and electromigration damages, ohmic contact faults in contact windows and oxide-step breaks, the presence of surface impurities of different natures, dendritic formations, cracking of the passivation layer, and various defects causing the electric breakdown of the p–n junction or thin oxide.
One of the mechanisms of current fluctuations in the supply circuit is the trap recharging in the oxide with the relaxation time as long as 104–105 s, which leads to the instability of the threshold voltage of MOS transistors integrated in LSICs.
Some LSIC specimens exhibited the current noise in the form of random telegraph signals (RTSs). According to the results of investigations, this (outwardly manifested) instability of the consumption current was observed in the CMOS LSIC supply circuit in the cases of very thin metallization breaks on the oxide steps or a faulty contact with the active regions of CMOS structures in the contact window. Even a single defect of this sort causes RTS current fluctuations similar to those described in [13]. According to experimental results, the time constant characterizing the presence of this defect varied from fractions of a second to tens of minutes, which was due to the parameters of CMOS LSIC electric circuits providing this process.
High-level current fluctuations in the LSIC supply circuit can be attributed to the electric breakdown of the p–n junction or thin oxide in a CMOS structure. The latter mechanism of fluctuations is thoroughly investigated [13–16]. It is shown that, in the range of LSIC operating supply voltages, the high level of 1/f fluctuations of the consumption current, as well as the RTS current fluctuations, are precursors of the electric breakdown, which enables one to detect potentially unreliable MCs by measuring the LF noise.
Our investigations show that LF current fluctuations in the CMOS LSIC supply circuit used for LSIC quality control enable one to identify and localize (i.e., to determine the location) defects of different sorts with a high degree of reliability.
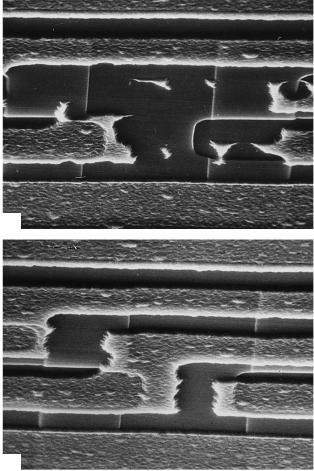
The method of nondestructive quality control employing the level and behavior of current fluctuations in the supply circuit applies not only to individual MCs but also to electronics units containing hundreds of LSICs. Figure 5 displays, as an example, the photograph of a defect similar to a local electrocorrosion of
(a)
(b)
Fig. 5. Photographs of (a) 537RU6 LSIC latent defect detected using the measurements of current fluctuations in the supply circuit and (b) the same region of the MC free of defects.
the aluminum wiring in a 564RU2 LSIC incorporated in an electronics unit containing about 20 MCs. This defect was found by controlling fluctuations of Icc. However, the MC with this defect satisfied the performance criterion according to the specifications for the LSIC and electronics unit.
Thus, measurements of the current noise level in the LSIC supply circuit and the analysis of its characteristics enable one to detect a wide class of CMOS LSIC defects. Our investigations dealing with a random sample of LSICs included in only one production set do not cover a number of other sort defects, which can be detected by controlling current fluctuations in the CMOS LSIC supply circuit.
CONCLUSION
LF current fluctuations in CMOS LSICs and VLSICs serve as an informative and sensitive detector of MC quality and can be used for detection and identification of latent defects in CMOS structures. Since
JOURNAL OF COMMUNICATIONS TECHNOLOGY AND ELECTRONICS Vol. 45 No. 3 2000
338 |
GAL’CHENKO, ZHIGAL’SKII |
CMOS LSICs and VLSICs with a high level of current fluctuations in the supply circuit observed in the static mode contain local latent defects, these MCs should be categorized as potentially unreliable. Additional investigations of high-noise LSICs combined with different techniques of physical analysis reveal the presence of various type latent defects in these MCs. We recommend controlling LF current fluctuations in the CMOS LSIC supply circuit in the static mode for diagnosing latent defects in potentially unreliable MCs.
REFERENCES
1.Celik-Butler, Z., Abstracts of Papers, AIP Conf. 285 on Physical Systems and 1/f Fluctuations, Handel, P.H. and Chung, A.L. Eds., New York, 1993, p. 200.
2.Sikula, J. and Touboul, A., Abstracts of Papers, AIP Conf. 285 on Physical Systems and 1/f Fluctuations, Handel, P.H. and Chung, A.L. Eds., New York, 1993,
p.206.
3.Jones, B.K., Adv. Electron. Electron Phys., 1994, vol. 87,
p.201.
4.Jones, B.K., Abstracts of Papers, 13th Int. Conf. Noise in Physical Systems and 1/f Fluctuations, Palanga, 1995. Singapore: World Scientific, p. 573.
5.Vandamme, L.K.J., IEEE Trans. Electron. Devices, 1994, vol. 41, no. 11, p. 2176.
6.Zhigal’skii, G.P., Usp. Fiz. Nauk, 1997, vol. 167, no. 6,
p.623.
7.Vandamme, E.P. and Vandamme, L.K.J., Microelectron. Reliab., 1996, vol. 36, p. 1107.
8.Xiaosong, Li. and Vandamme, L.K.J., Solid-State Electron., 1992, vol. 35, p. 1477.
9.Jones, B.K., Russell, P.C., and Xu, Y.Z., Abstracts of Papers, 10th Int. Conf. Noise in Physical Systems, Ambrozy, A., Ed., Budapest, 1990. Budapest: Akademical Kiado, 1990, p. 531.
10.Goryunov, I.N., Nanichkin, A.V., and Klebanov, M.N., Abstracts of Papers, Mezhdunarodnyi nauchno-tekh- nicheskii seminar “Shumovye i degradatsionnye protsessy v poluprovodnikovykh priborakh” (Int. ScientificTechnical Seminar “Noise and Degradation Processes in Semiconductor Devices”), Moscow, 1994, p. 148.
11.Zhigal’skii, G.P. and Bespalov, V.P., Elektron. Tekh.,
Ser. 8: Upr. Kach., Metrol., Stand., 1979, no. 7(77),
p. 26.
12.Zhigal’skii, G.P., Nazarov, I.N., and Fedorov, A.S., Elektron. Tekh., Ser. 8: Upr. Kach., Metrol., Stand., 1980, no. 6(84), p. 55.
13.Neri, B., Olivo, P., and Ricco, B., Appl. Phys. Lett., 1987, vol. 51(25), p. 2167.
14.Farmer, K.R., Saletti, R., and Buhrman, R.A., Appl. Phys. Lett., 1988, vol. 52(20), p. 1749.
15.Depas, M., Nigam, T., and Heyns, M.M., IEEE Trans. Electron. Devices, 1996, vol. 43, no. 9, p. 1499.
16.Alers, G.B., Weir, B.E., Krisch, K.S., and Monroe, D., Abstracts of Papers, 14th Int. Conf. Noise in Physical Systems and 1/f Fluctuations, Leuven, 1997, p. 247.
17.Harari, E., J. Appl. Phys., 1978, vol. 49, no. 4, p. 2478.
JOURNAL OF COMMUNICATIONS TECHNOLOGY AND ELECTRONICS Vol. 45 No. 3 2000