

- •Table of Contents
- •Chapter 1. Introduction
- •Using Commands
- •Batch Program Use
- •How to Use this Manual
- •Chapter 2. Object and Command Basics
- •Object Declaration
- •Object Commands
- •Object Assignment
- •More on Object Declaration
- •Auxiliary Commands
- •Managing Workfiles and Databases
- •Managing Objects
- •Basic Command Summary
- •Chapter 3. Matrix Language
- •Declaring Matrices
- •Assigning Matrix Values
- •Copying Data Between Objects
- •Matrix Expressions
- •Matrix Commands and Functions
- •Matrix Views and Procs
- •Matrix Operations versus Loop Operations
- •Summary of Automatic Resizing of Matrix Objects
- •Matrix Function and Command Summary
- •Chapter 4. Working with Tables
- •Creating a Table
- •Assigning Table Values
- •Customizing Tables
- •Labeling Tables
- •Printing Tables
- •Exporting Tables to Files
- •Customizing Spreadsheet Views
- •Table Summary
- •Chapter 5. Working with Graphs
- •Creating a Graph
- •Changing Graph Types
- •Customizing a Graph
- •Labeling Graphs
- •Printing Graphs
- •Exporting Graphs to Files
- •Graph Summary
- •Chapter 6. EViews Programming
- •Program Basics
- •Simple Programs
- •Program Variables
- •Program Modes
- •Program Arguments
- •Control of Execution
- •Multiple Program Files
- •Subroutines
- •Programming Summary
- •Chapter 7. Strings and Dates
- •Strings
- •Dates
- •Appendix A. Object, View and Procedure Reference
- •Alpha
- •Coef
- •Equation
- •Graph
- •Group
- •Link
- •Logl
- •Matrix
- •Model
- •Pool
- •Rowvector
- •Sample
- •Scalar
- •Series
- •Sspace
- •System
- •Table
- •Text
- •Valmap
- •Vector
- •Appendix B. Command Reference
- •addassign
- •addinit
- •addtext
- •align
- •alpha
- •append
- •arch
- •archtest
- •area
- •arlm
- •arma
- •arroots
- •auto
- •axis
- •bdstest
- •binary
- •block
- •boxplot
- •boxplotby
- •bplabel
- •cause
- •ccopy
- •cdfplot
- •cellipse
- •censored
- •cfetch
- •chdir
- •checkderivs
- •chow
- •clabel
- •cleartext
- •close
- •coef
- •coefcov
- •coint
- •comment
- •control
- •copy
- •correl
- •correlsq
- •count
- •create
- •cross
- •data
- •datelabel
- •dates
- •dbcopy
- •dbcreate
- •dbdelete
- •dbopen
- •dbpack
- •dbrebuild
- •dbrename
- •dbrepair
- •decomp
- •define
- •delete
- •derivs
- •describe
- •displayname
- •draw
- •drawdefault
- •driconvert
- •drop
- •dtable
- •edftest
- •endog
- •equation
- •errbar
- •exclude
- •exit
- •expand
- •fetch
- •fill
- •fiml
- •fixedtest
- •forecast
- •freeze
- •freq
- •frml
- •garch
- •genr
- •grads
- •graph
- •group
- •hconvert
- •hfetch
- •hilo
- •hist
- •hlabel
- •impulse
- •jbera
- •kdensity
- •kerfit
- •label
- •laglen
- •legend
- •line
- •linefit
- •link
- •linkto
- •load
- •logit
- •logl
- •makecoint
- •makederivs
- •makeendog
- •makefilter
- •makegarch
- •makegrads
- •makegraph
- •makegroup
- •makelimits
- •makemap
- •makemodel
- •makeregs
- •makeresids
- •makesignals
- •makestates
- •makestats
- •makesystem
- •matrix
- •means
- •merge
- •metafile
- •model
- •name
- •nnfit
- •open
- •options
- •ordered
- •output
- •override
- •pageappend
- •pagecontract
- •pagecopy
- •pagecreate
- •pagedelete
- •pageload
- •pagerename
- •pagesave
- •pageselect
- •pagestack
- •pagestruct
- •pageunstack
- •param
- •pcomp
- •plot
- •pool
- •predict
- •probit
- •program
- •qqplot
- •qstats
- •range
- •ranhaus
- •read
- •rename
- •representations
- •resample
- •reset
- •residcor
- •residcov
- •resids
- •results
- •rndint
- •rndseed
- •rowvector
- •sample
- •save
- •scalar
- •scale
- •scat
- •scatmat
- •scenario
- •seas
- •seasplot
- •series
- •setbpelem
- •setcell
- •setcolwidth
- •setconvert
- •setelem
- •setfillcolor
- •setfont
- •setformat
- •setheight
- •setindent
- •setjust
- •setline
- •setlines
- •setmerge
- •settextcolor
- •setwidth
- •sheet
- •show
- •signalgraphs
- •smooth
- •smpl
- •solve
- •solveopt
- •sort
- •spec
- •spike
- •sspace
- •statby
- •stategraphs
- •statefinal
- •stateinit
- •stats
- •statusline
- •stom
- •stomna
- •store
- •structure
- •svar
- •system
- •table
- •template
- •testadd
- •testbtw
- •testby
- •testdrop
- •testexog
- •testfit
- •testlags
- •teststat
- •text
- •textdefault
- •trace
- •tramoseats
- •tsls
- •unlink
- •update
- •updatecoefs
- •uroot
- •usage
- •valmap
- •vars
- •vector
- •wald
- •wfcreate
- •wfopen
- •wfsave
- •wfselect
- •white
- •workfile
- •write
- •wtsls
- •xyline
- •xypair
- •Appendix C. Special Expression Reference
- •@expand
- •nrnd
- •Appendix D. Operator and Function Reference
- •Operators
- •Basic Mathematical Functions
- •Time Series Functions
- •Descriptive Statistics
- •By-Group Statistics
- •Special Functions
- •Trigonometric Functions
- •Statistical Distribution Functions
- •Appendix E. Workfile Functions
- •Basic Workfile Information
- •Dated Workfile Information
- •Panel Workfile Functions
- •Appendix F. String and Date Function Reference
- •@dateadd
- •@datediff
- •@datefloor
- •@datepart
- •@datestr
- •@dateval
- •@dtoo
- •@eqna
- •@insert
- •@instr
- •@isempty
- •@left
- •@len, @length
- •@lower
- •@ltrim
- •@makedate
- •@neqna
- •@otod
- •@replace
- •@right
- •@rtrim
- •@strdate
- •@strlen
- •@strnow
- •@trim
- •@upper
- •Appendix G. Matrix Reference
- •@cholesky
- •colplace
- •@columnextract
- •@columns
- •@cond
- •@convert
- •@eigenvalues
- •@eigenvectors
- •@explode
- •@filledmatrix
- •@filledrowvector
- •@filledsym
- •@filledvector
- •@getmaindiagonal
- •@identity
- •@implode
- •@inner
- •@inverse
- •@issingular
- •@kronecker
- •@makediagonal
- •matplace
- •mtos
- •@norm
- •@outer
- •@permute
- •@rank
- •@resample
- •@rowextract
- •rowplace
- •@rows
- •@solvesystem
- •stom
- •stomna
- •@subextract
- •@trace
- •@transpose
- •@unitvector
- •@vech
- •Appendix H. Programming Language Reference
- •call
- •@date
- •else
- •endif
- •endsub
- •@errorcount
- •@evpath
- •exitloop
- •include
- •@isobject
- •next
- •open
- •output
- •poff
- •program
- •return
- •statusline
- •step
- •stop
- •subroutine
- •@temppath
- •then
- •@time
- •wend
- •while
- •Index
- •Symbols
- •% (percent sign)
- •+ (plus)
- •addition 35
- •@crossid 593
- •@date 148, 590, 633
- •@eqna 124, 575, 599
- •@-functions
- •@inner 578, 619
- •@insert 126, 600
- •@instr 124, 600
- •@inverse 620
- •@isempty 124, 601
- •@isna 575
- •@isobject 637
- •@isperiod 591
- •@issingular 620
- •@kronecker 620
- •@kurtsby 580
- •@last 474
- •@lastmax 474
- •@lastmin 474
- •@left 125, 601, 606
- •@length 124, 602
- •@logit 583
- •@logx 576
- •@lower 127, 602
- •@ltrim 126, 602
- •@makedate 142, 603
- •@makediagonal 621
- •@maxsby 579
- •@meansby 579
- •@median 578
- •@mediansby 579
- •@minsby 579
- •@month 148, 591
- •@movav 576
- •@movsum 576
- •@nasby 580
- •@neqna 125, 575, 604
- •@ngroups 580
- •@norm 623
- •@obsby 579
- •@obsid 593
- •@obsnum 589
- •@obsrange 590
- •@obssmpl 590
- •@otod 128, 605
- •@outer 623
- •@pcha 577
- •@pchy 577
- •@permute 624
- •@quantile 579
- •@quantilesby 580
- •@quarter 148, 591
- •@rank 624
- •@recode 576
- •@replace 126, 605
- •@resample 625
- •@RGB specification of colors 454
- •@right 126
- •@round 576
- •@rowextract 625
- •@rows 626
- •@rtrim 126, 606
- •@seas 591
- •@skewsby 580
- •@solvesystem 626
- •@sqrt 576
- •@stdev 579
- •@stdevsby 579
- •@strdate 128, 148, 591, 607
- •@strlen 607
- •@strnow 128, 607
- •@subextract 628
- •@sumsby 579
- •@sumsq 579
- •@sumsqsby 579
- •@temppath 641
- •_ (continuation character) 84
- •Numerics
- •Add factor
- •align 203
- •views 154
- •Alpha series
- •append 205
- •ARCH
- •Arguments
- •in programs 98
- •ARMA
- •ASCII file
- •open as workfile 532
- •Autocorrelation
- •Autogressive error. See AR.
- •Autowrap text 83
- •Axis
- •rename label 371
- •axis 217
- •Beta
- •Binary
- •Binomial
- •customize 231
- •Breusch-Godfrey test
- •call 633
- •Cell
- •censored 238
- •Cholesky factor
- •Chow test 241
- •Close
- •Coefficient
- •See Coef.
- •update default coef vector 521
- •Cointegration
- •Color
- •Column
- •extract from matrix 612
- •stack matrix 630
- •Conditional standard deviation
- •Conditional variance
- •Control variable 88
- •Convert
- •date to observation number 599
- •matrix to sym 618
- •Coordinates
- •Copy
- •cross 260
- •matrix 259
- •Create
- •Cross section member
- •of squares 424
- •Data
- •Database
- •Date
- •Dates
- •current date and time 147
- •string representation 598
- •Declare
- •Delete
- •Derivatives
- •Directory
- •Distribution function
- •DRI database
- •fetch series 239
- •Drop
- •group series or cross-section from pool definition 281
- •Eigenvalues 615
- •Element
- •else 634
- •Error correction model
- •Errors
- •exclude 289
- •Exclude variables from model solution 289
- •Exit
- •Exponential
- •Export
- •matrix 41
- •Extract
- •row vector 625
- •Files
- •Fill
- •Filled
- •Fixed effects
- •For loop
- •Forecast
- •Freeze
- •frml 306
- •Full information maximum likelihood 296
- •GARCH
- •Gauss file 532
- •Gaussian distribution 586
- •Generalized autoregressive conditional heteroskedasticity
- •Generate series
- •Gompit models 222
- •Gradients
- •display 315
- •create 59
- •high-low-open-close 320
- •pie graph 406
- •XY graph 556
- •graph 316
- •greater than comparison 36
- •add series 198
- •group 317
- •Hausman test 413
- •hconvert 318
- •HTML
- •If statement 100
- •Include
- •Inverse of matrix 620
- •Jarque-Bera
- •Johansen cointegration test 245
- •Kernel
- •label 330
- •specify as range 643
- •Lagrange multiplier
- •Legend
- •line 334
- •Link object
- •Local
- •Logistic
- •logl 344
- •Loop
- •exit loop 108, 635
- •Lotus file
- •Matrix
- •resample rows from 625
- •matrix 366
- •Maximum 578
- •Median 578
- •Merge
- •Messages
- •model solution 371
- •Model 170
- •Models
- •block structure 223
- •solve 475
- •Multiplication operator (*) 35
- •Negative binomial
- •Number
- •evaluate a string 608
- •Numbers
- •converting from strings 124
- •store 16, 490
- •Open
- •database 266
- •Output
- •Output redirection 638
- •override 382
- •Override variables in model solution 382
- •Page
- •resize 399
- •Panel
- •Panel data
- •Percent change
- •Poisson
- •Pool 171
- •declare 408
- •delete identifiers 272
- •pool 408
- •portrait 8
- •probit 410
- •create 83
- •open 84
- •P-value functions 587
- •QQ-plot
- •Quantile function 579
- •Random effects
- •Random number
- •Read
- •Recode values 576
- •Regressors
- •Rename
- •Resample
- •Residuals
- •Results
- •return 639
- •height 50
- •Run program
- •multiple files 108
- •Sample
- •set current 474
- •Save
- •with kernel fit 329
- •scenario 438
- •seas 440
- •Second moment matrix 619
- •declare 442
- •formula 306
- •show 470
- •Signal variables
- •Singular matrix
- •test for 620
- •Smoothing
- •Solve
- •linear system 626
- •sort 478
- •Sspace
- •declare 482
- •procs 180
- •State space
- •State variables
- •display graphs of 484
- •Static forecast 297
- •insert string into 600
- •relational comparison 121
- •String variable 89
- •in for loop 104
- •return from 109, 639
- •Symmetric matrix
- •declare 497
- •Table 187
- •text color 54
- •Test
- •Chow 241
- •for ARCH 210
- •mean, median, variance equality 501
- •mean, median, variance equality by classification 502
- •Text file
- •Then 642
- •Time
- •current as string 607
- •trace 512
- •Trigonometric functions 583
- •Uniform distribution 587
- •Valmap 189
- •vector 529
- •Verbose mode 85
- •append contents of workfile page to current page 383
- •close 12
- •contract page 385
- •create 260
- •end date of observation interval 590
- •open existing 12, 532
- •period indicators 591
- •save 12, 540
- •stack page 396
- •Write
- •wtsls 547
- •xypair 561

446—Appendix B. Command Reference
Cross-references
See “Boxplots” on page 407 of the User’s Guide for a description of boxplots.
See setelem (p. 449) to modify line and symbol attributes. See also bplabel (p. 231), options (p. 375), axis (p. 217), and scale (p. 433).
setcell |
Command |
|
|
Insert contents into cell of a table.
The setcell command puts a string or number into a cell of a table.
Syntax
Command: setcell(table_name, r, c, content[, "options"])
Options
Provide the following information in parentheses in the following order: the name of the table object, the row number, r, of the cell, the column number, c, of the cell, a number or string to put in the cell, and optionally, a justification and/or numerical format code. A string of text must be enclosed in double quotes.
The justification options are:
c |
Center the text/number in the cell. |
|
|
r |
Right-justify the text/number in cell. |
|
|
l |
Left-justify the text/number in cell. |
|
|
The numerical format code determines the format with which a number in a cell is displayed; cells containing strings will be unaffected. The format code can either be a positive integer, in which case it specifies the number of decimal places to be displayed after the decimal point, or a negative integer, in which case it specifies the total number of characters to be used to display the number. These two cases correspond to the Fixed decimal and Fixed character fields in the number format dialog.
Note that when using a negative format code, one character is always reserved at the start of a number to indicate its sign, and that if the number contains a decimal point, that will also be counted as a character. The remaining characters will be used to display digits. If the number is too large or too small to display in the available space, EViews will attempt to use scientific notation. If there is insufficient space for scientific notation (six characters or less), the cell will contain asterisks to indicate an error.
setcolwidth—447
Examples
setcell(tab1, 2, 1, "Subtotal")
puts the string “Subtotal” in row 2, column 1 of the table object named TAB1.
setcell(tab1, 1, 1, "Price and cost", "r")
puts the a right-justify string "Price and cost" in row 1, column 1 of the table object named TAB1.
Cross-references
Chapter 4 describes table formatting using commands. See Chapter 14 of the User’s Guide for a discussion and examples of table formatting in EViews.
See also setwidth (p. 468).
setcolwidth Command
Set width of a column of a table.
Provided for backward compatibility. See setwidth (p. 468) for the new method of setting the width of table and spreadsheet columns.
Syntax
Command: setcolwidth(table_name, c, width)
Options
To change the width of a column, provide the following information in parentheses, in the following order: the name of the table, the column number c, and the number of characters width for the new width. EViews measures units in terms of the width of a numeric character. Because different characters have different widths, the actual number of characters that will fit may differ slightly from the number you specify. By default, each column is approximately 10 characters wide.
Examples
setcolwidth(mytab,2,20)
sets the second column of table MYTAB to fit approximately 20 characters.

448—Appendix B. Command Reference
Cross-references
Chapter 4, “Working with Tables”, on page 47 describes table formatting using commands. See also Chapter 14, “Graphs, Tables, and Text Objects”, on page 413 of the User’s Guide for a discussion and examples of table formatting in EViews.
See also setwidth (p. 468) and setheight (p. 461).
setconvert |
Series Proc |
|
|
Set frequency conversion method.
Determines the default frequency conversion method for a series when copied or linked between different frequency workfiles.
You may override this default conversion method by specifying a frequency conversion method as an option in the specific command (using copy (p. 249), fetch (p. 291), or linkto (p. 339)).
If you do not set a conversion method and if you do not specify a conversion method as an option in the command, EViews will use the conversion method set in the global option.
Syntax
Series Proc: |
ser_name.setconvert [up_method down_method] |
Follow the series name with a period, the keyword, and option letters to specify the frequency conversion method. If either the up-conversion or down-conversion method is omitted, EViews will set the corresponding method to Use EViews default.
Options
The following options control the frequency conversion method when copying series and group objects to a workfile, converting from low to high frequency:
Low to high |
“r” (constant match average), “d” (constant match |
conversion |
sum), “q” (quadratic match average), “t” (quadratic |
methods |
match sum), “i” (linear match last), “c” (cubic match |
|
last). |
|
|
The following options control the frequency conversion method when copying series and group objects to a workfile, converting from high to low frequency:

setelem—449
High to low |
High to low conversion methods removing NAs: “a” |
conversion |
(average of the nonmissing observations), “s” (sum of |
methods |
the nonmissing observations), “f” (first nonmissing |
|
observation), “l” (last nonmissing observation), “x” |
|
(maximum nonmissing observation), “m” (minimum |
|
nonmissing observation). |
|
High to low conversion methods propagating NAs: “an” |
|
or “na” (average, propagating missings), “sn” or “ns” |
|
(sum, propagating missings), “fn” or “nf” (first, propa- |
|
gating missings), “ln” or “nl” (last, propagating miss- |
|
ings), “xn” or “nx” (maximum, propagating missings), |
|
“mn” or “nm” (minimum, propagating missings). |
|
|
Examples
unemp.setconvert a
sets the default down-conversion method of the series UNEMP to take the average of nonmissing observations, and resets the up-conversion method to use the global default.
ibm_hi.setconvert xn d
sets the default down-conversion method for IBM_HI to take the largest observation of the higher frequency observations, propagating missing values, and the default up-conversion method to constant, match sum.
consump.setconvert
resets both methods to the global default.
Cross-references
See “Frequency Conversion” on page 113 of the User’s Guide for a discussion of frequency conversion and the treatment of missing values.
See also copy (p. 249), fetch (p. 291) and linkto (p. 339).
setelem |
Graph Proc |
|
|
Set individual line, bar and legend options for each series in the graph.
Syntax
Graph Proc: |
graph_name.setelem(graph_elem) argument_list |
450—Appendix B. Command Reference
where graph_elem is the identifier for the graph element whose options you wish to modify:
integer |
Index for graph element (for non-boxplot graphs). For |
|
example, if you provide the integer “2”, EViews will |
|
modify the second line in the graph. |
|
|
box_elem |
Boxplot element to be modified: box (“b”), median |
|
(“med”), mean (“mean”), near outliers (“near” or |
|
“no”), far outliers (“far” or “fo”), whiskers (“w”), sta- |
|
ples (“s”). For boxplot graphs only. |
The argument list for setelem may contain one or more of the following:
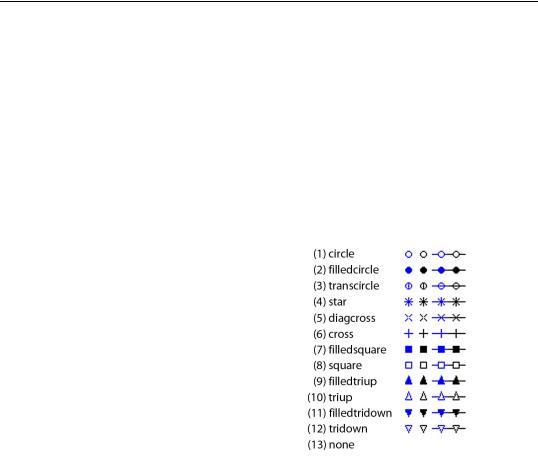
symbol(arg) |
Sets the drawing |
|
|
|
|||
|
symbol: arg can be |
|
|
|
an integer from 1– |
|
|
|
13, or one of the |
|
|
|
matching keywords. |
|
|
|
Selecting a symbol |
|
|
|
automatically turns |
|
|
|
on symbol use. The |
|
|
|
“none” option turns |
|
|
|
off symbol use. |
|
|
|
|
|
|
|
|
|
|
linecolor(args), |
Sets the line and symbol color. The args value may set |
lcolor(args) |
by using one of the color keywords (e.g., “blue”), or by |
|
using the RGB values (e.g., “@RGB(255, 255, 0)”). For |
|
a description of the available color keywords (“blue”, |
|
“red”, “green”, “black”, “white”, “purple”, “orange”, |
|
“yellow”, “gray”, “ltgray”). For a full description of the |
|
keywords, see setfillcolor (p. 453). |
|
|
linewidth(n1), |
Sets the line and symbol width: n1 should be a number |
lwidth(n1) |
between “.25” and “5”, indicating the width in points. |
|
|
setelem—451
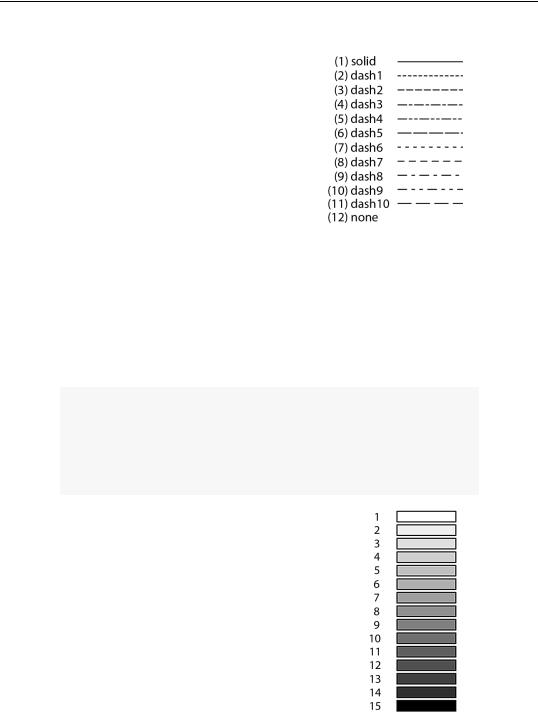
linepattern(arg), lpat(arg)
fillcolor(arg), fcolor(arg)
fillgray(n1), gray(n1)
Sets the line pattern to the type specified by arg. arg can be an integer from 1–12 or one of the matching keywords.
Note that the option interacts with the graph options for “color”, “lineauto”, “linesolid”, “linepat” (see options
(p. 375), for details). You may need to set the graph option for “linepat” to
enable the display of line patterns. See options (p. 375).
Note also that the patterns with index values 7–11 have been modfied since version 5.0. In particular, the “none” option has been moved to position 12.
The “none” option turns off lines and uses only symbols.
Sets the fill color for symbols, bars, and pies. The args value may set by using of the color keywords (“blue”, “red”, “green”, “black”, “white”, “purple”, “orange”, “yellow”, “gray”, “ltgray”) or by using the RGB values (e.g., “@RGB(255, 255, 0)”). For a full description of the keywords, see setfillcolor (p. 453)
Sets the gray scale for bars and pies: n1 should be an integer from 1–15 corresponding to one of the predefined gray scale settings (from lightest to darkest).
452—Appendix B. Command Reference
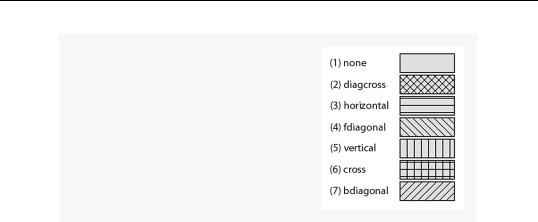
fillhatch(arg), hatch(arg)
Sets the hatch characteristics for bars and pies: arg can be an integer from 1–7, or one of the matching keywords.
preset(n1) |
Sets line and fill characteristics to the specified EViews |
|
|
preset values, where n1 is an integer from 1–30. Simul- |
|
|
taneously sets “linecolor”, “linepattern”, “linewidth”, |
|
|
“symbol”, “fillcolor”, “fillgray”, and “fillhatch” to the |
|
|
EViews predefined definitions for graph element n1. |
|
|
When applied to boxplots, the line color of the specified |
|
|
element will be applied to the box, whiskers, and sta- |
|
|
ples. |
|
|
|
|
default(n1) |
Sets line and fill characteristics to the specified user- |
|
|
defined default settings where n1 is an integer from 1– |
|
|
30. Simultaneously sets “linecolor”, “linepattern”, “lin- |
|
|
ewidth”, “symbol”, “fillcolor”, “fillgray”, and “fill- |
|
|
hatch” to the values in the user-defined global defaults |
|
|
for graph element n1. |
|
|
When applied to boxplots, the line color of the specified |
|
|
settings will be applied to the box, whiskers, and sta- |
|
|
ples. |
|
|
|
|
axis(arg), |
Assigns the element to an axis: left (“l”), right (“r”), |
|
axisscale(arg) |
bottom (“b”), top (“t”). The latter two options are only |
|
applicable for XY and scatter graphs (scat (p. 435), xy |
||
|
||
|
(p. 556), xyline (p. 558), xypair (p. 561)). |
|
|
|
|
legend(str) |
Assigns legend text for the element. str will be used in |
|
|
the legend to label the element. |
|
|
|
Examples
graph1.setelem(2) lcolor(blue) lwidth(2) symbol(circle)
sets the second line of GRAPH1 to be a blue line of width 2 with circle symbols.