


addinit—199
The options identify the type of add factor to be used, and control the assignment behavior for equations where you have previously assigned add factors. addassign may be called multiple times to add different types of add factors to different equations. addassign may also be called to remove existing add factors.
Options
i |
Intercept shifts (default). |
|
|
v |
Variable shift. |
|
|
n |
None—remove add factors. |
|
|
c |
Change existing add factors to the specified type—if the |
|
“c” option is not used, only newly assigned add factors |
|
will be given the specified type. |
Examples
m1.addassign(v) @all
assigns a variable shift to all equations in the model.
m1.addassign(c, i) @stochastic
changes the stochastic equation add factors to intercept shifts.
m1.addassign(v) @stochastic
m1.addassign(v) y1 y2 y2
m1.addassign(i) @identity
assigns variable shifts to the stochastic equations and the equations for Y1, Y2, and Y3, and assigns intercept shifts to the identities.
Cross-references
See “Using Add Factors” on page 800 of the User’s Guide. See also Chapter 26, “Models”, beginning on page 775 of the User’s Guide for a general discussion of models.
See addinit (p. 199).
addinit |
Model Proc |
|
|
Initialize add factors.
Syntax
Model Proc: |
model_name.addinit(options) equation_spec |

200—Appendix B. Command Reference
where equation_spec identifies the equations for which you wish to initialize the add factors. You may either provide a list of endogenous variables, or you may use one of the following shorthand keywords:
@all |
All equations |
|
|
@stochastic |
All stochastic equations (no identities) |
|
|
@identity |
All identities |
|
|
The options control the type of initialization and the scenario for which you want to perform the initialization. addinit may be called multiple times to initialize various types of add factors in the different scenarios.
Options
v=arg |
Initialize add factors: “z” (set add factor values to |
(default=“z”) |
zero), “n” (set add factor values so that the equation |
|
has no residual when evaluated at actuals), “b” (set |
|
add factors to the values of the baseline; over- |
|
ride=actual). |
|
|
s=arg |
Scenario selection: “a” (set active scenario add factors), |
(default=“a”) |
“b” (set baseline scenario/actuals add factors), “o” (set |
|
active scenario override add factors). |
Examples
m1.addinit(v=b) @all
sets all of the add factors in the active scenario to the values of the baseline.
m1.addinit(v=z) @stochastic
m1.addinit(v=n) y1 y1 y2
first sets the active scenario stochastic equation add factors to zero, and then sets the Y1, Y2, and Y3 equation residuals to zero (evaluated at actuals).
m1.addinit(s=b, v=z) @stochastic
sets the baseline scenario add factors to zero.
Cross-references
See “Using Add Factors” on page 800 of the User’s Guide. See also Chapter 26, “Models”, on page 775 of the User’s Guide for a general discussion of models.
See also addassign (p. 198).

addtext—201
addtext |
Graph Proc |
|
|
Place text in graphs. |
|
Syntax |
|
Graph Proc: |
graph_name.addtext(options) "text" |
Follow the addtext keyword with the text to be placed in the graph, enclosed in double quotes.
To include carriage returns in your text, use the control “\r” or “\n” to represent the return. Since the backslash “\” is a special character in the addtext command, use a double slash “\\” to include the literal backslash character.
Options
The following options may be provided to change the characteristics of the specified text object. Any unspecified options will use the default text settings of the graph.
font([face], [pt], [+/- b], [+/- i], [+/- u], [+/- s])
textcolor(arg)
fillcolor(arg)
Set characteristics of text font. The font name (face), size (pt), and characteristics are all optional. face should be a valid font name, enclosed in double quotes. pt should be the font size in points. The remaining options specify whether to turn on/off boldface (b), italic (i), underline (u), and strikeout (s) styles.
Sets the color of the text. arg may be one of the predefined color keywords, or it may be made up of n1, n2, n3, a set of three integers from 0 to 255, representing the RGB values of the color. For a description of the available color keywords (“blue”, “red”, “green”, “black”, “white”, “purple”, “orange”, “yellow”, “gray”, “ltgray”), see setfillcolor (p. 453).
Sets the background fill color of the text box. arg may be one of the predefined color keywords, or it may be made up of n1, n2, n3, a set of three integers from 0 to 255, representing the RGB values of the color. For a description of the available color keywords (“blue”, “red”, “green”, “black”, “white”, “purple”, “orange”, “yellow”, “gray”, “ltgray”), see setfillcolor
(p. 453).
202—Appendix B. Command Reference
framecolor(arg) |
Sets the color of the text box frame. arg may be one of |
|
the predefined color keywords, or it may be made up of |
|
n1, n2, n3, a set of three integers from 0 to 255, repre- |
|
senting the RGB values of the color. For a description of |
|
the available color keywords (“blue”, “red”, “green”, |
|
“black”, “white”, “purple”, “orange”, “yellow”, “gray”, |
|
“ltgray”), see setfillcolor (p. 453). |
The following options control the position of the text:
t |
Top (above the graph and centered). |
|
|
l |
Left rotated. |
|
|
r |
Right rotated. |
|
|
b |
Below and centered. |
|
|
x |
Enclose text in box. |
|
|
The options which support the “-” may be proceeded by a “+” or “-” indicating whether to turn on or off the option. The “+” is optional.
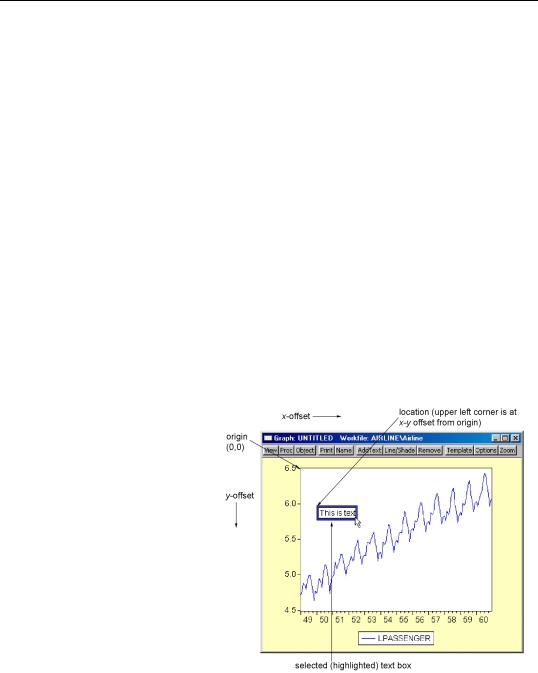
To place text within a graph, you can use explicit coordinates to specify the position of the upper left corner of the text.
Coordinates are set by a pair of numbers h, v in virtual inches. Individual graphs are always 4 × 3 virtual inches (scatter diagrams are 3 × 3 virtual inches) or a user-speci- fied size, regardless of their current display size.
The origin of the coordinate is the upper left hand corner of the graph. The first number h specifies how many virtual inches to offset to the right from the origin. The second number v specifies how many virtual inches to offset below the origin. The upper left
hand corner of the text will be placed at the specified coordinate.