

920
.pdfcreation of a valuable database on the main types of soils in the region. This information could be used during monitoring and justification of protective measures in the endangered territories.
Keywords: specially protected natural territories, humus, carbonates, Red Book of soils. References
1.Bezuglova O.S., Kazeev K.Sh., Kolesnikov S.I., Nazarenko O.G. The current state of the chernozems of the Rostov region // Proceedings of the International Scientific Conference "The present state of the chernozems", Rostov-on-Don, September 24–26, 2013, Rostov-on-Don, 2013. Pp. 6-10.
2.Bezuglova O.S., Khirkhyrova M.M. Soils of the Rostov region. Rostov-on-Don: Publishing House of the Southern Federal University, 2008.352 p.
3.Egorov V.V., Friedland V.M., Ivanova E.N., Rozov N.N., Nosin V.A., Friev T.A. Classification and diagnosis of the soil of the USSR. M .: Kolos, 1977. 224 p.
4.Zakharov S.A. Chernozems. Southern, North Caucasian, ordinary, pre-Caucasian // Soils of the Rostov Region and their agronomic characteristic. Rostov-on-Don: Growth. region Prince, 1940. Prince. 3. 208 p.
5.Chernova O.V., Bezuglova O.S. Principles and features of the creation of the Red Books of the soils of the steppe regions (on the example of the Rostov region) // Arid Ecosystems, 2018, Volume 24, No. 1 (74). Pp. 40–51.
UDC 631.4
J.Kátai, A. Balláné Kovács, I.Vágó, M.Tállai, Á.Zsuposné Oláh Institute of Agricultural Chemistry and Soil Science,
Faculty of Agricultural, Food Sciences and Environmental Management Debrecen University, Debrecen, Hungary
CHANGES IN SOIL PROPERTIES IN A LONG-TERM FERTILIZATION
EXPERIMENTS IN HUNGARY
Abstract. In a 30-year-old long-term fertilization experiment the effects of different fertilization’ levels applied in triculture are evaluated on some chemical properties and microbiological characteristics referring to the soil biological activity on a Chernozem soil. Results were evaluated and compared separately in the spring and autumn seasons (2013), as well as correlation was sought between the parameters using statistical tests. The increasing fertilization level decreased the pH and increased the hydrolytic acidity significantly. More close correlation was proved among the microbiological parameters of soil in autumn, than in spring sampling time.
Keywords: soil properties, microbial biomass C and N, carbon-dioxide production, net nitrification.
Introduction. One of the greatest advantages of a long-term experiment is that changes and processes in soil-plant system can be monitored for several years. These consistent studies may be useful in understanding the properties of the soils and their tolerance to agrotechnical methods. According to Muhammed et al., [13] the organic carbon stock decreased in the arable lands, at the same time increased it under grasslands in UK. The nitrogen loss and phosphorus surplus increased between 1800-2010 years both on the field and under the grasslands.
In long term experiments the balanced nutrient supply has positive effects on conservation processes of matter and energy [7, 9, 10]. The speed of humification and mineralization determine the soil humus and the nutrient stock that could be available by
20
plants by decomposing organic matter [5]. A lot of researcher examines the effect of fertilization on the soil microbiological processes. Most of researchers have found that optimum use of fertilization generally has a positive impact on the cycle of soil materials and processes of energy flow [6, 15, 16, 18, 21].
In long-term experiments correlation test were performed between soil parameters by Szili Kovács et al. [17] involving the different C and N-forms, and enzymes activities. In a grassland soil strong correlation was found between the enzyme activities and microbial biomass [1]. Some papers deal with the effect of intensive fertilization on soil pH. They experienced the decreasing pH parallel with increasing hydrolytic acidity of soils, when the abundance and activity of microbiological groups is simultaneously changing [8, 11].
Our aim was to study the effect of increasing doses of fertilization on the parameters of soil chemical and biological processes in a long-term maize triculture experiment, in a spring with average precipitation and very dry autumn period; set on chernozem soil.
Materials and methods. Effect of various level of fertilization was measured on the physical chemical and microbiological parameters of soil referring to the biological activity. In the long-term experiment was set on Chernozems in Látókép; the triculture plots (a three-year crop rotation system: pea – winter wheat – maize) were sampled and investigated without irrigation in the spring and autumn period in four repetitions in 2003. Treatments are: control 1, small dose 2 (N60 P45 K45), small-medium dose 3 (N120 P90 K90), medium-large dose 4 (N180 P135 K135), large dose 5 (N240 P180 K180); the doses as N, P2O5, and K2O.
Moisture content was measured by drying the soil at 105oC for 24h. Soil pH was measured in distilled water and 1M potassium chloride (KCl), ratio of soil/water 1/2,5 w/w. The AL-P2O5 and –K2O of the soil was based on [2], the analysis of NO3-N content of soil was based on [3]. Soil organic carbon was determined by [20]. Total number of bacteria and microscopic fungi was measured by [19]. Saccharase activity was measured by the method of Frankenberger et al. [4]; urease activity was based on the quantitative determination of ammonia by [19]. Phosphatase activity and CO2 emission was determined by [14], dehydrogenase activity by [12]. Microbial biomass carbon (MBC) and nitrogen (MBN) was measured by fumigation-extraction methods [22], net nitrification was measured after incubation by [3]. Correlation analyses, ANOVA and significant differences were used for evaluation of the results.
Results and discussion. In this experiment we would like to show and compare the results of spring and autumn of 2013 year. Texture of soils is loam; the average moisture content was higher in spring (18-19%), while in autumn between 12-15%. The pH is slightly acidic, in two treatments (4, 5) decreased both the two measured pH significantly; it may be due to the increasing level of fertilizer. The hydrolytic acidity increased significantly, especially in the autumn period, doubled in treatment 5. Consequently, close negative correlation were proved between these parameters. Regarding the three macronutrients, in autumn significantly higher phosphorus, potassium and nitrate were measured with a few exception, compare to the controls. (Table 1). Some important parameters of C- and N cycling can be seen in Table 2. There was no remarkable change in the OC and ON -content among the two sampling periods. While the OC was a little bit higher in spring, the ON was higher in autumn. Regarding the quantity of MBC and MBN higher differences were measured, than in case of OC and ON, only the tendency was similar. The MBC was significantly higher in spring, except the control.
21

Table 1.
Moisture content and some chemical results of soils from Debrecen Látókép longterm experiment (Zea mays L. triculture, non-irrigated)
Results of spring (10. 06. 2013)
Treatments |
Moisture |
pH |
pH KCl |
Hydrolytic |
NO3 mg |
AL P2O5 |
AL K2O mg |
|
content% |
H2O |
acidity |
kg-1 |
mg kg-1 |
kg-1 |
|||
|
|
|||||||
1.Control |
18.88b |
6.10c |
5.35b |
10.90a |
23.02a |
18.67a |
192.67a |
|
2.N60P45K45 |
18.49ab |
6.02c |
5.25b |
11.31ab |
26.72ab |
24.00a |
186.00a |
|
3.N120P90K90 |
18.37ab |
5.99c |
5.01ab |
11.87b |
30.70b |
60.33c |
215.00ab |
|
4.N180P135K135 |
18.32ab |
5.68b |
4.80a |
13.11c |
111.58c |
53.00b |
237.33bc |
|
5.N240P180K180 |
18.00a |
5.50a |
4.73a |
15.50d |
106.87c |
82.67d |
253.67c |
|
SD5% |
0.68 |
0.13 |
0.41 |
0.79 |
5.20 |
7.00 |
34.60 |
|
|
|
Results of autumn (01.10. 2013) |
|
|
||||
1.Control |
13.47b |
6.06e |
4.94e |
11.59a |
31.50a |
19.33a |
201.33a |
|
2. N60P45K45 |
12.82a |
5.81d |
4.62d |
15.20b |
67.09c |
30.00b |
202.00a |
|
3.N120P90K90 |
13.24b |
5.63c |
4.51c |
17.05c |
51.53b |
33.67b |
215.33b |
|
4.N180P135K135 |
14.30c |
5.40b |
4.39b |
18.78d |
98.33d |
70.33c |
226.00c |
|
5.N240P180K180 |
15.18d |
5.27a |
4.29a |
20.96e |
130.62e |
127.33d |
299.00d |
|
SD5% |
0.15 |
0.19 |
0.04 |
1.03 |
11.79 |
9.65 |
8.84 |
|
More intensive CO2-production was measured in all treatments spring, then in autumn, in all treatments. The net nitrification is the parameter where in the spring sampling time much higher results were detected. Overall, in the spring soil samples more intense nitrate exploration was measured and parallel with the fertilization levels significantly increased the NO3-content.
Table 2.
Some parameters of C and N cycles from Debrecen Látókép long-term experiment
(Zea mays L. triculture, non-irrigated)
Results of spring (10. 06. 2013)
|
|
|
MBC |
MBN |
CO2 |
Net |
|
Treatments |
OC g |
ON g |
(mg 100 g-1 14 |
nitrification |
|||
(µg g-1) |
(µg g-1) |
||||||
|
1000g-1 |
1000g-1 |
days-1) |
(mg kg-1) |
|||
|
|
|
|||||
1.Control |
12.53a |
1.83a |
41.41a |
9.70a |
16.39a |
9.43a |
|
2.N60P45K45 |
12.60a |
1.90b |
75.70b |
11.24b |
16.42a |
12.46a |
|
3.N120P90K90 |
13.35b |
1.91bc |
129.79c |
11.75bc |
16.55a |
21.69b |
|
4.N180P135K135 |
13.79c |
1.98cd |
337.46d |
12.56cd |
17.66b |
34.03c |
|
5.N240P180K180 |
14.00c |
2.04d |
112.39c |
13.14d |
18.27b |
69.15d |
|
SD5% |
0.26 |
0.06 |
20.32 |
0.99 |
0.81 |
6.57 |
|
|
|
Results of autumn (01.10. 2013) |
|
|
|||
1.Control |
12.30a |
1.95a |
45.44a |
13.02ab |
11.03a |
1.81a |
|
2.N60P45K45 |
12.60a |
1.97ab |
73.59c |
15.45bc |
12.57bc |
1.22a |
|
3.N120P90K90 |
13.38b |
2.00b |
80.65d |
18.49e |
11.80ab |
2.24a |
|
4.N180P135K135 |
13.73b |
2.05c |
141.50d |
17.13cd |
12.92c |
5.59a |
|
5.N240P180K180 |
13.83b |
2.05c |
62.68b |
11.00a |
16.01d |
40.07b |
|
SD5% |
0.68 |
0.10 |
17.23 |
4.85 |
2.69 |
21.11 |
|
Regarding the total bacteria number, in spring the bacterial activity was similar in the treatments, it was balanced, while in autumn the highest activity was measured in the highest fertilized plots. Regarding the microscopic fungi in autumn higher number could
22

be developed. Among the measured four enzyme’s activity, in the highest saccharase and urease activities were measured in autumn in the treatments 5, but among the other treatments there were no significant differences.
The dehydrogenase activity obviously was larger is autumn, suggesting the higher biological activity in the soil. However the phosphatase activity was much higher in spring in all treatments, see Table 3.
Table 3.
Population dynamic and some enzyme activity from Debrecen Látókép long-term experiment (Zea mays L. triculture, non-irrigated)
Results of spring (10. 06. 2013)
|
Number |
Microscopic |
Saccharase |
Urease |
Dehydro- |
Phospha- |
|
of bacte- |
genase (INTF |
tase (P2O5 |
|||
Treatments |
fungi |
(glucose mg |
(NH4+ mg |
|||
|
ria |
(*103 g-1) |
100g-1) |
100g-1) |
µg g-1 soil |
mg g-1 |
|
*106 g-1 |
2 h-1) |
2h-1) |
|||
|
|
|
|
|||
1.Control |
4.74a |
33.70a |
4.28ab |
29.32a |
9.98ab |
15.60a |
2.N60P45K45 |
5.03a |
42.47b |
3.96a |
34.93b |
11.28bc |
17.15b |
3.N120P90K90 |
4.34a |
41.93b |
4.45ab |
41.39c |
18.33d |
18.77c |
4.N180P135K135 |
4.37a |
44.80b |
4.66b |
29.33a |
12.28c |
17.68bc |
5.N240P180K180 |
4.61a |
40.00b |
4.62b |
27.58a |
9.15a |
17.68bc |
SD5% |
0.85 |
5.90 |
0.47 |
3.43 |
1.36 |
1.38 |
|
|
Results of autumn (01.10. 2013) |
|
|
||
1.Control |
2.33a |
32.70a |
4.42ab |
29.08a |
10.48a |
9.86a |
2.N60P45K45 |
2.59a |
42.47a |
4.55b |
32.82b |
12.65b |
10.87ab |
3.N120P90K90 |
2.87a |
70.60b |
3.87a |
34.78b |
14.13c |
12.73bc |
4.N180P135K135 |
5.40b |
66.63b |
4.00ab |
35.40b |
16.05d |
13.80c |
5.N240P180K180 |
10.02c |
39.50a |
5.79b |
38.32c |
19.85e |
12.32c |
SD5% |
2.20 |
27.06 |
0.12 |
1.65 |
0.65 |
1.14 |
The C/N and MBC/MBN ratio shows the same situation, in both cases higher ratio was counted for the spring season. Similar was experienced in the MBC/OC ratio, and the CO2/MBC ratio, Table 4. Among the 19 soil parameters correlation analyses was made separately the spring and autumn result.
Table 4.
Some indexes of C and N-cycle from Debrecen Látókép long-term experiment
Results of spring (10. 06. 2013)
Treatments |
C/N |
|
MBC/MBN |
MBC/OC |
CO2/MBC |
1.Control |
6.84ab |
|
4.29a |
0.33a |
3.95d |
2.N60P45K45 |
6.62a |
|
6.78ab |
0.60b |
2.17c |
3.N120P90K90 |
6.99b |
|
11.06c |
0.97d |
1.28b |
4.N180P135K135 |
6.98b |
|
26.96d |
2.45e |
0.52a |
5.N240P180K180 |
6.87ab |
|
8.56bc |
0.80c |
1.63bc |
SD5% |
0.28 |
|
2.64 |
0.15 |
0,06 |
|
|
Results of autumn (01.10. 2013) |
|
||
1.Control |
6.31a |
|
3.49a |
0.37a |
2.43c |
2.N60P45K45 |
6.40a |
|
4.76ab |
0.58b |
1.71b |
3.N120P90K90 |
6.70b |
|
4.41a |
0.60b |
1.46b |
4.N180P135K135 |
6.71b |
|
8.27c |
1.03c |
0.91a |
5.N240P180K180 |
6.75b |
|
5.83b |
0.45b |
2.55c |
SD5% |
0.29 |
|
0.98 |
0.08 |
0.30 |
Conclusion. Moisture content of soil, six chemical and twelve microbiological properties was measured in the soil of a long-term experiment in spring and autumn, in 2013. Parallel with the increasing levels of fertilizers applied the soil pH decreased,
23
while the hydrolytic acidity increased significantly; the changes were higher in autumn. With the nutrient supply by fertilizers the mineral nutrient stock has also increased in the soil. Greater values were measured during the autumn sampling, which we can explain by the persistent dry conditions in the autumn period. The MBC, CO2-production, and net nitrification showed higher results during the spring period, parallel with the increasing fertilizer’s levels. The amount of bacteria mainly was higher in spring, while the presence of fungi was greater in autumn. In the larger fertilizer’s treatments generally a higher microbial community was determined.
Saccharase activity was exceptionally high only in one treatment. Urease activity was balanced in both sampling times. Phosphatase is predominantly has been higher in spring, while dehydrogenase activity in the autumn period. In most cases, enzyme activity values increased significantly with increasing doses of fertilizer. The smallest values of both MBC/MBN and MBC/OC ratios were in the controls and the ratios were increasing in the treatments, which demonstrates that the higher fertilization doses have increasingly positive effect rather on the C-cycle parameters, than the N-cycle parameters. The reason of this phenomenon and its effect on the environment need to be further studied. These results indicate the state of soil moisture. The water does not only influence the growth and development of plants, but the microbiological processes taking place in soil too. The extreme distribution of the rainfall can have serious influence on the soil processes.
Acknowledgements. We are grateful to Dr. Péter Pepó, professor of Institute of
Plant Sciences of DU, to give opportunity for us to analyze soil samples from long-term fertilization experiment. "The research was financed by the Higher Education Institutional Excellence Programme (20428-3/2018/FEKUTSTRAT) of the Ministry of Human Capacities in Hungary, within the framework of the 4.thematic programme of the University of Debrecen.".
References
1.Drissner D., Blum H., Tscherko D., Kandeler E. Nine years of enriched CO2 changes the function and structural diversity of soil microorganisms in a grassland // Eur. J. Soil Science, 2007. 58. 260-269.
2.Egnér H., Riehm H., Domingo W.R. Untersuchungen über die chemische Bodenanalyseals Grundlage für die Beurteilung de Nährstoffzustandes der Böden. II. K. LantbrHögsk. 1960. Ann 26. P. 199-215.
3.Felföldy L.Biológiai vízminősítés. (4. javított és bővített kiadás) Budapest. 1987. P. 172-174.
4.Frankerberger W.T. ,& Johanson J.B. Method of measuring invertase activity in soils. Plant and Soil. 1983.
74.P. 01-311.
5.Füleky Gy., Rajkainé Végh K. A talaj tápelem-szolgáltató képessége. (Ed. Füleky In: Tápanyaggazdálkodás) Mezőgazdasági Kiadó. 1999. P. 112-120.
6.Heuck C., Weig A., Spohn M. Soil microbial biomass C:N:S stoichiometry and micobial use of organic phosphorus. Soil Biology and Biochemistry. 2015. Vol. 85. P. 119-129.
7.Hickisch L., Müller G. Jr. Effect of fertilization on microorganisms in a longterm field experiment. Agrokémia és Talajtan. 1990. 39. P. 415-418.
8.Kátai J. , Zsuposné O.Á., Sándor Zs., Tállai M. Soil microbiological consequences of the stress effect of soil acidification in a long term experiment. VIII. Alps-Adria Scientific Workshop. Neum, Bosnia-Herzegovina. Cereal Research Communications. 2009. Vol. 37. Supplementum. P. 403-406.
9.Kátai J., Zsuposné O.Á., Sándor Zs., Tállai M. Comparison of soil parameters of the carbon and nitrogen cycles in a long-term fertilization field experiment. Agrokémia és Talajtan. 63. 2014, 1. 129-138.
10.Kátai J., Zsuposné O.Á. Changes in soil chemical features and microbiological characteristics connecting to carbonand nitrogen cycles in a Hungarian long-term experiment. Aspects of Applied Biology 128. (Eds. Simon P.; Barbara M. S.; Elizabeth A. S.; Christine W.). 2015. P. 225-230.
11.Matsushima M., Nagano H., Inubushi K. Global nitrogen cycling and its availability from soils. In Nitrogen Assimilation in Plants. (Ed. Ohyama T, Sueyoshi K). 2010. P. 19-32.
12.Mershi V.W. Dehydrogenase activity with the substrate INT. In.: Schinner, F., Öhlinger, R., Kandeler, E., Margesin, R. (Eds.) Methods in Soil Biology. Springer-Verlag Berlin – Heidelberg. 1996. P. 243-245.
13.Muhammed S.E. , Coleman K., Wu L., Bell A.V., Davies J.A.C., Quinton J.N., Carnell E.J.,Tomlison S.J., Dore A.J., Dragosits U. , Naden P. S., Glendining M. J., Tipping E., Whitmore A. P. Impact of two centuries of
24
intensive agriculture on soil carbon, nitrogen and phosphorus cycling in the UK. Science of the Total Environment 634. 2018. P.1486-1504.
14.Öhlinger R. Soil respiration by titration. Phosphomonoesterase activity with the substrate phenylphosphate.
In.: Schinner, F., Öhlinger, R., Kandeler, E., Margesin, R. (Eds.) Methods in Soil Biology. Springer-Verlag Berlin – Heidelberg.1996. 95-98. P. 210-213.
15.Siwik-Ziomek A., Lemanowicz J. The content of carbon, nitrogen, phosphorus and sulphur in soil against the activity of selected hydrolases as affected by crop rotation and fertilisation. Zemdirbyste-Agriculture, 2014.
Vol. 101. 4, P. 367−372.
16.Szili-Kovács T., Tilson E.L., Hopkins D.W. Promoting microbial immobilization of soil nitrogen during restoration of abandoned agricultural fields by organic addition. Biology and Fertility of Soil. 2007. 43. P. 823-828.
17.Szili-Kovács T., Zsuposné Oláh Á., Kátai J., Villányi I., Takács T. Correlation between biological and chemical properties in soils from long-term experiments. Agrokémia és Talajtan, In Hungarian, 2009. 58. P. 309-325.
18.Szili-Kovács T., Zsuposné O.Á., Kátai, J., Villányi I., Takács T. Correlations between biological and chemical soil properties in soils from long-term experiments. Agrokémia és Talajtan 60. 2011. P. 241-254.
19.Szegi J. Soil Microbiological Methods. (In Hungarian) Mezőgazda Kiadó, Budapest. 1979. P. 250-256.
20.Székely Á., Schlick B., Szabó T-né. Szerveskötésű szén fotometrikus és kolorimetrikus meghatározása. Agrokémia és Talajtan, 1960. 9. P. 111-120.
21.Tian P., Manson-Jones K., Liu S.,Wang Q.,Sun,T. Form of nitrogen deposition effects soil organic matter priming by glucose and cellulose. Biology and Fertility of Soils2019. 55. P. 383-391.
22.Vance E.D., Brookes P.C., Jenkinson D.S. An extraction method for measuring soil microbial biomass-C. Soil Biol. Biochem., 1987. 19. P. 703-707.
Я. Катай, А. Балла-Ковач, И. Ваго, М. Таллаи, А. Жупосне Олах Институт агрохимии и почвоведения, факультет сельского хозяйства, продовольствия и окружающей среды, университет Дебрецен, Венгрия
ИЗМЕНЕНИЯ СВОЙСТВ ПОЧВ ВЕНГРИИ В МНОГОЛЕТНЕМ ЭКСПЕРИМЕНТЕ ПО ВНЕСЕНИЮ УДОБРЕНИЙ
Аннотация. В ходе 30-летнего эксперимента по внесению удобрений оценивалось влияние различных доз удобрений на химические и микробиологические характеристики биологической активности чернозема. Оценивались и сравнивались образцы, отобранные в весной и осенью 2013 года. С помощью статистических методов выявляли корреляцию между параметрами. Увеличение дозы удобрения снижало уровень pH и значительно повышало гидролитическую кислотность. В почвенных образцах, отобранных осенью, была выявлена более тесная корреляция между микробиологическими параметрами, нежели в весенних.
Ключевые слова: свойства почвы, микробная биомасса C и N, эмиссия углекислого газа, нитрификация.
UDK 631.4
A. Khaledi Darvishan, F. Sedighi, B. Mahmoudi, E. Fathi Dareh Nijeh, N. Azami, H. Khodamoradi, J. Faraji, M. Khorsand, M. Derikvandi Tarbiat Modares University, Iran.
email: a.khaledi@modares.ac.ir
SOIL EROSION RESEARCH IN KHAMSAN REPRESENTATIVE AND PAIRED WATERSHEDS (KHRPW): APPROACHES AND GOALS
Abstract. Soil erosion will endanger the economic, social, political and environmental sustainability due to intraand inter-regional damages. The lack of sediment measurement data and the increasing need for soil erosion and sediment yield data have made the use
25
of erosion and sedimentation models inevitable. Experimental watersheds have been used in various countries for more than half a century to develop methods for predicting the performance of soil and water conservation techniques. In recent decades, these watersheds have also been used for educational and promotional purposes. Khamsan Representative and Paired Watersheds (KhRPW) is located in the south of Kurdistan province, west of Iran. This experimental watershed is selected as a representative for a large area of the west of Iran. In recent years a considerable number of research has been focused on soil erosion and sediment yield modelling in this watershed and some of the most important results have been presented in this paper to be used by the next researchers. In addition, the approaches and goals for the future research have been emphasized as conclusion.
Keywords: Cesium-137, Connectivity, InVEST, Representative Watersheds, Sediment Delivery Ratio.
1.Introduction. Experimental watersheds have been used in various countries for more than half a century to develop methods for predicting the performance of soil and water conservation techniques [2, 7, and 8]. Recent criticisms discounted the contribution of experimental watersheds to the science of hydrology and to watershed management. The critics cite as disadvantages the cost of experimental watersheds, their unrepresentativeness, leakiness, difficulty in applying results to other areas, and the lack of progress in basic knowledge about hydrology processes [3]. In this regard, soil erosion researchers around the world have identified a need for engaging experimental watersheds with water discharge and sediment concentration measurement stations in various scales including at the outlet of a plot, a hillslope, a sub-watershed and even the whole watershed. After decades of sampling and data collecting and analysis, researchers can be able to generalize the results of representative watersheds to the whole similar watersheds in a region and this is one of the main goals of selecting and engaging the representative watersheds.
Khamsan Representative and Paired Watersheds (KhRPW) is located in the west of the country, where the Zagros Mountains in combined with the socio-economic conditions have created the unique landscapes. Considerable coverage of the rainfed lands, with the tillage lines parallel with the main slope direction, increases the soil erosion rate in this area and these conditions needs more and more details to be known. The present study is therefore in line with this need and is the results of about 10 years of data collecting and analysis in KhRPW. Research methods for evaluating watersheds have generally followed three basic approaches including runoff plots, paired watersheds, and single watershed methods [10]. Two of these approaches including erosion plots and paired subwatersheds have been used in KhRPW.
2.Study Area. The Khamsan watershed with an area of 4,336 hectares is located in Kurdistan Province in western part of Iran (Figure 1). Two control and treated subwatersheds, called paired sub-watersheds, have been selected in south west of the watersheds with the maximum possible similarities in natural and anthropogenic conditions including area, topography, geology, pedology and land use and land cover characteristics. The only considerable difference between control and treated sub-watershed is the soil conservation projects that have been studied and implemented in treated sub-water- shed to show and study the effects of measures on runoff, soil erosion and sediment yield. A climatological weather station is located inside the watershed close to the control subwatershed to measure all the climatological variables at the same time intervals for runoff measurement in the hydrometric stations (10 min). A pluviograph station has also been placed in the average elevation of the paired sub-watersheds to study the precipitation
26
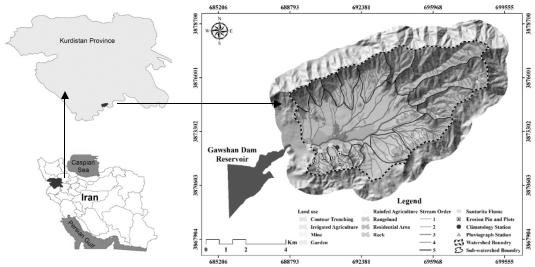
gradient in the watershed more accurately. The base map of the watershed is shown in Figure 1.
The mean elevation and slope of the watershed are 1840 m and 25.11%, respectively. Although the slopes in the watershed upstream branches and sub-watersheds have high gradient, 48% of watershed is a plain with slope gradient <20%. This area of 1,323 hectares occupy the middle part of the watershed (Figure 1). The main lithology units of the watershed are gray to red conglomerates, alluvial deposits and also limestone which covers about 49, 30 and 6% respectively. The average annual air temperature and precipitation are 12.5 °C and 428 mm, respectively.
3. Soil Erosion Research
3.1 Soil erosion measurements and estimations. The sediment measurements at the outlet of Khamsan experimental watershed and also paired sub-watersheds is done by Forests, Range and Watershed Management Organization as well as some universities for research purposes. The average sediment yield for Khamsan experimental watershed and control sub-watershed were 0.328 and 1.812 ton ha-1 year-1, respectively.
Figure 1. Location of Khamsan Representative and Paired Watersheds
(KhRPW) in Iran
Sediment measurement in check dam reservoirs has been also done in KhRPW. In order to measure the volume of sediments behind the number of 95 check dams, the field measurements including upper and lower width and the length of the dead volume of the reservoir were done for each dam. The volume of deposited sediment behind each check dam was calculated using geometric method and converted to the mass of sediments considering the specific mass measured in laboratory. In the next step, for each of the measured values of bed load the equivalent amount of suspended load was obtained by using Karaushev diagram and finally the total sediment load was calculated for the upstream basins of each check dam. The results of sediment measurement showed that the minimum, maximum and average sediment yield for the watersheds upstream of the check dams was 0.01, 2.93 and 1.12 ton ha-1 yr-1, respectively.
Despite the efforts to suspended and bed sediment measurements, the increasing need for soil erosion and sediment yield data specially the distributed data and maps have made the use of erosion and sedimentation models inevitable [4]. Therefore the maximum outflow and soil erosion intensity were predicted for Khamsan representative watershed
27
using IntErO model. The estimated net soil loss from the watershed was 12263.44 m3year- 1, specific 282.81 m3km-2year-1. The strength of the erosion process is strong, and according to the erosion type, it is surface erosion [4].
The RUSLE model was then used to predict monthly, seasonal and annual soil loss for all sub-watersheds. The annual soil loss prediction of RUSLE model was compared with the soil erosion measurements using erosion pins and plots. The sediment delivery ratio (SDR) was then calculated through dividing total sediment load and erosion of the watershed resulted from three methods of RUSLE, erosion pins and plots. Results indicated that in plot method, the erosion generalized to the whole watershed (0.06 t ha-1 y-1) was much lower than reality and therefore, SDR was overestimated (655%). In erosion pin method, the erosion generalized to the whole watershed (76.79 t ha-1 y-1) was much more than reality and therefore, SDR was underestimated (0.51%). Whereas in RUSLE method, SDR was estimated more acceptably (2.21%) and estimated soil erosion by model (18.53 06 t ha-1 y-1) was clearly closer to reality. Therefore, generalizing the results of erosion pins and plots considering only the area ratio, cannot be a suitable estimate of erosion to the whole watershed. Investigating watershed topography showed that low-slope area in the middle and downstream probably is the main factor of sediment trapping and decreasing sediment transport ratio to the watershed outlet [6].
The WaTEM/SEDEM has been used to provide a distributed map of soil erosion as well as the sediment transport [11]. However, in the estimation of sediment transport capacity in the SEDEM sub-model, the sediment transport capacity coefficient (Ktc) is the most important possibility to calibrate the WaTEM/SEDEM model, which was carried out for one year using observed sedimentation data at the outlet of Khamsan watershed. The results showed that the soil loss ranged from 0 to 58.233 t ha-1 y-1, with the average of 11.58 t ha-1 y-1. Finally, the annual sediment transport capacity was obtained to be -1.72 to 13.66 t ha-1 y-1, with an average of 2.54 t ha-1 y-1. The results of estimations of SDR showed that
the average SDR was 19.35% for the entire watershed.
At the next steps of the research, the 137Cs method has been used to study the average soil loss, sediment redistribution and SDR of the watershed in sampling points especially in various land uses. The main focus of this part of the project was to study the effect of geomorphological characteristics on sediment budget in Khamsan watershed. In order to achieve these purposes, a distribution map of erosion and deposition was prepared using 137Cs in all sub-watersheds. The results showed that the average SDR in high slope sub-watersheds was 28.43%, which decreased to 12.63% by increasing the area to the whole watershed. This finding reflects the interaction effects of the area and slope on the reduction of SDR by increasing the trapping and redistribution of sediment. The distributed map of soil erosion/deposition and also the sediment budget with the contribution of various land uses in soil erosion and sediment redistribution in Khamsan watershed are shown in Figures 2.
3.2 Sediment redistribution and sediment delivery ratio (SDR). In the next step of the research, the empirical models based on easy to obtain variables, original and localized versions of forest service sediment delivery index model and SATEEC and InVEST computer models have been used in Khamsan watershed. The results of 137Cs method and also the ratio of observed sediment to erosion derived from the RUSLE model in previous studies shows that the acceptable range for SDR in Khamsan watershed is expected to be 10-15%. Among the studied methods, the Renfro, Boyce-A, USDA-SCS and Boyce-B methods had the estimates between 10-15% and selected as the suitable models to be used in the study watershed. The results also showed that the localized version of the forest service sediment delivery index model with fewer and much simpler inputs including area, slope steepness, drainage density and rainfed agricultural lands, provided more acceptable results than the
28
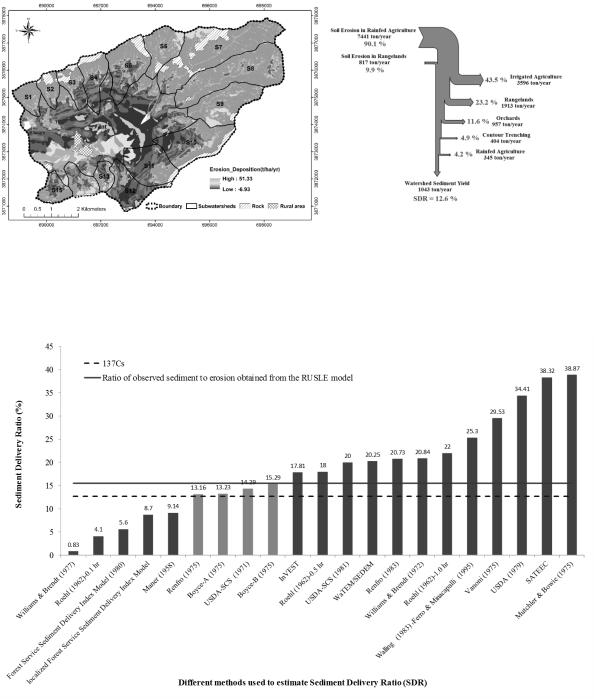
original model. The results of all methods used to estimate SDR compared with the 137CS method and ratio of observed sediment to erosion derived from the RUSLE model in Khamsan watershed are shown in Figure 4.
Figure 2. The distributed map of soil erosion/deposition in KhRPW (left) and Watershed sediment budget considering the contribution of various land uses in soil erosion and sediment redistribution in KhRPW (right)
Figure 4. The results of all methods used to estimate SDR in KhRPW
3.3 Index of connectivity (IC). The distributed map of structural sediment connectivity in Khamsan watershed was prepared using SedInConnect software [1]. The results showed that the structural sediment connectivity have been higher in the streams surrounding areas and the western and northwestern hillslopes of the basin. In addition to the relatively high slope angle for the hillslopes, the reason is the closeness of these areas
29