

920
.pdfPhosphorus cycling processes in soil-plant system - involved dissolution-precipi- tation, adsorption-desorption, mobilization-immobilization, plant absorption processes - are rather complicated because of many influencing factors [8][9] [2].The P fertilizers contain soluble phosphate which is initially plant available, but after application becomes progressively less available because of adsorption, precipitation or conversion to the organic form [14][7]. The interrelationshipsbetween different soil phosphorus forms is highly depends on soil properties[3].In order to achieve sustainable agricultural management and reduce the risks associated with P loss from high fertility soils [6], it is necessary to maintainplant-available P in soil at required levels and use P fertilizers more efficiently. It is essential to follow up how the different phosphorus forms(soluble, weakly, tightly sorbed) changes on different soil types.
Here we present soil pre-incubation and pot experiment study where increasing P doses, different pre-incubation times and two significantly different soil types were investigated. The objectives were to gain information about P sorption processes on Chernozem and Arenosol in soil-plant system and to assess the effects of different P doses and pre-incubation times on the plant biomass production and the P uptake of plant.
Materials and methods.The effects of pre-incubation with increasing P doses in soil-plant system was studied on Chernozem (pH(H2O)=6.59; pH(KCl)=5.57; Humus%=2.38; Clay and Silt%=44.26; CaCO3%=0; AL-P2O5 (mg/kg)=83.4; AL-K2O (mg/kg)=207.9; total P (digestion with H2SO4) (mg/kg)=925) and Arenosol (pH(H2O)=8.25; pH(KCl)=7.4; Humus%=0.81; Clay and Silt%=5.15; CaCO3%=1.24; AL-P2O5 (mg/kg)=336.8; AL-K2O (mg/kg)=62.9; total P (digestion with H2SO4) (mg/kg)=925). Experimental soils were collected from the upper layer (0-30 cm) of agricultural areas of Hungary (Debrecen-Látókép and Őrbottyán).
Chernozem and Arenosol were weight into experimental pots (3 kg) and were incubated at room temperature for 1, 3 and 13 weeks with increasing dose of KH2PO4 solution, containing 0, 40, 80, 160, 320 mg P/kg soil, respectively. The soil was kept at constant moisture (at 60% of the water-holding capacity) using daily weighing with ion exchanged water.
After 1, 3 and 13 weeks of soil incubation, pot experiment wasset up with preincubated soils. As test plant ryegrass (Lolium Perenne L.) was sown. Ion exchanged water was added to all pots to keep the soil at constant moisture, the 60% of the waterholding capacity, using daily weighing. Ryegrass were cut twice, 5 and 9 weeks after sowing. The 1st and 2nd increments of plant biomass were collected and dried at 60Co. Total dry biomass were determined. Ryegrass were digested by HNO3-H2O2 methods and the total phosphorus content of plant was determined by EN ISO 6878. Phosphorus uptake of plants also was calculated.Concentration of available soil phosphorus were determined in ammonium lactateacetic acid (AL) extract [4]. AL soluble P was measured by molybdenum blue colorimetric method.
Analysis of variance (one-way ANOVA) was carried out on the data in order to provide a statistical comparison between the treatment means. The least significant difference (LSD) test (P=0.05) was used to detect differences between means.
Results and Discussions
The biomass production of ryegrass
The dry biomass production of first, second cuts and total dry biomass production of ryegrass grown on Chernozem and Arenosol are given in Figs.1, 2.
The biomass production of ryegrass grown in Chernozem was much higher and ranged between 8.05-9.55 g*pot-1. The values of Arenosol were lower, 1.9-3.4 g*pot-1. The better fertility of Chernozem resulted in higher biomass production of ryegrass. As it was expected the biomass of second cut was lower in both soil types because of the decreasing
160
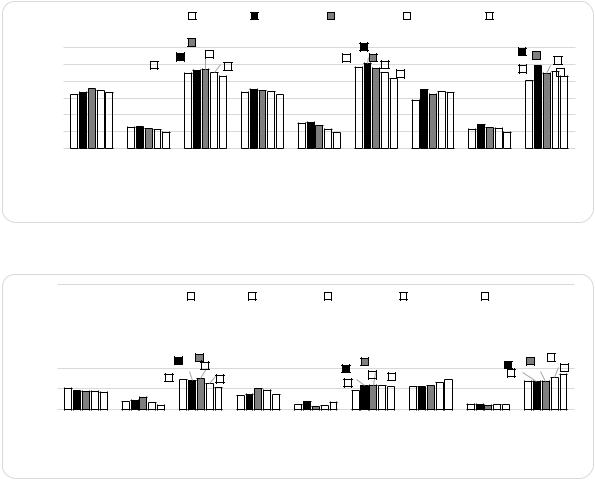
nutrient availability of soils. The effect of increasing P doses on the plant biomass production was different and was dependent on the pre-incubation periods. The 40 and 80 mgP/kg doses slightly increased the yield in Chernozem, but in Arenosol, where the original P availability of soil was higher AL-P2O5=336.8mg/kg, these lower P doses did not cause any yield response.
|
control |
40mgP/kg |
80mgP/kg |
160mgP/kg |
320mgP/kg |
|
|
|
acde |
|
e |
|
deabcd |
||
|
cde |
bcd |
|
||||
|
de de |
||||||
abcd |
|
abc |
|
bcd |
|||
|
|
|
bcd |
a |
abc |
||
|
|
|
|
|
ab |
||
g*pot-1
Fig. 1 The dry biomass production of ryegrass grown in Chernozem
g*pot-1
*Means with the same letter are not significantly different at P =0.05
control |
|
40mgP/kg |
|
80mgP/kg |
160mgP/kg |
320mgP/kg |
|
|
|||||
|
|
|||||
|
|
|
|
|
|
|
|
|
|
|
|
|
|
|
|
|
|
|
|
|
abc bc |
abc |
abc bc |
|
||
|
abc |
abc |
abcab |
abc |
c |
a… |
ab |
abc |
|||
|
|
a |
|
|
|
Fig. 2 The dry biomass production of ryegrass grown in Arenosol
*Means with the same letter are not significantly different at P =0.05
The effect of extra high, 320 mgP/kg dose was strongly dependent on pre-incuba- tion period. At 1, 3 weeks slightly decreased the yield, however at 13 weeks of pre-incu- bation caused small yield increase in both soil types. The 13 weeks seemed to be long enough for phosphate sorption (tightly) and transforming to not available form which did not cause yield decreasing effect[12].
P content and P uptake of ryegrass
The changes of plant P is a very good indicator of the quantity of available P content of soil. The P concentration of ryegrass of first and second cuts grown on Chernozem and Arenosol are given in Figs.3,4.
As it was expected, the P concentration of second cut was higher, as this biomass became lower. The effect is called “effect of concentrating” [1], [13].
161

The P concentration of plant enhanced with increasing of P doses in all cases, but this increment became smaller and smaller with the length of pre-incubation caused by increasing rate of tightly sorbed P.
control |
|
40mgP/kg |
|
80mgP/kg |
160mgP/kg |
320mgP/kg |
|
|
|||||
|
|
|||||
|
|
|
|
|
|
|
P%
Fig. 3.The P concentration of plant grown in Chernozem
|
1,000 |
|
|
|
|
control |
|
40mgP/kg |
|
|
80mgP/kg |
160mgP/kg |
|
320mgP/kg |
|
|
|
|
|
|
||||||||||||||||||||||||
|
|
|
|
|
|
|
|
|
|
|
|
|
|
|
||||||||||||||||||||||||||||||
|
|
|
|
|
|
|
|
|
|
|
|
|
|
|
||||||||||||||||||||||||||||||
|
|
|
|
|
|
|
|
|
|
|
|
|
|
|
|
|
|
|
|
|
|
|
|
|
|
|
|
|
|
|
|
|
|
|
|
|
|
|
|
|
|
|
|
|
|
0,800 |
|
|
|
|
|
|
|
|
|
|
|
|
|
|
|
|
|
|
|
|
|
|
|
|
|
|
|
|
|
|
|
|
|
|
|
|
|
|
|
|
|
|
|
|
|
|
|
|
|
|
|
|
|
|
|
|
|
|
|
|
|
|
|
|
|
|
|
|
|
|
|
|
|
|
|
|
|
|
|
|
|
|
|
|
|
|
|
|
P% |
0,600 |
|
|
|
|
|
|
|
|
|
|
|
|
|
|
|
|
|
|
|
|
|
|
|
|
|
|
|
|
|
|
|
|
|
|
|
|
|
|
|
|
|
|
|
0,400 |
|
|
|
|
|
|
|
|
|
|
|
|
|
|
|
|
|
|
|
|
|
|
|
|
|
|
|
|
|
|
|
|
|
|
|
|
|
|
|
|
|
|
|
|
|
|
|
|
|
|
|
|
|
|
|
|
|
|
|
|
|
|
|
|
|
|
|
|
|
|
|
|
|
|
|
|
|
|
|
|
|
|
|
|
|
|
|
||
|
|
|
|
|
|
|
|
|
|
|
|
|
|
|
|
|
|
|
|
|
|
|
|
|
|
|
|
|
|
|
|
|
|
|
|
|
|
|
|
|
|
|
|
|
|
0,200 |
|
|
|
|
|
|
|
|
|
|
|
|
|
|
|
|
|
|
|
|
|
|
|
|
|
|
|
|
|
|
|
|
|
|
|
|
|
|
|
|
|
|
|
|
0,000 |
|
|
|
|
|
|
|
|
|
|
|
|
|
|
|
|
|
|
|
|
|
|
|
|
|
|
|
|
|
|
|
|
|
|
|
|
|
|
|
|
|
|
|
|
|
|
1. cut |
2. cut |
|
|
|
1. cut |
|
2. cut |
|
|
1. cut |
2. cut |
|
|||||||||||||||||||||||||||||
|
|
|
|
|
|
|
|
|
|
|
||||||||||||||||||||||||||||||||||
|
|
|
|
|
|
|
1 week |
|
|
|
|
|
|
|
|
|
|
|
3 weeks |
|
|
|
|
13 weeks |
|
|
|
|
|
|
||||||||||||||
|
|
|
|
|
|
|
|
|
|
|
|
|
|
|
|
|
|
|
|
|
|
|
|
|
|
|
|
|
|
|
|
|
|
|
|
|
|
|
|
|
|
|
|
|
Fig. 4.The P concentration of plant grown in Arenosol
The P concentration of plant grown in Arenosolwas lower compared to Chernozem, except for values of plants of the second cut at 13 weeks of pre-incubation, where values of Arenosol became higher. This change indicates that the P availability of Chernozem decreased to a greater extent with increasing of pre-incubation compared to Arenosol.
The assumption of decreasing amount of available P with increasing of pre-incu- bation of soil is also supported by the data of P uptake of plant (Fig 5).
uptaken P mg/gplant/kgsoil
|
|
|
|
|
|
|
0 mg/kg |
|
|
|
40 mg/kg |
|
|
80 mg/kg |
160 mg/kg |
|
320 mg/kg |
|||||||||||||||||||||||
|
|
|
|
|
|
|
|
|
|
|
|
|||||||||||||||||||||||||||||
|
|
|
|
|
|
|
|
|
|
|
|
|||||||||||||||||||||||||||||
|
|
|
|
|
|
|
|
|
|
|
|
|
|
|
|
|
|
|
|
|
|
|
|
|
|
|
|
|
|
|
|
|
|
|
|
|
|
|
|
|
|
|
|
|
|
|
|
|
|
|
|
|
|
|
|
|
|
|
|
|
|
|
|
|
|
|
|
|
|
|
|
|
|
|
|
|
|
|
|
|
|
|
|
|
|
|
|
|
|
|
|
|
|
|
|
|
|
|
|
|
|
|
|
|
|
|
|
|
|
|
|
|
|
|
|
|
|
|
|
|
|
|
|
|
|
|
|
|
|
|
|
|
|
|
|
|
|
|
|
|
|
|
|
|
|
|
|
|
|
|
|
|
|
|
|
|
|
|
|
|
|
|
|
|
|
|
|
|
|
|
|
|
|
|
|
|
|
|
|
|
|
|
|
|
|
|
|
|
|
|
|
|
|
|
|
|
|
|
|
|
|
|
|
|
|
|
|
|
|
|
|
|
|
|
|
|
|
|
|
|
|
|
|
|
|
|
|
|
|
|
|
|
|
|
|
|
|
|
|
|
|
|
|
|
|
|
|
|
|
|
|
|
|
|
|
|
|
|
|
|
|
|
|
|
|
|
|
|
|
|
|
|
|
|
|
|
|
|
|
|
|
|
|
|
|
|
|
|
|
|
|
|
|
|
|
|
|
|
|
|
|
|
|
|
|
|
|
|
|
|
|
|
|
|
|
|
|
|
|
|
|
|
|
|
|
|
|
Figure 5. The P uptake of plant (mg P by 1 g plant from 1 kg soil) grown in Chernozem and Arenosol by different treatments
The phosphorus uptake of ryegrass from the added phosphorus was lower in Arenosol than in Chernozem and decreased with increasing incubation time as the available P content of soils reduced and became the lowest at 13 weeks in both soil types. The AL-P2O5 of soil measured at the end of pot experiment is summarised in Table 1.
162
Our results show that after plant growing the available phosphorus still was higher in the treated pots compared to control and increased with increasing P doses. In Chernozem this increase was much lower compared to values of Arenosol. AL-P2O5 did not change with increasing pre-incubation periods in Arenosol, but sharply fell in Chernozem indicating the higher P sorption in this soil type in time.
|
|
|
|
|
|
|
Table 1. |
|
The AL-P2O5 content of soils at the end of pot experiment |
|
|||||
|
|
Chernozem |
Arenosol |
Chernozem |
Arenosol |
Chernozem |
Arenosol |
|
|
1 week |
1 week |
3 weeks |
3 weeks |
13 weeks |
13 weeks |
control |
|
31,14 |
183,7 |
33,54 |
182,3 |
30,90 |
183,7 |
40mgP/kg |
|
51,33 |
204,4 |
53,02 |
205,1 |
38,59 |
204,4 |
80mgP/kg |
|
84,75 |
235,5 |
84,75 |
238,8 |
42,92 |
235,5 |
160mgP/kg |
|
148,23 |
281,2 |
159,77 |
303,7 |
65,52 |
281,2 |
320mgP/kg |
|
296,58 |
439,2 |
304,51 |
424,2 |
116,97 |
439,2 |
Conclusion. The 40 and 80 mg P/kg doses slightly increased the yield in Chernozem, but in Arenosol, where the original P availability of soil was higher did not cause any yield response. The effect of 320 mg P/kg dose was strongly dependent on pre-incubation period. At 1, 3 weeks of pre-incubation slightly decreased the yield, but at 13 weeks caused small yield increase in both soil types. The P concentration of plant grown in Arenosol was lower compared to Chernozem, except for values of plants of the second cut at 13 weeks of preincubation, where values of Arenosol became higher. The phosphorus uptake of ryegrass was lower in Arenosol and decreased with increasing incubation time as the available P content of soils reduced and became the lowest at 13 weeks in both soil types.
The pre-incubation did not alter the AL-P2O5 in Arenosol, but with increasing preincubation time, the AL-P2O5 fell sharply in Chernozem indicating the higher P sorption in this soil type. The P availability in Chernozem decreased to a greater extent with increasing of pre-incubation compared to Arenosol.
Acknowledgements.This publication was supported by the Hungarian National Research, Development, and Innovation Office [NKFIH K 120265]; The work was co-financed by the European Union and the European Social Fund.(EFOP-3.6.3-VEKOP-16-2017- 00008)and Establishing a scale-independent complex precision consultancy system (GINOP- 2.2.1-15-2016-0001)”projects.
References
1.Bergmann W.: 1999. ErnährungsstörungenbeiKulturpflanzen.Farbatlas. VEG G. Fischer Verlag, Jena
2.Dalai, R.C. : 1977. Soil organic phosphorus, Advances in Agronomy, Volume 29, 1977, P. 83-117. 3.Djodjic F., Börling K., Bergström L. Phosphorus leaching in relation to soil type and soil phosphorus content.Journal of Environment Quality, 2004. 33(2), 678.
4.Egnér H., Riehm H., Domingo W.R. Untersuchungenüber die chemischeBodenanalysealsGrundlagefür die Beurteilung de Nährstoffzustandes der Böden. II. K. LantbrHögsk. Ann 26. 1960. Pp. 199-215.
5.Frossard E., Condron L.M., Oberson, A., Sinaj S., Fardeau J.C. Processes governing phosphorus availability in temperate soils.Journal of Environment Quality, 2000. 29 (1). 15.
6.Heathwaite A.L., Fraser A.I., Johnes P.J., Hutchins M., Lord E., Butterfield D. Soil Use and Management, 2003. 19.1-11.
7.Holford, ICR.: 1997. Soil phosphorus: its measurement, and its uptake by plants. Aust J Soil Res 35:227–239. 8.Laverdiere M.R., Karam A. Sorption of phosphorus by some surface soils from Quebec in relation to their properties. Commun. Soil Sci. Plant Anal. 1984. 15. P:1215–1230.
9.Lynch J. P. Root phenes for enhanced soil exploration and phosphorus acquisition: tools for future crops, Plant Physiology, 2011. Pp. 1041-1049.
10.Mandal, S. C.: 1978. Phophorus management of our soils. Need for a more rational approach. 40th Sess. Indian Soc. of Soil Sci., Bhubaneswar
11.Mengel K., Kirkby E.A. 1987. Principles of plant nutrition, International Potash Institute, 1987. Pp. 404. 12.Parfitt R.L. Anion adsorption by soils and soil materials. Adv. Agron. 1978. 30. P. 1-50.
13.Schilling G. Pflanzenernährung und Düngung.Verlag Eugen Ulmer, Stuttgart. 2000.
163
14.Sundara B.V., Natarajan K.H. Influence of phosphorus solubilizing bacteria on the changes in soil available phosphorus and sugarcane and sugar yields, Field Crops Research, 2002. Volume 77. Issue 1. August 2002. P. 43-49.
А. Балла-Ковач, Я. Катай, И. Ваго, Э. Юхас, Н. Наги, Й. Конья Дебреценский университет Дебрецен, Венгрия
ВЛИЯНИЕ ВОЗРАСТАЮЩИХ ДОЗ ВНОСИМОГО ФОСФОРА И ИНКУБАЦИОННОГО ПЕРИОДА ПОЧВЫ
НА УРОЖАЙНОСТЬ БИОМАССЫ И ПОГЛОЩЕНИЕ ФОСФОРА ПЛЕВЕЛОМ (LOLIUM PERENNE L.)
Аннотация. Вегетационный опыт был проведен с целью прослеживания влияния различного инкубационного периода почвы и возрастающих доз вносимого фосфора на рост и поглощение фосфора растениями на песчаных почвах и черноземах. При увеличении доз вносимого фосфора (0, 40, 80, 160, 320 мг P/кг почвы) почвы инкубировали в течение 1,3 и 13 недель до начала тепличного вегетационного опыта с плевелом. Срез плевела в качестве испытуемого растения производили дважды: на 5 и 9 неделю после посадки. Измерены урожайность сухой биомассы, концентрация фосфора, поглощение фосфора плевелом и AL-P2O5 почвы. Влияние увеличения доз вносимого фосфора на урожайность биомассы растения зависело от доз фосфора и инкубационного периода почвы. Фосфор, вносимый в дозах 40 и 80 мг P/кг, незначительно увеличил урожай на черноземной почве и не оказал никакого эффекта на урожай песчаной почвы. Доза 320 мг P/кг незначительно снизила урожай в 1, 3 неделю инкубации, в то же время вызвала незначительное увеличение урожая в 13 неделю на обоих типах почвы. Концентрация фосфора и поглощение фосфора растением в песчаной почве были ниже по сравнению с черноземом, за исключением растений второго среза в 13 неделю инкубационного периода, где эти же показатели на песчаной почве были выше. Это изменение указывает на то, что доступность фосфора в черноземе снижалась в большей степени с увеличением времени инкубационного периода по сравнению с песчаной почвой. Уровень ALP2O5 в песчаной почве не изменялся с увеличением времени инкубационного периода, но резко снижался в черноземе, что указывает на различную сорбционную способность фосфора этого типа почвы.
Ключевые слова: инкубация почвы, вегетационный опыт, урожай, поглощение фосфора.
UDC 631.4
I. Vágó, A. Balla Kovács, J. Kátai
University of Debrecen, Faculty of Agricultural and Food Sciences and Environmental Management,
Institute of Agricultural Chemistry and Science H-4032 Debrecen, Böszörményi Street 138, Hungary e-mail: vago@agr.unideb.hu
NITROGEN AND CARBON FORMS ANALYSIS IN SOME SOIL TYPES
OF EASTERN HUNGARY
Abstract. A significant part of the soil’s nitrogen and carbon content can be found in the form of organic compounds. Nutrients become available for the plants by the mineralization processes of organic compounds. The transformation of nitrogen and carbon is
164
closely related, since the decomposition of organic materials has an effect on both of them. To gain a better knowledge of the nutrient supply of different soils, the amount of some N and C forms were examined in 12 extremely different soil types in Eastern Hungary. The analysis of the soils’ carbon content and the amount of specific carbon forms is necessary because the transformation of carbon compounds is related to the N cycle; this has primary importance in the nutrient supply of plants. The total carbon content of soils was measured by a CNS element analyser. Similarly to other soil parameters, it ranged between wide boundaries: 0.34% in brown forest soil with alternating thin layers of clay (“kovárvány”), and 7.20% in marshy meadow soil.
The organic carbon content measured according to Tyurin also varied greatly: 0.26% in brown forest soil with alternating thin layers of clay and 1.77% chernozem-like meadow soil and marshy meadow soil. Among the nitrogen forms having a primary role in plant nutrition, the total N content was measured by a CNS analyser. The extreme values of its content were 0.043% in brown forest soil with alternating thin layers of clay and 0.473% in solonchak-solonetz. The tenfold difference demonstrates that the examined soil types were also very different in this respect, too. The 0.01 M CaCl2 solution extractable organic compounds correspond to the total organic compounds which potentially easily mineralise, therefore, they play an important role in the available nutrient supply of soils as well as in plant nutrition. The CaCl2 soluble total N content was highest on marshy meadow soil (1.46 mg/kg), which is 16 times higher than the lowest on humus sand (0.09 mg/kg). The total N extracted by CaCl2 was between 9.21 mg/kg (calcareous chernozem), and 0.80 mg/kg (humus sand).
Key words: nitrogen, carbon, content, forms, soils
Introduction
Evaluating the nutrient supply of plants, the directly available inorganic nutrients are of primary importance. Besides the amount of nutrients, the nutrient supply of plants is significantly influenced by the type of the chemical bond in which the nutrient can be found. A considerable proportion of the soil’s carbon and nitrogen content can be found in the form of organic compounds, which are not directly utilizable. As a result of the breakdown of organic compounds, nutrients become available for the plants. Numerous processes are known which effect the nutrient forms in the soils [1].
The amount of nitrogen and carbon forms in the soils changes with the transformation of organic materials. The transformation of the two elements is closely related, since the breakdown of organic materials has an effect on both [6].
By reducing the use of artificial fertilizers, the importance of the natural nutrient supply of the soil increases. We have proved that even under intensive fertilizing the original N content of the soil greatly contributes to the N supply of the plant [5]. The longer time passes after fertilization, the higher the significance of the soil’s original N content is.
According to our experiments with 15N isotope, 24-38% of the nitrogen taken up by the plants originates from the soil’s original N content in Hungary [2], while this value ranged between 15 and 23% on German soils [5].
The element contents and the amount of the specific nutrient forms greatly differ on different soils. Therefore, it is advisable to carry out the analyses on several soil types.
Material and methods
The examinations were done on 12 extremely different soil types collected in Eastern Hungary in four replications (Table 1). The basic physical and chemical parameters of the soils were determined (Table 2). Knowledge of these is essential, since they have primary importance in the carbon and nitrogen cycle.
165
Table 1
Type, location and vegetation of the soils examined
Number and type of soils |
Location |
Vegetation |
||
1. |
Calcareous chernozem soil |
Debrecen, Látókép |
winter wheat |
|
2. |
Chernozem meadow soil |
Debrecen, Látókép |
winter wheat |
|
3. |
Meadow solonetz |
Hortobágy |
natural grassland |
|
4. |
Chernozem-like meadow soil |
Hajdúböszörmény |
winter wheat |
|
5. |
Typical meadow soil |
Hajdúböszörmény |
winter wheat |
|
6. |
Humus sand soil |
Pallag |
oak forest |
|
7. |
Humus sand soil |
Pallag |
orchard |
|
Brown forest soil with alternating thin layers |
Pallag |
orchard |
||
of clay substance (kovárvány) |
||||
|
|
|||
9. |
Marshy meadow soil |
Debrecen, Dombos tanya |
natural grassland |
|
10. |
Brown forest soil (Ramman type) |
Pocsaj |
natural grassland |
|
own forest soil with clay illuviation |
Pocsaj |
natural grassland |
||
12. |
Solonchak-solonetz soil |
Pocsaj |
natural grassland |
|
The total carbon, nitrogen and sulphur contents of soils were measured with an Elementar Vario EL (Hanau, Germany) element analyser. The organic carbon content was measured according to Tyurin with destruction method, while the nitrogen content was determined by Kjeldahl’s method.
The easily soluble nitrogen forms were determined from a 0.01 M CaCl2 extract. 5 g soil samples were shaken for 2 hours with 50 cm3 of extracting solution, then the amount of N forms was determined from the filtrate with a Skalar contiflow photometer [4]. For measuring the total extractable N content, the soluble organic N compounds mixed with K2S2O8 were put into an UV destructor, where the organic N turned into nitrite and nitrate, so it was measured with the Gries-Ilosvay method. The extracted organic N content was calculated by differential method from the total and the inorganic N content [3].
Results
Soils with extremely different characteristics were chosen for the experiment. The basic physical and chemical parameters are shown in Table 2. The extreme values for the main parameters were as follows: Plasticity index 26 (humus sand, 7) - 55 (typical meadow, 5); saline content: 0.002% (brown forest soil with alternating thin layers of clay substance ”kovárvány”, 8) - 0.059% (solonchak-solonetz, 12); pH value in CaCl2: 4.04 (brown forest soil with alternating thin layers of clay, 8) - 8.13 (solonchak-solonetz, 12). In half of the soils hydrolytic acidity could be measured, while four soils contained carbonate.
The total carbon and nitrogen content of soils measured by element analyser and the organic carbon content determined by Tyurin’s method are included in Table 3.
The total carbon content of the soils (similarly to other parameters) varied greatly, the smallest content (0.34%) was measured in brown forest soil with alternating thin layers of clay (8), while the highest (7.2%) was obtained in marshy meadow soil (9). The organic carbon content measured according to Tyurin with destruction method also varied greatly, the values were: 0.26% in brown forest soil with alternating thin layers of clay
(8) and 1.77% in chernozem meadow soil (4) and in marshy meadow soil (9). The extremely high total C content of marshy meadow soil (9) was due to the very high CaCO3 content of the soil besides its high organic C content (1.75%).
166
|
|
|
|
|
|
|
|
|
Table 2 |
|
|
|
Main parameters of the soils examined |
|
|
|
|||||
Number |
Physical soil |
Plasticity |
|
pH value in |
|
y1 |
CaCO3% |
Salt% |
|
|
|
type |
index, KA |
H2O |
KCl |
|
CaCl2 |
|
|
|
|
1. |
loam |
46 |
6.13 |
5.45 |
|
5.91 |
7.85 |
- |
0.039 |
|
2. |
clayey loam |
51 |
7.74 |
7.19 |
|
6.90 |
- |
1.25 |
0.041 |
|
3. |
clayey loam |
54 |
5.92 |
5.11 |
|
5.50 |
8.19 |
- |
0.049 |
|
4. |
clay |
52 |
6.40 |
5.29 |
|
5.65 |
11.2 |
- |
0.022 |
|
5. |
clayey loam |
55 |
6.58 |
5.46 |
|
5.86 |
7.6 |
- |
0.025 |
|
6. |
sand |
38 |
6.79 |
6.02 |
|
6.07 |
5.07 |
- |
0.05 |
|
7. |
sand |
26 |
7.23 |
6.49 |
|
6.35 |
- |
- |
0.003 |
|
8. |
sand |
28 |
5.38 |
4.04 |
|
4.62 |
8.16 |
- |
0.002 |
|
9. |
clayey loam |
58 |
7.60 |
7.27 |
|
6.98 |
- |
26.7 |
0.022 |
|
10. |
loam |
50 |
7.34 |
6.77 |
|
6.90 |
- |
0.21 |
0.028 |
|
11. |
clayey loam |
45 |
7.12 |
6.32 |
|
6.51 |
- |
- |
0.011 |
|
12. |
clayey loam |
48 |
9.53 |
8.13 |
|
7.75 |
- |
1.8 |
0.059 |
|
Table 3
Total nitrogen and carbon contents measured by element analyser and organic carbon contents (Tyurin) of the examined soils
Number |
Total content measured by ele- |
Total C/total N |
Organic carbon |
Organic C/total |
|
|
ment analyser |
proportion |
(Tyurin),% |
C% proportion |
|
|
|
|
|
|
|
|
carbon (%) |
nitrogen (%) |
|
|
|
|
a |
b |
a/b |
c |
100*c/a |
1. |
1.930 |
0.206 |
9.35 |
0.97 |
50.3 |
2. |
2.236 |
0.216 |
10.33 |
0.92 |
41.1 |
3. |
3.117 |
0.326 |
9.55 |
1.37 |
44.0 |
4. |
4.012 |
0.329 |
12.21 |
1.77 |
44.1 |
5. |
3.618 |
0.299 |
12.11 |
1.58 |
43.7 |
6. |
2.271 |
0.208 |
10.91 |
1.21 |
53.3 |
7. |
0.837 |
0.079 |
10.64 |
0.45 |
53.8 |
8. |
0.340 |
0.043 |
7.97 |
0.26 |
76.5 |
9. |
7.200 |
0.473 |
15.24 |
1.75 |
24.3 |
10. |
2.090 |
0.221 |
9.47 |
0.98 |
46.9 |
11. |
1.970 |
0.214 |
9.20 |
0.83 |
42.1 |
12. |
0.694 |
0.067 |
10.42 |
0.36 |
51.9 |
As is shown by the data, the organic carbon content of soils is 25-50% of the total C content. The soils examined are extremely different in this aspect also: in the marshy meadow soil (9) with extremely high calcium-carbonate content, the ratio of the organic carbon was the lowest, 24.3%, although the organic carbon content itself was high. The ratio of the organic carbon fraction was the highest (76.5%) in the soil with the lowest total carbon content (brown forest soil with alternating thin layers of clay, 8).
The extreme values of the total nitrogen content were: 0.043% (brown forest soil with alternating thin layers of clay, 8), and 0.473% (solonchak-solonetz, 12). This tenfold difference demonstrates that the soils greatly differed in this characteristic, too.
The highest organic nitrogen content measured by Kjeldahl’s method (0.29%) was in typical meadow soil (5), while the smallest (0.034%) was obtained in brown forest soil with alternating thin layers of clay (8) and solonchak-solonetz soil (12).
Only a small fraction of the soil’s total N content is directly available to the plants. Therefore, it is also necessary to know the amount of soluble nitrogen fractions. For determining the soluble NH4+-N, NO3--N, organic N and total N contents, soil extraction with a 0.01 M CaCl2 solution was performed. The results are presented in Table 4.
167
Table 4
The amount of N forms extractable with a 0.01 M CaCl2 solution, the total organic nitrogen content (Kjeldahl) and their proportions in the soils examined
Nr. |
|
Soluble in CaCl2 (mg/kg) |
|
Total |
Soluble |
Soluble |
Soluble |
||
|
NO3-- |
NH4+- |
Inorganic |
Organic |
Total |
organic |
organic / |
organic / |
inorganic |
|
N |
N |
N |
N |
N |
N%* |
soluble |
total or- |
/ total N |
|
|
|
|
|
|
|
total |
ganic N |
(%) |
|
|
|
|
|
|
|
N (%) |
(%) |
|
|
d |
e |
f=(d+e) |
g |
h |
i |
100*g/h |
0.01*g/i |
0.01*f/b |
1. |
4.95 |
3.67 |
8.62 |
0.59 |
9.21 |
0.148 |
6.40 |
0.040 |
0.418 |
2. |
5.60 |
0.60 |
6.20 |
0.66 |
6.85 |
0.135 |
9.60 |
0.049 |
0.286 |
3. |
0.48 |
0.46 |
0.94 |
0.97 |
1.90 |
0.232 |
51.05 |
0.042 |
0.029 |
4. |
1.29 |
0.34 |
1.62 |
0.28 |
1.90 |
0.290 |
14.64 |
0.010 |
0.049 |
5. |
1.90 |
0.41 |
2.32 |
0.25 |
2.56 |
0.204 |
9.66 |
0.012 |
0.077 |
6. |
0.43 |
0.45 |
0.87 |
0.43 |
1.31 |
0.126 |
33.14 |
0.034 |
0.042 |
7. |
0.36 |
0.36 |
0.72 |
0.09 |
0.80 |
0.062 |
10.63 |
0.014 |
0.091 |
8. |
0.51 |
0.31 |
0.82 |
0.14 |
0.96 |
0.034 |
14.55 |
0.041 |
0.193 |
9. |
3.44 |
0.56 |
4.00 |
1.46 |
5.46 |
0.280 |
26.81 |
0.052 |
0.085 |
10. |
5.96 |
0.62 |
6.58 |
1.06 |
7.64 |
0.163 |
13.87 |
0.065 |
0.298 |
11. |
0.39 |
0.40 |
0.79 |
0.46 |
1.25 |
0.149 |
37.00 |
0.031 |
0.037 |
12. |
0.51 |
0.23 |
0.73 |
0.24 |
0.96 |
0.034 |
24.68 |
0.070 |
0.110 |
* according to Kjeldahl
The total nitrogen content soluble by 0.01 M CaCl2 was the highest, 1.46 mg/kg, on marshy meadow soil (9), which is 16 times higher than the lowest, 0.09 mg/kg, on humus sand (7). The organic compounds extracted by CaCl2 correspond to the total amount of organic compounds which potentially easily mineralise; therefore, they play an important role in the available nutrient supply of soils as well as in plant nutrition.
The maximum amount of total nitrogen extracted by CaCl2, 9.21 mg/kg, was measured on calcareous chernozem, while the minimum, 0.80 mg/kg, was on humus sand, meaning that the highest value is twelve times higher than the smallest.
Expressing the soluble organic N content as a percentage of the total soluble N content, it can be stated, that values under 10% were measured in calcareous chernozem (1), chernozem meadow (2) and typical meadow (5) soils under intensive cultivation. The reason is that the high N fertilization considerably increases the soluble inorganic N content in soils. The highest proportion of soluble organic fraction (51%) was measured in meadow solonetz (3) with natural grass vegetation, due to the fact that a considerable part of the organic nitrogen compounds can be found in peptised form in solonetz soils and probably the mineralization of N is hindered.
Contrasting the soluble organic N content to the total one, the values range between 0.01% (chernozem-like meadow, 4) and 0.07% (solonchak-solonetz, 12). In spite of this, the amount of soluble N cannot be considered insignificant in the nutrient supply of plants, since it is the form that is mineralized most easily.
Finally, calculating the directly available, soluble inorganic N content (that is the sum of NO3--N and NH4+-N) as a percentage of the total N content measured by the element analyser, the maximum value was 0.42% (calcareous chernozem, 1). The minimum, 0.037%, was measured on brown forest soil with alternating thin layers of clay (11).
Conclusions
Our results prove that more than 99% of the soil’s nitrogen stock becomes available for the plant only after a transformation. This draws the attention to the importance of knowledge on and influencing of the nitrogen transformation processes in the soil.
It can be stated that the nitrogen content differs greatly in the different soils, but the ratio of the nitrogen forms is similar apart from a few exceptions. This indicates that
168

the nitrogen forms are continuously transforming into other forms in order to create a balance. If the ratios do not follow this general trend, then the transformation is probably hindered somewhere.
References
1.Blume H.P., Brümmer G.W., Horn R., Kandeler E., Kögel-Knabner I., Kretzschmar R., Stahr K. und Wilke B.M. Scheffer/ Schachtschabel: Lehrbuch der Bodenkunde. Spektrum Akademischer Verlag, Heidelberg. 2010.
2.Loch J., Peschke H., Jászberényi I., Vágó I., Mollenhauer S. Vergleichende Untersuchungen zur Prüfung der Stickstoffleistung und – verwertung auf ungarischen Dauerversuchsböden. VDLUFA-Schriftenreihe
46.1997a. 391-394.
3.Loch J., Kiss Sz., Jászberényi I., Vágó I. Der N hrstoffzustand des Thyrower Versuchsbodens aufgrund von Boden und Pflanzenanalysen. Mitt. der Deutschen Bodenk. Ges., 1997. 84. 445-448.
4.Loch J., Jászberényi I., Vágó I. Hundredth molar calcium chloride extraction procedure. Part III: Calibration with conventional soil testing methods for magnesium. Commun. Soil Sci. Plant Anal. 1998. 29. 11-14. 1633-1640.
5.Peschke H., Loch J., Mollenhauer S., Jászberényi I., Vágó I. Vergleichende Untersuchungen mit Hafer zur Stickstoffleistung und -verwertung von Dauerversuchsböden. Tiszántúli Mezőgazdasági Tudományos Napok, Debrecen. Agrokémiai és Talajtani Szekció. 1999. P. 63-69.
6.Schilling G. Pflanzenernährung und Düngung. Verlag Eugen Ulmer, Stuttgart. 2000.
И. Ваго, А. Балла-Ковач, Я. Катай Дебреценский университет Дебрецен, Венгрия
e-mail: vago@agr.unideb.hu
АНАЛИЗ ФОРМ АЗОТА И УГЛЕРОДА В НЕКОТОРЫХ ТИПАХ ПОЧВ ВОСТОЧНОЙ ВЕНГРИИ
Аннотация. Значительная часть азота и углерода в почве содержится в форме органических соединений. Питательные вещества становятся доступными для растений благодаря процессам разложения органических соединений. Трансформация азота и углерода тесно связана, так как разложение органических веществ оказывает влияние на оба этих элемента. Чтобы получить более полное представление о питательных веществах различных почв, количество некоторых форм азота и углерода было исследовано в 12 абсолютно разных типах почв в Восточной Венгрии. Анализ содержания углерода в почве и количества конкретных форм углерода необходим, поскольку трансформация соединений углерода связана с циклом азота; это имеет первостепенное значение в питании растений. Общее содержание углерода в почвах измеряли элементным анализатором CNS. Подобно другим параметрам почвы, общее содержание углерода находилось в широких пределах: 0,34% в бурой лесной почве с чередующимися тонкими слоями глины («kovárvány») и 7,20% в болотно-луговой почве.
Содержание органического углерода по Тюрину также сильно различалось: 0,26% в бурой лесной почве с чередующимися тонкими слоями глины и 1,77% в черноземовидных луговых и болотисто-луговых почвах.
Среди азотных форм, играющих первостепенную роль в питании растений, общее содержание азота измеряли с помощью анализатора CNS. Предельные значения его содержания составляли 0,043% в бурой лесной почве с чередующимися тонкими слоями глины и 0,473% в солончак-солонце. Разница в десять раз показывает, что исследуемые типы почв в этом отношении также сильно различались. Органические соединения, вытесняемые раствором 0,01 М CaCl2, соответствуют общему количеству органических соединений, которые являются легко разлагае-
169