

книги / 971
.pdf6 179
6.5. -
: (2016)
1., .
. 18 3 3. . 1 45°‘ ’ . 4 ‘’ . 3 .45° ‘ ’ .
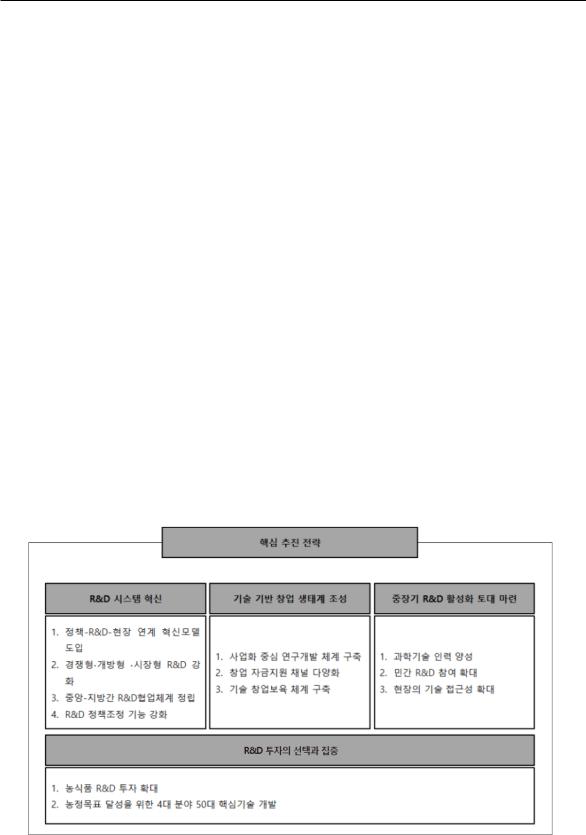
6.3. R&D
1999 5R&D. 2 (2015~2019) , ,
, 14.
180 ,
, .. .
마련한다. 2017 , ,R&D. 2017 . 2017R&D.
1 (2010~2014) R&D.
2 (2015~2019) ,
R&D . 2 4 , 50( 6.1).
6.1. 2
: (2016)

6 181
R&D R&D .R&D ,.
. OECD(2014a) R&D. 5
( 6.6). ,. , .
. R&D. .R&D .
6.6. R&D
: (2017)
2017 129 16 ,5 3,389 ( 45 ) .5 . ,
4 ,8 . 6 10
. 2014~15 7
15 . ,· .

182 ,
6.4.R&D
R&D 2012 2016 3.6% . R&D3 2 , 3R&D 2012 4.9% 2016 5.5% . 2016
, 3 R&D 68%21% .
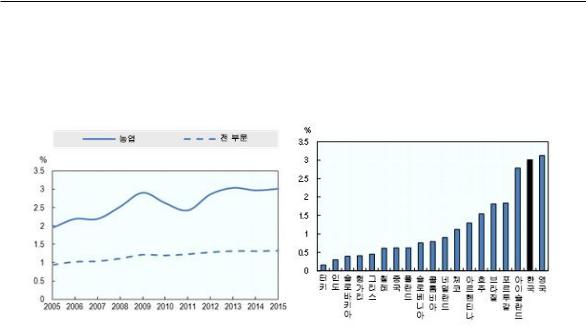
R&DR&D OECD , 20153% ( 6.8). R&D
R&D .
6.7. R&D (2007 2016)
: 2007 2012 R&D .: (2017)
StatLink 2 https://doi.org/10.1787/888933851989
R&D R&D (
) , ,. . 2014
R&D , , 87%, 58% 26%.
6 183
6.8. R&D ( R&D )
A. R&D (2005~15) |
B. R&D (2015*) |
(GDP ) |
( |
*: 2015
: OECD(2017b), OECD Research and Development Statistics, Government budget appropriations or outlays; OECD (2017c), System of National Accounts, https://stats.oecd.org; ASTI (2017), Agricultural Science and Technology Indicators (2017), www.asti.cgiar.org/data (last accessed in October 2017).
StatLink 2 https://doi.org/10.1787/888933852008
R&D . (2015~2019) 4; 1) , 2) , 3), 4) . ,, ICT , 2016
R&D 35% .
6.2.2014 R&D
|
|
|
|
|
|
|
|
|
|
|
|
|
1 |
|
|||
|
|
|
|
|
||||
R&D |
( ) |
160,471 |
2,831 |
4,298 |
167,600 |
277,949 |
19,664 |
465,213 |
|
( · ) |
- |
24,818 |
- |
24,818 |
201,312 |
56,299 |
282,429 |
( ) |
|
160,471 |
27,649 |
4,298 |
192,418 |
479,261 |
75,963 |
747,642 |
( ) |
4,541 |
4,764 |
- |
9,305 |
103,140 |
17,083 |
129,528 |
|
|
|
|
|
|
|
|
|
|
( ) |
3,090 |
640 |
- |
3,730 |
9,692 |
2,752 |
16,174 |
|
( ) |
168,102 |
33,053 |
4,298 |
205,453 |
592,093 |
95,798 |
893,344 |
|
: 1. ‘ ’ (1,718) R&D (2,580) .
2. , .: ( )
StatLink 2 https://doi.org/10.1787/888933852426

184 ,
2016 30% . , Golden Seed , · . 201622% , , ,. , ,., .
R&D
R&D 2015 R&D 75% OECD
. R&D, OECD ( 6.9.B).
, R&D
2015 9,530 3.9% .
, , 2015 1,960 R&D7.6% .R&D 2008 2015 3.5 , 1.9 .
R&D, ( 6.9.A).0.1% , OECD. R&D 2008 2015 1.5( 6.3).
6.3. R&D (2008 2015)
|
2008 |
2009 |
2010 |
2011 |
2012 |
2013 |
2014 |
2015 |
( ) |
203 |
199 |
247 |
329 |
265 |
254 |
283 |
308 |
( ) |
2,699 |
3,190 |
2,599 |
3,565 |
4,169 |
4,045 |
4,232 |
9,529 |
|
|
|
|
|
|
|
|
|
( ) |
1,039 |
1,186 |
1,217 |
2,433 |
1,726 |
2,646 |
1,908 |
1,955 |
( ) |
3,941 |
4,575 |
4,063 |
6,327 |
6,160 |
6,945 |
6,423 |
11,792 |
|
|
|
|
|
|
|
|
|
:
StatLink 2 https://doi.org/10.1787/888933852445

6 185
6.9. R&D (BERD)
A. |
B. |
: . (A) (2010 ) 2013 2014. (B) (2009 ) (2006 ) 2010 .
: OECD(2016b), OECD Research and Development Statistics, Gross domestic expenditure on R-D by sector of performance and field of science, http://stats.oecd.org/Index.aspx?DataSetCode=GERD_SCIENCE; OECD (2016c), System of National Accounts, https://stats.oecd.org.
StatLink 2 https://doi.org/10.1787/888933852027
있다. , ,
R&D . R&D. , R&D R&D, R&D OECD. R&D R&D. R&D.
R&D R&D .(PPP, Public and Private Partnership) (Box 6.2).
R&D . R&D R&D.

186 ,
.
50%, 40%, 25%, 20% . ,
R&D 2013 R&D 32% .
2016 ( : ,
) R&D. ,.(1~2 ) .
.· . , ,. R&D (2014 100
) (2015 120 ). (crowd funding) .
Box 6.2. : OECD
.1 . .,. , ..
. , .

6 187
, , NGO, . .
OECD .. . . .
2011 R&D ( )(OECD, 2015a).. ( )(50:50). .
, (RDCs, the Rural Research and Development Corporations) R&D. 15 . R&D .(CRC, Cooperative Research Centre) ., , R&D R&D
. 10,(OECD, 2015b).
1.“ ,( ) , , , ”(OECD, 2004).
: Moreddu(2016)

188 ,
6.5.
R&D .. ,. (OECD, 2016a).
R&D R&D. R&D . ,. ,,.
1980 OECD( 6.10.A). Campi and Nuvolari(2013)(Plant Variety Protection Index) 1990 2000( 6.10.B). R&D, .