

Proceedings of 6th International Conference of Young Scientisis on Solutions of Applied Problems in Control and Communications
..pdfPerm National Research Polytechnic University
(Perm, Russia)
Anhalt University of Applied Sciences
(Koethen, Germany)
PROCEEDINGS OF 6TH INTERNATIONAL CONFERENCE OF YOUNG SCIENTISTS ON SOLUTIONS OF APPLIED PROBLEMS IN CONTROL AND COMMUNICATIONS, DATA PROCESSING AND DATA ANALYSIS
(March 19, 2015 Koethen, Germany)
Perm National Research Polytechnic University Publishing house 2015
УДК 004.9 ББК 32.81
In this volume, the works of young scientists, graduate students as well as the best students' reports at the conference are collected.
The conference was devoted to the systems research and simulation, infor- mation-measuring and control systems, telecommunications and energy saving, information technology and automation tools, hardware and software of information management systems.
Published research results can be useful interest for young researchers, educators and professionals who are interested in theoretical and applied investigations.
Editorial board:
Prof., Dr. Ursula Fissgus, Anhalt University of Applied Sciences; Dr. Bernd Krause, Anhalt University of Applied Sciences;
Prof., Dr. Alexander Kostygov, Perm National Research Polytechnic University; Prof., Dr. Anton Petrochenkov, Perm National Research Polytechnic University; Assoc. Prof., Dr. Leonid Mylnikov, Perm National Research Polytechnic
University
Reviewer:
Alikin Vladimir Nikolaevich – Doctor of Technical S ciences, Professor, Chief Science Officer Nord-West-Service Ltd
ISBN 978-5-398-01430-3 |
© PNRPU, 2015 |
SOFTWARE AND HARDWARE SOLUTION FOR ENERGY MONITORING SYSTEM WITH GIS TECHNOLOGY
Sergey ARTEMOV1, Alexei KYCHKIN2
Perm National Research Polytechnic University, Perm, Russia
(1e-mail: Art-sa@bk.ru, 2e-mail: aleksey.kychkin@gmail.com)
Abstract. In market competition, reducing the production cost in any enterprise is one of the main tasks. In many countries take effect various types of legislative acts regulating the savings rate enterprise resources. In the world have developed a energy savings system for various kinds of objects such systems are called energy monitoring systems (EMS). For stationary objects it systems are widely used in practice. For moving objects functions EMS limited to the collection of information and reporting documentation that fully cannot solve the problem of saving resources. We offer our solution of hardware and software for EMS using GIS technology for mobile objects. This system includes solutions at every level of implementation. This solution can also be applied to various types of objects where necessary to collect information based on the GIS for example distributed systems, various types of transport and others.
Keywords: energy monitoring; energy monitoring system; targets for energy consumption; mobile platform; transport; GIS.
Introduction
The problem of save resources today is particularly acute. For small countries where resources are limited conservation and recycling are two principles of human life. In enterprises resource saving leads primarily to reduce product cost this is achieved by the use optimization techniques of resource allocation and control their consumption. Today all these processes are automated these systems are called energy monitoring systems (EMS). EMS successfully used for stationary objects where at the bottom level removed main indicators consumption and at the top level provides complete information for decision-making on resource savings. One of the most powerful consumers in economic sectors is transportation today for transport similar systems are at the stage of design and testing. In this article will be offered one possible implementation concepts EMS software and hardware solution for moving object using GIS technology.
1. Aims and objectives
Our objectives include developing EMS on all layer, data processing and data analyzing, visual representation of consumption data. For this our tasks include develop architecture EMS, create experimental model EMS,
3
collect and analyzing data from our model EMS, calculation of energy efficiency indicators, showing geospatial data and develop hardware solution prototype for applying in our EMS.
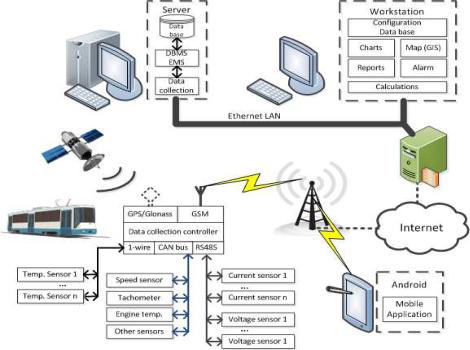
2. Architecture EMS
To solve this problem offered architecture EMS (Fig. 1). Here, at the bottom level is a controller that collects data from sensors and meters after collection data controller performs preprocessing and filtering data, the data is stored on the memory card and prepared for transmission over a wireless network, for example GSM/GPRS technology and others. Method collection data and software and hardware type varied from object type. For use GIS technology in this solution include GPS module that allow collect geospatial data, for example coordinate, speed, height and others.
On the top level has a hardware and software complex that allows further work with the data. The software has a modular structure.
Fig. 1. EMS architecture
Software for EMS consists of the following main elements:
1) Data base (DBMS) unit – designed to store data c oming from data object;
4
2)Data collection unit – data collection unit is d esigned for remote energy monitoring survey of objects according to the protocol and schedule polling and transmitting information in databases;
3)Configuration unit – used to configure databases , creation of entities and attributes, parameter assignment and objects properties;
4)Calculator unit – for pre or post-processing, wh ere according to mathematical description of perform all calculations indicators energy monitoring;
5)Charts unit – designed for visual display using graphs and charts with filtering data on grounds;
6)Map (GIS) unit – module is designed for showing on the map consumption data with reference to the coordinates of the object and display the traffic object movement;
7)Report unit – designed for automatic reporting f or example daily or monthly.
3. Collect, analyzing and process data
Data collection, analysis and data processing is stage the most difficult in the subject and for each object it is an original, in this paper given general approach at this stage.
Data collection is one of the important stages of energy monitoring. Here, for each object necessary to define a number of parameters and values which will depend on quality data analysis and processing. By selection of these parameters provides the most significant of input values (which depends largely on the power consumption of the object), data collection frequency (how often to collect data from sensors and counters and how much data per day).
After collect data, raw data save to data base on server. Following input data is analyzed.
The main tasks of data analysis include:
1)Filtering incoming data from meters and sensors;
2)Calculation of real object consumption;
3)Correlation analysis between normalizing rates of consumption and real;
4)Calculating deviations of actual and normalized consumption indicators;
5

5) Long-term data storage to calculate normalizing and targets indicators.
Information is a set of statistics based on which it is possible to identify object consumption indicators.
For a moving object indicators include [1]:
1)ρ – specific energy consumption per kilometer:
ρ= ;
2)η . – cycle efficiency of object:
ес = ∙ 100 [%]
η;.
3) |
К |
с |
– coefficient use object: |
, |
|
|
|
|
|
|||
|
|
|
|
|
К с |
|
|
|
|
|
||
|
|
|
[kW⁄h] |
|
= |
|
|
= ∑ & ∙ ' |
[kW⁄h] |
|
||
rated |
|
– real energy consumption; |
– |
|||||||||
where |
|
|
|
$ |
|
|
||||||
|
consumption; |
|
|
|
|
|
|
|||||
4) |
∆ )*+ – reserve reducing energy consumption |
|
|
|
||||||||
|
|
|
|
|
∆ )*+ = |
|
|
∙ 100 |
[%], |
|
|
|
|
|
|
|
|
|
− $-) |
|
|
|
|
|
|
Data processing step is the statistical analysis. Using modeling tools necessary to implement mobile object model and by setting external factors such as weather conditions or travel route to predict the behavior of the system under these conditions and thus achieving the most suitable conditions for saving resources. This principle necessary to apply for behavior model of the driver vehicle based on calculations use the most energyefficient driver actions [2].
The task search for a solution consists of stages:
1)data collection;
2)filtering data;
3)choice of algorithm analysis;
4)choice of parameters and the training algorithm model;
5)training of the chosen model;
6)сheck the trained model;
7)results analysis.
6
Implementation of these models should be carried out in mathematical software products and calculated only once for each object using the knowledge gained in the following facility operation.
Thus, using this approach, you can get a clear picture of the object consumption and to predict its behavior of under given conditions at a minimal cost for the data collection implementation.
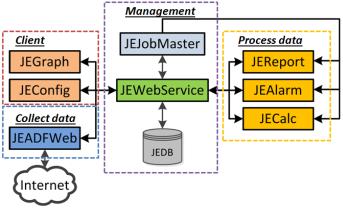
4. Using OpenJEVis for EMS solution
Similar modular structure has open source software system OpenJEVis [3]. As can be seen from (Fig. 2) OpenJEVis composed of blocks to work with the client DB management unit and data processing unit and data acquisition unit. Due to flexibility of this software configuration can be achieved a complete and effective construction a top-level EMS [4].
Fig. 2. OpenJEVis structure
EMS includes a movable object whose behavior is described using geodata obtained by GPS/GLONASS systems [5]. Next step of our research is writing of program module for OpenJEVis which would allow necessary processing and displaying data on map.
JGIS positioned as a module for the open source project OpenJEVis. This program (Fig. 3) is written in JavaFX package NetBeans, it in-
cludes a library with Google map api – GmapsFX, whi ch allows use almost all api functions. In the program used filtering data in a table and realized sorting data on any grounds. For convenience of viewing data used library JFreeChart, which allows to display a temperature graph.
7
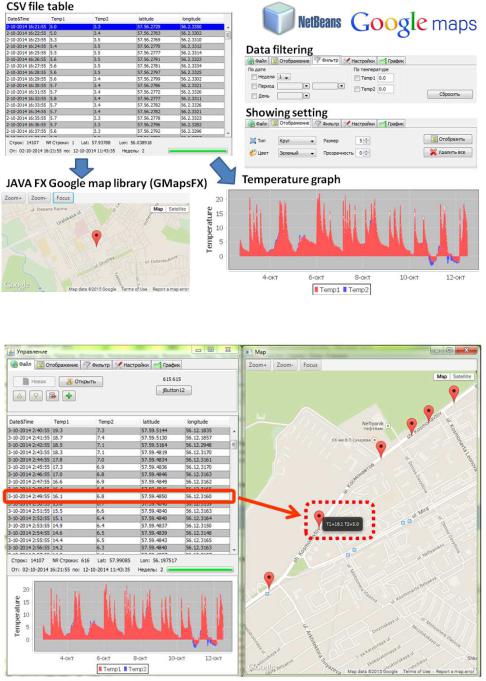
Using CSV export file, we derived data from the table to the map (Fig. 4) and show temperature graph.
Fig. 3. JGIS program
Fig. 4. Show in JGIS program
8
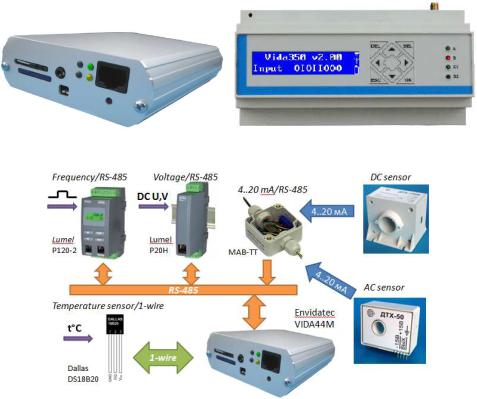
5. Data collection controller
As a technical support in this solution there are many variants implementation. We offer a solution Envidatec company – VIDA44M controller and VIDA350 (Fig. 5).
Fig. 5. VIDA44M and VIDA350 controllers
Fig. 6. Data collection systemу based on the controller VIDA44M
These controllers have the following characteristics:
1)RS485, RS232;
2)SC-Card;
3)GSM/GPRS modem (SMS, internet, voise);
4)1-Wire interface;
5)4 analog input 0..10 V;
6)8 discrete in/out;
7)CAN bus;
8)Mobdus RTU;
9)LCD display;
10)Free software (IDE RCTU).
9
For example, based on controllers Envidatec company system built low-level EMS (Fig. 6). This system includes two major digital RS485 and 1-wire bus. To RS485 bus connected converters voltage and current as well as pulse counter. To 1-wire bus connect temperature sensor. Due to the versatility bus can achieve connectivity almost all kinds of sensors and counter to the controller [6].
Using proposed solution will give a full assessment of the EMS object energy monitoring as well as provide for management personnel information necessary for the development of ways to save resources and give a vivid picture of consumption depending on geospatial data.
References
1.Fundamentals of the target energy monitoring: Manual for the course. – M.: Enizan, 1997. – 39 p.
2.Kychkin A.V., Khoroshev N.I., Eltyshev D.K. The concept of an automated information system to support energy management // Energy secu-
rity and energy saving. – 2013. – № 5. – P. 12–17.
3.OpenJEVis – The Open Data Monitoring and Storage Solution. – URL: www.OpenJEVis.org (accessed: 03.03.2015).
4.Kychkin A.V. Long-term energy monitoring based on software platform OpenJEVis // Bulletin of PNRPU. Electrotechnics, information tech-
nologies, control systems. – 2014. – №. 9. – Р. 5–15.
5.Kostygov A.M., Kychkin A.V. Structuring Remote Monitoring group of intelligent mobile platforms in real time // Sensors and Systems. – 2013. – № 9. – P. 65–69.
6.Kichkin A.V. The model structure synthesis automated system for collecting and processing data on the use of wireless sensors // Automation
and modern technology. – 2009. – № 1. – Р. 15–20.
10