

Proceedings of 6th International Conference of Young Scientisis on Solutions of Applied Problems in Control and Communications
..pdfFig. 3. Block diagram of the control system based on adjustable-frequency electric drive
Despite all the above advantages, adjustable-frequency electric drives not widely used because the frequency converters are expensive. Because of this, there is a need to develop new methods, systems and control algorithms that will increase the efficiency and life of the equipment [5].
3. Automatic control system based on vector control of induction motor
Currently vector control is becoming the most popular method of motor control in frequency regulation. The theoretical vector control systems basis were developed in the 80-th of the last century. But due to the lack of power fully programmable semiconductor converters and high speed of information software were not able to implement the principles of vector control. To date, the development in semiconductor technology and microcontrollers allows to implement vector control using frequency converters.
In Figure 4 shows a simplified structure of the vector control system of induction motor speed. The speed control of the motor is implemented using the speed regulator, which adjust the torque on a shaft. Motor torque is changed using the stator current. For the vector control system synthesis connects the motor torque with the stator current vector parameters. Adjustment,
61

in vector control, is carried out in the coordinate system, which rotates synchronously with the motor states vectors. Such a coordinate system can be associated with many states vectors, but usually it is associated with the vector ψR (rotor flux). The axis of this two-phase system of coordinates is called d and q. The axis d is oriented of the rotor flux [6].
Fig. 4. Structure of the vector control system of induction motor
Vector current controller consists of two scalar regulators d and q. This controller uses feedback from measured and converted into the system dq real vector of stator current. The current regulator generates a stator voltage vector, which consists of two components: USd and USq. Then, using the coordinates transformation, the stator voltage vector is transformed from a rotating system in a fixed coordinate system that is associated with the stator [7].
Usually the stator voltage vector in vector control systems is implemented using pulse width modulation (PWM) [8].
In general, for the synthesis of the control system it is necessary to find the relationship between the torque and the projections of the stator current vector on the axis d and q, rotating synchronously with the rotor flux. Also determine the rotation angle of the system dq, for the implementation of coordinate transformations.
Conclusion
The control system is based on "thyristor converter - induction motor" is used in many sucker rod pumping unit (SRPU), as they allow to smoothly adjust the motor shaft rotation speed when periodic mode. The disadvantages of electric drives is based on "thyristor converter - induction motor" are low energy indicators.
62
The system is based on adjustable-frequency electric drive, it has the best energy performance and best energy saving opportunities. Despite all the above advantages, adjustable-frequency electric drive has high cost.
The system is based on vector control of induction motor allows to determine forces on the rod, the actual estuarine dynamometer according to the parameters obtained from the frequency converter; adjust the number of swings at the maximum flow rate at the optimum filling of the pump. System vector control has less cost relative to the system based on adjusta- ble-frequency control of the drive.
So, in conclusion Vector control system of sucker rod pumping unit motor has several advantages. It allows to determine the operating parameters of the sucker rod pumping unit using electric motor parameters obtained from the frequency converter via the fieldbus; to analyze the state of sucker rod pumping unit equipment; to measure the torque and other parameters without sensors but using the frequency converter.
References
1.Rismiller G. Oil production of sucker rod pumps. – Publisher Shel- ler-Bleckmann, city Ternitz, Austria, 1988. – 150 p .
2.Farhadzadeh E.M. Improving the pumping unit equipment efficiency using adjustable electric drives: abstract. – Mo scow, 1988. – 32 p.
3.Basharin A.V., Novikov V.A., Sokolov G.G. Control of electrical drives. – Moscow: Energoizdat, 1982.
4.Tusev A.M. Optimization the sucker rod pumping balance according to the criterion of energy consumption // Problems and achievements in industrial energy: proceedings of the 3rd scientific-practical conference. Ekaterinburg, 2003. – 87 p.
5.Sakai A.F. Systems and algorithms for energy-saving control of ad- justable-frequency electric sucker rod pumping unit drives: abstract. – Saint-Petersburg, 2009.
6.Kalachev Y.N. Vector control (practice notes.). – 2013.
7.Dadenkov D.A., Solodky E.M., Shachkov A.M. Simulation of vector control system of asynchronous motors through the MatLab/SIMULINK environment // Vestnik of Perm National Research Polytechnic University. Electrical engineering, information technology,
control systems. – 2014. – № 3. – 117–128 p.
8. Dadenkov D.A., Kaverin A.A. Simulation fuzzy control system of oil level in the well // Vestnik of Perm National Research Polytechnic University. Electrical engineering, information technology, control systems. – 2013. – № 8. – 128–137 р.
63
ПОСТРОЕНИЕ СИСТЕМ АВТОМАТИЧЕСКОГО УПРАВЛЕНИЯ
ЭЛЕКТРОДВИГАТЕЛЕМ СТАНКА-КАЧАЛКИ ШТАНГОВОГО ГЛУБИННОГО НАСОСА
Александр КОСТЫГОВ1, Алексей ШАЧКОВ2
Пермский национальный исследовательский политехнический университет, Пермь, Россия
(1e-mail: dekan@etf.pstu.ru, 2e-mail: ajiexa_@mail.ru)
Аннотация. В данной статье рассмотрены вопросы построение систем автоматического управления электродвигателем станка-качалки штангового глубинного насоса. Приведены структуры систем автоматического управления штанговой скважинной насосной установкой на основе « тиристорный преобразователь напряжения – асинхронный электродвигатель», частотно-регулируемого электропривода и векторного управления. Особое внимание уделено достоинствам и недостаткам систем автоматического управления ШСНУ. В работе подробно описаны алгоритмы работы автоматического регулирования динамического уровня нефти в скважине и обеспечение требуемого закона движения точки подвеса колонны штанг с помощью изменения мгновенной скорости на валу электродвигателя станкакачалки. Полученные в работе результаты планируется задействовать при разработке бездатчиковой векторной системы управления штанговым глубинным насосом.
Ключевые слова: штанговые скважинные насосные установки, тиристорный преобразователь – асинхронный двигатель, нерегулируемый электропривод, векторное управление, штанговый глубинный насос, частотнорегулируемый электропривод.
64
CREATING A MANAGEMENT VIEW ON KEY INDICATORS
USING BUSINESS INTELLIGENCE
Veronika ŠIMON ČIČOVÁ
Faculty of Material Sciences and Technology,
Slovak University of Technology, Trnava, Slovakia
(e-mail: veronika.simoncicova91@gmail.com)
Abstract. Diploma thesis focuses on the presentation of options to work with the data and provides basic theoretical determination of the issue. Business Intelligence as a process of transforming data into information and knowledge is one of the fastest growing areas of information technology. Effort to deepen knowledge and skills in the your area, gave rise to the emergence of this thesis.
Keywords: Business Intelligence, data, information
Introduction
Most managers performed their decisions based on intuitive methodology, consisting of the experience and knowledge of the application area and the available information. This approach naturally leads to stagnation decision-making style is not suited to the existing unstable conditions characteristic of frequent and rapid changes in the economic environment. The set of concepts and methodologies that improve decision making call Business Intelligence (BI).
BI is large category of applications and technologies for gathering, storing, analyzing, sharing and dissemination of data to help users in companies make better business decisions.
BI today largely affects the performance and quality management company in connection with this, finally, the overall success and competitiveness.
BI is a set of processes, know-how, applications and technologies are designed to effectively and efficiently support management activities in the company. Support for analysis, planning and decision-making activities of the organization at all levels and in all areas of business, ie, sales, purchasing, marketing, financial management, controlling, property, human resource management, manufacturing and others [1].
1. Objectives
The Objective of my thesis is to show the current possibilities of creating a simple management views and analysis of business data with the available tools and programs. Diploma thesis can be decomposed as follows:
− Description of issues Business Intelligence.
65

−The analysis of data in the comp any.
−Design of dashboard in Excel 20 13.
−Evaluation of the benefits of diploma thesis.
2. Business Intelligence
Gala, Pour, Toman [2] characterize the Business Intelligence as a "complex approaches and applicatio ns that support analysis and planning activities and organizations are built on the principle of multidimensionality."
The following fig. 1 shows the ess ence of intelligent organization, expressed as the ability to correctly use and work with information stored in the data, which the organization has, b ringing new business opportunities and develop options for its further growth compared to competitors [3].
Fig. 1. Developmental sta ge of the organization in terms of use and wor k with the data [3]
2.1. Spheres of using Business Int elligence today
BI is currently used in many areas. To the classic areas in which knowledge BI applied for many years, in the current period, mainly due to the rapid development of information te chnology, updated with a new area. "The basic areas of application BI include [4]:
66

Medicine: Detection of links between diseases and efficacy based on the analysis obsolete disease patients to identify relationships between diseases.
Pharmaceuticals: Finding new medicines.
Security: Face recognition, identification, biometrics.
Judiciary: Search and access to historical data on convictions in such cases.
Biometrics: Identification of individuals on the basis of photographs, fingerprints or voice recording.
analysis of scientific data: identification new galaxy by searching clumps.
Web Analysis: Identification of common features of the site visitors, subsequent adaptation web site.
Marketing: Helping marketers in detecting groups of customers and then use this knowledge when creating precisely targeted advertising campaigns use.
Insurance: Identification of policyholders with high liquidation expenses.
2.2. Dimensional model
The result of the application of dimensional modeling is dimensional model. It consists of data structures that capture the facts and dimensions in relational tables. The basic logical structure of the dimensional model of the old diagram in Fig. 2 [5].
Fig. 2. Star schema [5]
2.2.1. Fact table
The heart of the star schema, because it captures all the necessary facts. It has the following characteristics [5]:
67

−describes a particular business entity,
−business entity characterized by facts which are in the table,
−fact that is stored in the table is followed for each combination of dimensions,
−fact table contains large volumes of data,
−maximum volume table is defined as the a Cartesian product of the values of the primary key of tables dimensions,
−frequently amending,
−data sources are basic data of enterprise information resources,
−data in the transformation of the table summarize the facts and aggregated at the desired level,
−each fact table characterizes granularity, which indicates the degree of aggregation facts compared to the source data
Fact table (Fig. 3) contains two types of attributes [5]:
−key attributes – these are foreign keys from the co rresponding dimension of tables. The primary key of the table facts is composed of all the key attributes;
−non-key attributes – these are mere facts that are collected for each combination of non-key attributes.
Fig. 3. Fact Table [5]
68
2.2.2. Table of dimensions
Delimit choice of a particular fact from the fact table. Contains attributes that describe the selected dimension and characterize the importance of the individual facts in the fact table. Examples of dimensions include product, time, geographical location, customer, and the like. Dimensions of the table have the following characteristics [5]:
describe the individual records in the fact table,
are geometrically smaller than the table facts,
are substantially sustained as tables facts,
each star schema contains the time dimension,
are highly unnormalized,
the source hierarchy.
They are unlimited, but for practical reasons, the recommended maximum of 10.
The dimensions of the table are two kinds of attributes [5]:
∙key attribute - the only one and is the primary key in the table of dimensions
∙non-key attributes - they are non-numeric descriptive value
2.3. Data minig
Data mining is an analytical component BI data mining concept of data mining into English can translated as data mining. Despite the existence of the translation of this concept, however, as with BI frequently used English equivalent, which we in our work predominantly used.
"Data mining can describe as the process of extracting relevant, previously unknown or unidentified information from very large databases. An important feature of data mining is:
− analysis derived from content of data and is not specified by the user in advance or implementer, and this is especially the derivation of predictive information, not just descriptive.
Since the process of acquiring knowledge is possible to use different algorithms to process work, there was an effort to create some sort of standard. One such standard is the CRISP-DM (Cross-Industry Standard Process for Data Mining) (Fig. 4), which outlines a recommended workflow in the process of knowledge discovery in databases. By CRISP-DM is the acquisition of knowledge from databases comprising the steps of [6]:
69
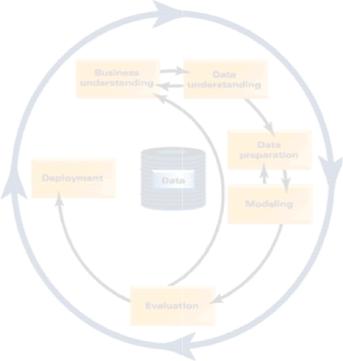
−Problem understanding,
−Data understanding,
−Data preparation,
−Modeling,
−Evaluation,
−Deployment.
Fig. 4. Phase KDD b y CRISP-DM [6]
3. The analysis of data in the com pany
My objective at this stage is to int roduce the company and apply the knowledge from the first part.
Contoso Ltd. is fictional company, which is established in 2005. The Contoso Ltd. is distributor electronics:
−televisions,
−computer,
−cameras,
−mobile phones,
−audio,
−games and toys,
70