

Proceedings of 6th International Conference of Young Scientisis on Solutions of Applied Problems in Control and Communications
..pdfBased on modern methods, stude nts PNIPU was developed his own method of identification, which allows to determine the mote with a scanner and a personal computer. Specks identification method was developed using LabVIEW. This development en vironment allows operatively write a program to identify specks. The principle of the method is as follows: after performing a scan octet get an image that is loaded into the program. On the basis of the jpeg file with the imag e of the sample using a special computer program specks calculated recognition [6].
3. Technology Description
The program consists of several building blocks. Consider the algorithm in more detail. The main feature s of this algorithm are loading images, calculation of pixels density, cutting images, specks identification, determination of the area of each speck of dust and specks sorting area. This algorithm is shown in Figure 2.
Fig. 2. The basic algorrithm of the program
In the first stage, we give the addres s of image; the program loads and displays it on the screen. Once downloade d the image indicates the linear dimensions of the image, and the program auttomatically calculates the pixel density by the formula. Figure 3 shows the calcu lation of the density of the pixel.
81

Fig. 3. Calculation of the density of the pixel
At the second stage, the program selects the image area directly for subsequent analysis, thus cutting off th e rest, because it is not needed for further work. The cutted part is removed, since it contains the jagged edges and roughness. This is done in order to reduce the noise that reveals itself in the identification like specks. The seccond stage is shown in Figure 4.
Fig. 4. Algorithm c utting pictures
82

For a clearer contrast between t he paper and the speck in the third stage are identified by superimposing mote correcting filters.
At the fourth stage shows that each speck is assigned a serial number and is defined by its respective area. Furthe r sorting specks in size and output of these summary data on the screen. The a lgorithm is shown in Figure 5.
Fig. 5. The sorting al gorithm specks area
Automatic detection specks indic ator is calculated in accordance with ГОСТ 13525.4-68 [1]. In determinin g the specks, the program calculates the total number of specks on both si des of the sample. Specks X express the total number of specks on both sides of the sample per 1 sq. m paper by
the formula 1. |
|
X= F∙$9G |
(1) |
where c – the total number of motes in all samples tested samples from two sides; n – a number of samples tested.
Average grade of quality Y expre ss the average number of specks on
both sides of all test samples per 1 sq. m paper surface by the formula 2. |
|
H = F$∙I. |
(2) |
|
83 |
The result of the program is rounded to an integer. Then, the resulting number is compared with the standards and determines the quality of the paper. This technology has been successfully tested on the computer. Were carried out a series of experiments, which showed that the program accurately and quickly calculate grade of quality than man.
The necessary for a mobile application identification specks confirmed by the fact that the scanner and the personal computer have large dimensions. Also on quality control may affect only technicians who have access to this program. To solve these problems is proposed to develop a mobile application that will use these algorithms written in Android and IOS. Technology is that with the camera on smart phones to take pictures of a sample of paper, then the application will download it and tested algorithms identifies specks. Result displays the smart phone and distribute specks into three color categories. Green category means that the results do not exceed the figure specks regulations. Yellow category means that the specks in the sample a small number, but a valid pass quality control standards. And the red zone means that exceeded indicator specks on regulations. Application menu will contain several sections, for example: test data, reports, and some other advanced features. Application menu is presented in table.
Application menu
Section menu |
Menu item |
Description |
|
|
|
|
|
|
Download sample |
In this section, the user loads the sample, |
|
|
Cropping pictures |
the program automatically crop the picture, |
|
Test |
Running identification |
the user starts the identification, the pro- |
|
Determination of the area |
gram automatically determines the area |
||
|
|||
|
of each specks |
specks and displays the results on the |
|
|
Result |
screen, which specifies the color zone result |
|
|
|
|
|
|
Result |
|
|
|
Sample number |
In this section, the program automatically |
|
Data |
Lot number |
||
fills in the data table |
|||
|
Causes |
||
|
|
||
|
Testing time |
|
|
|
|
|
|
|
|
When you press the button to generate |
|
Report |
Generate report |
the report, the program will display a |
|
small progress report and some recom- |
|||
|
|
||
|
|
mendations for improvement |
|
|
|
|
|
Additional |
Additional information |
This section describes all of the data that |
|
testing |
are not included in the table in the second |
||
information |
|||
|
paragraph |
||
|
|
||
|
|
|
84
4. Developments
This application has been successfully implemented in the pulp and paper enterprise, where a quality control speck passes manually. As well there are other areas in which the application can also develop successfully. When using a mobile application for identification of particles it can develop in areas such as electronics, optical components, and pharmaceuticals. If you use the application for the analysis of defects and impurities, the application areas are polymers and rubber, the exact details, tablet coating. Also, if using the application in the study of multilayer structures, the area will be chipped paint and varnishes, multilayer polymers, packaging materials. When identifying fiber application will be important in forensic science or the textile industry. For this solution, there are many different options for development.
5. Results
First of all, the automated system is focused on the definition of the indicator specks paper as one of the key indicators of quality. Secondly, accuracy of determining the index specks depends on the quality of the sample, for example, roughness, presence of ferrous inclusions. Thirdly, at this stage, studies are needed to extend the functionality of the software, including various figures to implement recognition by their shape. Fourthly, it is required to implement the calibration parameters sensitivity in the interface of the program. And at last, it is necessary to study functions and menu items in a mobile application.
6. Business Benefits
When developing mobile applications for business advantage will be that many pulp and paper enterprises manually find specks, at this timeconsuming work of large measurement errors will occur, and as a consequence of reduced quality control. And it affects the profits of the enterprise. This solution will deal with the problem at the present level: quality control will leave less time to decrease the measurement error, which will sell quality products printed editions. The application will save money on the cost of poor-quality paper with overproduction. Also one of the advantage of the application will be that it has a broad application areas: as a medicine, as in defect analysis, as in the investigation of multilayer structures, and in other sphere. The modern approach to solving this problem will make it easier to understand the algorithms as ordinary workers and managers.
85
Conclusions
The determination of the specks is important in the paper industry, as the quality of the paper influences the print quality. If there are indicators exceed the limits of acceptable values, products corresponding type of defective, as the use of recycled paper for its intended purpose impossible. Negative properties called defects. Influence of negative properties of paper is usually expressed in reducing the quality standards stipulated standards on paper or articles from it: the lack of mechanical strength, low specific properties of paper.
Today the project is relevant, since many pulp and paper enterprises specks paper manually determined by laboratory, making a long-term process and ineffective in detecting defective.
Also note that the mobile app does not currently developed. At the next stage of development is required to write algorithms on platforms Android and IOS, which will give rise to new research.
References
1.GOST 13525.4-68. Paper and cardboard. Method for determination of specks. Introduced. 1970-01-01. – M.: Publishing House of Standards, 2007. – 4.
2.Apparatus for determining the specks white and weakly colored sheet materials: US Pat. 261764 USSR / Kundzich G.A., Zhornitskii I.I. 1970.
3.Stefanov Stefan. This amazing material – paper // K ompyuArt. Electron. Magazine. – 2002. – № 10. – URL: http://www.compuart.ru/ Article.aspx?id=15372 (accessed: 20.03.2015).
4.Alladin.rd [Electronic resources] – URL: http://www .aladdinrd.ru/company/pressroom/articles/8097/ (accessed: 20.03.2015).
5.Flyate D.M. Properties paper. – M.: Forest Industry , 1986. – 680 p.
6.Roger C. Palmer. The bar code book. – Helmers Publi shing, Inc. Formerly North American Technology, Inc., 1995.
86
МОБИЛЬНОЕ ПРИЛОЖЕНИЕ ДЛЯ КОНТРОЛЯ КАЧЕСТВА ГАЗЕТНОЙ БУМАГИ
Илья СПИРИН, Николай ХОРОШЕВ
Пермский национальный исследовательский политехнический университет, Пермь, Россия
(1e-mail: Spirin.Ilya.Andreevich@yandex.ru, 2e-mail: horoshevni@mail.ru)
Аннотация. Рассмотрена проблема распознавания сорности газетной бумаги. Для решения данной проблемы предложено мобильное приложение на платформах Android и IOS, которое может быть установлено на всех корпоративных смартфонах или планшетах и позволяет каждому сотруднику компании внести свой вклад в улучшение качества газетной бумаги. Описаны апробированные алгоритмы каждого этапа компьютерной программы по распознаванию сорности. Рассмотрены различные методы идентификации. Проведены результаты эксперимента компьютерной программы на образцах бумаги.
Ключевые слова: сорность, контроль качества, идентификация, мобильное приложение, газетная бумага.
87
AUTOMATION OF ROBOTIC ARM
Tomáš STANOVIČ
Faculty of Materials Science and Technology,
Slovak University of Technology, Trnava, Slovakia
Abstract. This article includes information’s about design 3D CAD model in Autodesk Inventor its translation into MatLab SimMechanics and its controlling. First part contains instructions how to design robotic arm. Specifically how to create individual parts and assembly them together. Another part describes way to translate CAD model into SimMechanics. Next part is about editting model and about connecting Simulink blocks to SimMechanics blocks. Last part informs about development of an algorithm for calculate amplitudes from coordinates. This part also includes information’s about creating Graphical User Interface (GUI) to pass calculated amplitudes in to SimMehcanics.
Keywords: CAD model, SimMechanics, GUI, amplitudes, algorithm.
Introduction
Topic flows from current requirements of robotics for automated capabilities of modern robots to aimed robot at desired location, for the detection of objects in space, grasp objects and relocate them. For this purpose I used software Autodesk Inventor and MatLab. Autodesk Inventor contains tools suitable for 3D mechanical design, documentation and product simulation. SimMechanic is part of SW MatLab that provides a multibody simulation environment for 3D mechanical systems, such as robots, vehicle suspensions. SW allows to model the multibody system using blocks representing bodies, joints, constraints, and force elements, and then SimMechanics formulates and solves the equations of motion for the complete mechanical system. Models from CAD systems, including mass, inertia, joint, constraint, and 3D geometry, can be imported into SimMechanics. An automatically generated 3D animation lets user visualize the system dynamics.
1. Objectives
1.Design CAD model of robotic arm.
2.Translation CAD model into MatLab SimMechanics.
3.Edit SimMehcanics model in way, that it can receive input data from GUI.
4.Create GUI for calculate data to determinate desired location of arm.
88

2. Development Design CAD model
I created robotic arm as a assembly consisted of 13 parts (base, cylinders for connection, gripping parts...). First part which I designed was base, I started with 2D sketch where I created circle. Afterwards I finished sketch and I transformed 2D into 3D by using function extrude. In the next step I made hole in base by using function with same name as feature that I wanted to create. I set placement of hole from the sketch, termination of hole as a distance (Fig. 1). This was last edit at base. Similar procedure I used at every created part.
Fig. 1. Base
Fig. 2. Assembly
89
After design parts I joined them t ogether. I chose function constraint then I clicked at cylinder afterwards I clicked at bottom of hole in base, these two parts were connected. In the next step I again used function constraint, I clicked at part 1 after at cylinder and to assembly joined another part. I continued by connecting parts to assembly until I got whole assembly of arm (Fig. 2).
Translation CAD model into SimMechanics
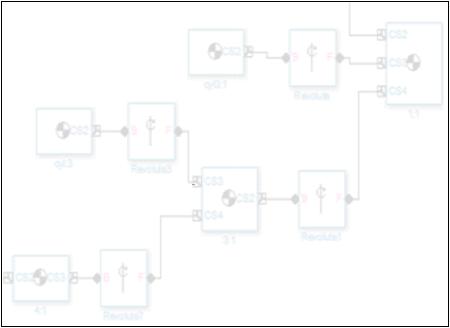
Translation consisted of two single steps. First step was to translate CAD file into XML file and second step was translate XML file into SimMechanics. To accomplish first step was necessary to install add-on SimMechanics Link to CAD platform. After getting XML file I typed into MatLab command window following text „ import_physmod('arm.xml.‘)“. Afterwards was created SimMechanics model of robotic arm in first generation in forward dynamics, shortcut of model is in the Fig. 3.
Fig. 3. SimMehcanics model
Parts were translated into body blocks as can be seen at figure with names 1:1, 3:1, 4:1, cyl:3. Body block is user-defined rigid body which is defined by mass properties and body co ordinate systems. Mass properties includes body’s mass, which determi nes body response to translational
90