

Geomagnetic_Disturbance_Task_Force_2012
.pdfChapter 7–Other Equipment
heating limits is present during an event, the generator operator can mitigate the permanent impacts of GMD on machine life. However for very large events, it may be necessary to protectively trip generating units to avoid potential damage and, in coordination, shed load in specific areas to alleviate the stress to remaining online generating units.
7.3 Capacitor Banks
High voltage shunt capacitor banks are generally used for reactive power compensation and voltage support during heavy loading conditions. The effect of harmonic currents generated during half cycle saturation depends on a number of factors, such as the grounding configuration of the bank, protection scheme, and system impedance seen by the bank.
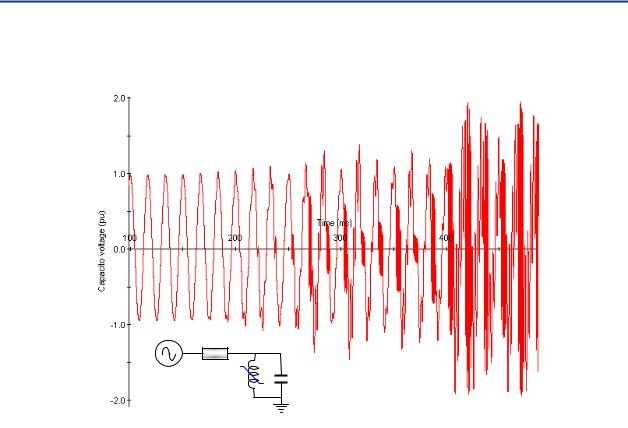
A shunt capacitor is a low impedance path for the harmonic currents generated during half cycle saturation. Therefore, the rms current flowing through the capacitor bank can increase substantially during a GMD event. Capacitor banks can withstand a certain amount of rms overcurrent and overvoltage under normal and contingency conditions (IEEE Standard 18 2002 for Shunt Power Capacitors102). An illustrative example of capacitor voltage for increasing values of GIC is shown below in Figure 31.
Issues to consider:
Grounding. The amount of current depends on grounding. An ungrounded bank will see smaller rms overcurrent than a grounded one because it blocks zero sequence harmonics
Protective relaying configuration.
o Intelligent electronic devices may be set to filter harmonics and, thus, be insensitive to harmonic overcurrents
o Overcurrent protection may or may not be used.
o Unbalance protection. A high voltage capacitor bank normally consists of a number of smaller series and parallel capacitor units (or cans) in order meet nominal voltage and current specification. It is not uncommon for one or more of these to fail. If a sufficient number of units fail, the full capacitor bank is tripped off line due to unbalance protection. If the bank is stressed due to harmonic overcurrents during a GMD event and there is no overcurrent protection, the bank is likely to trip on unbalance protection when a number of cans fail. This would make the bank unavailable during the remainder of the GMD event, but would not result in irreparable damage to the bank. Replacement of damaged cans is relatively simple and does not require a dedicated outage.
o Resonance. Depending on the system impedance seen from the capacitor bank, the magnitude of the transformer’s air core reactance, and the magnitude of the GIC, a sustained resonance condition is possible. Such conditions would have to be evaluated on a case by case basis.
102 The standard specifies that under continuous and contingency situations, none of the following should be exceeded: 110% of rated voltage, 135% of nominal rms current, 135% of rated kVAr.
Effects of Geomagnetic Disturbances on the Bulk Power System–February 2012 |
59 |
Chapter 7–Other Equipment
Figure 31: Illustrative example of capacitor voltage for increasing values of GIC
GIC=63A
GIC=22A
GIC=0
V
7.4 Shunt Reactors
In general, shunt reactors used for reactive power compensation and voltage control on long, lightly loaded transmission lines do not have a steel core, thus the term air core reactors. An air core reactor does not saturate and is not affected by the effect of GIC and harmonics caused by half cycle transformer saturation.
7.5 Circuit breakers
In an inductive network, current can only be interrupted when it becomes zero during a 60 Hz cycle. A high voltage network is largely inductive, and circuit breakers designed to interrupt fault and load currents rely on a zero current crossing to initiate the process of successful arc quenching and current interruption.
If the magnitude of GIC is small compared to the magnitude of currents to be interrupted during a fault (a few hundred amperes as compared to tens of kA under fault conditions), a zero crossing in the current to be interrupted will always take place. On the other hand, finding a zero crossing could be an issue if the magnitude of GIC exceeds the peak value of current in a lightly loaded circuit. In such a scenario, the arc between the poles of the circuit breaker would not be interrupted, and could, in principle be sustained for seconds or minutes and eventually damage the circuit breaker.
If a breaker fails to clear a fault, the protection and control system would either detect the improper position of the breaker pallet or the persistence of fault current, and a “breaker failure signal” would initiate the backup current interruption process. In the case of load
60 |
GMDTF Interim Report: Affects of Geomagnetic Disturbances on the Bulk Power System–February 2012 |

Chapter 7–Other Equipment
current interruption, under very large GIC conditions, the contacts would be in the correct position (i.e., open), but the current through the breaker may not be enough to trigger a “breaker failure” signal.
This is a low probability issue, but merits additional research and consideration, especially on the part of circuit breaker manufacturers, and protection and control experts.
7.6 Conductors
GIC may impact line sag, especially if the circuits are stressed under N 1 or N 2 conditions during severe GMD events. The extent of the sag effects is dependent on the line condition, GMD current, and conductor types (see Table 7).
Table 7: Impacts on conductors from GMD
Conductor Types |
Conventional Conductors |
|
|
HTLS Conductors |
|
|
|||
ACSR |
AAAC |
AAC |
ACCC |
ACSS/TW |
GAP |
ACCR |
INVAR |
ACSS |
|
|
Drake |
Greeley |
Arbitus |
Drake |
Suwanee |
Drake |
Drake |
Drake |
Drake |
Al Cross sectional Area (kcmil) |
795 |
927.2 |
795 |
1026 |
959.6 |
815.4 |
824 |
694 |
795 |
Conductor OD (in.) |
1.108 |
1.108 |
1.1026 |
1.108 |
1.108 |
1.095 |
1.128 |
1 |
1.108 |
DC @ 20 oC (ohm/kft) |
0.0214 |
0.0217 |
0.0217 |
0.0163 |
0.0172 |
0.0218 |
0.0201 |
0.0246 |
0.0208 |
AC @ 25 C (ohm/kft) |
0.0221 |
0.0226 |
0.0227 |
0.0169 |
0.0178 |
0.0224 |
0.205 |
0.0247 |
0.0215 |
AC @ 75 C (ohm/kft) |
0.0263 |
0.0263 |
0.027 |
0.0202 |
0.0213 |
0.0268 |
0.0246 |
0.0295 |
0.0257 |
Operating Current at 1200 A |
|
25 o C Ambient temp, Sea level, 30 degree North latitude, Wind 2 ft/sec, 0.5 |
|
||||||
|
absorptivity/emissivity, Solar Radiation 96 W/ft 2 ; 1000 ft Ruling Span |
|
|||||||
|
|
|
|||||||
Conductor Temp oC |
112 |
110 |
118 |
91 |
95 |
114 |
105 |
129 |
110 |
AC Resistance (ohm/kft) |
0.0294 |
0.0290 |
0.0307 |
0.0212 |
0.0228 |
0.0301 |
0.0271 |
0.0347 |
0.0287 |
Sag (ft) (after NESC Heavy) |
30 |
27.9 |
N/A |
17.1 |
27.6 |
19.6 |
25.4 |
24.1 |
27.2 |
DC Resistance (ohm/kft) |
0.0294 |
0.0285 |
0.0291 |
0.0210 |
0.0224 |
0.0292 |
0.0263 |
0.0343 |
0.0284 |
DC Resistance (% over ACSR) |
100% |
97% |
99% |
71% |
76% |
99% |
89% |
117% |
97% |
GIC Impact |
|
|
GMD E Field: 5V/km=1.524 V/kft |
|
|
|
|||
GIC (A) |
51.9 |
53.5 |
52.4 |
72.7 |
68.0 |
52.2 |
58.1 |
44.5 |
53.7 |
Total Current (A) w GIC |
1251.9 |
1253.5 |
1252.4 |
1272.7 |
1268.0 |
1252.2 |
1258.1 |
1244.5 |
1253.7 |
Conductor Temp (oC) w GIC |
120 |
119 |
127 |
99 |
103 |
122 |
114 |
138 |
118 |
New Sag (ft) w GIC |
30.4 |
29.3 |
N/A |
17.1 |
28.1 |
20 |
25.7 |
24.2 |
27.7 |
Temp Increase (oC) w GIC |
8 |
9 |
9 |
8 |
8 |
8 |
9 |
9 |
8 |
Sag Increase (ft) w GIC |
0.4 |
1.4 |
N/A |
0 |
0.5 |
0.4 |
0.3 |
0.1 |
0.5 |
Effects of Geomagnetic Disturbances on the Bulk Power System–February 2012 |
61 |

Chapter 8–Power System Analysis
8.Power System Analysis
8.1 Introduction
There has been a great deal of work during the last two decades devoted to the modeling of GIC flows in a power network. However, modeling of the effects of GIC on power apparatus and system performance during a GMD event is not as well developed. Because the most likely outcome from a large GMD event is voltage instability exacerbated protection and control failures, this area requires more work by industry to develop mitigation strategies.
From the point of view of a power system engineer, what to model and how to model it depends on the intended uses of the simulation. In this chapter, modeling guidelines are organized based on how power system engineers would complete their analysis to ensure the proper operation of the bulk power system and the protection of major assets during a GMD event.
The diagram below summarizes the effects of GIC on the power system stemming from transformers entering half cycle saturation (see Chapter 5). Saturation generates harmonics (including even harmonics). Both transformer half cycle saturation and harmonics can have a negative effect on transformers causing heating and high levels of reactive absorption, while harmonics in the high voltage (HV) network can cause problems in the performance of protective relays (see Chapter 6).
Figure 32: Effects of GIC in an HV transmission network
|
|
|
|
GIC flows in lines |
|
|
|
|
|
|
|
|
|||||
|
|
|
|
|
|
|
|
|
|
|
|
|
|
|
|
|
|
|
|
|
|
|
|
|
|
|
|
|
|
|
|
|
|
||
|
|
|
Transformer half-cycle saturation |
|
|
|
Reactive power loss |
|
|
||||||||
|
|
|
|
|
|
|
|
|
|
|
|
|
|
|
|
|
|
|
|
|
|
|
|
|
|
|
|
|
|
|
|
|
|
||
|
|
|
|
|
|
|
|
|
|
|
|
|
|
|
|||
|
|
|
Harmonics |
|
|
|
Transformer heating |
|
|
|
|
|
|||||
|
|
|
|
|
|
|
|
|
|
|
|
|
|
|
|||
|
|
|
|
|
|
|
|
|
|
|
|
|
|
|
|
|
|
|
|
|
|
|
|
|
Capacitor bank or SVC |
|
|
|
|
|
|
|
|||
|
|
P&C incorrect |
|
|
|
|
|
|
Voltage control, limits, |
|
|||||||
|
|
|
|
Tripping – loss or reactive |
|
|
|
|
|
||||||||
|
|
|
operation |
|
|
|
|
contingency management |
|
||||||||
|
|
|
|
|
|
support |
|
|
|
|
|||||||
|
|
|
|
|
|
|
|
|
|
|
|
|
|
||||
|
|
|
|
|
|
|
|
|
|
|
|
|
|
|
|||
|
|
|
|
|
|
|
|
|
|
|
|
|
|
|
|||
|
|
|
|
|
|
|
|
|
|
|
|
|
|
|
|
|
|
|
|
|
|
|
|
|
|
|
|
|
|
|
|
|
|||
Generator overheating and |
|
|
|
|
|
|
|
|
|
|
|
|
|||||
|
|
|
|
|
|
|
|
Voltage and angle stability |
|
||||||||
|
|
|
tripping |
|
|
|
|
|
|
|
|
|
|||||
|
|
|
|
|
|
|
|
|
|
|
|
|
|
|
|||
|
|
|
|
|
|
|
|
|
|
|
|
|
|
|
|
||
|
|
|
|
|
|
|
|
|
|
GIC simulations |
Power system simulations |
||||||
|
|
|
|
|
|
|
|
|
|
||||||||
Harmonics can cause current overloading and tripping of capacitor banks, as well as overheating and generator tripping (see Chapter 7). In order to assess the level of saturation and, thus, harmonics, it is necessary to know the distribution of GIC flows in the bulk power
62 |
GMDTF Interim Report: Affects of Geomagnetic Disturbances on the Bulk Power System–February 2012 |

Chapter 8–Power System Analysis
system. Transformer saturation also affects the power system because the magnetizing currents of the transformer become so large (albeit very distorted) that the effective magnetizing reactance becomes very small during a fraction of cycle. In power flow terms, the effective shunt reactance of the transformer now becomes a “sink” for reactive power and its reactive power consumption increases, or alternatively, there is an effective reactive power loss in the system. The balance of reactive power in the system has a direct impact on system voltages. There are limits for maximum and minimum voltages for the reliable and secure operation of the power system, as well as limits for line loadability and post contingency performance (i.e., the system has to be able to operate properly after an accepted contingency, such as fault and subsequent loss of a circuit takes place). These issues are normally studied with power flow simulations. To carry out these assessments, knowing the distribution of GIC flows in every line and transformer of the system under a number of different conditions is necessary.
8.2 Calculation of GIC in a High-Voltage Network
There are a number of complex phenomena that cause changes in Earth’s magnetic field and, in turn, induce voltages in high voltage transmission circuits. These induced voltages are the electromotive force that causes GIC to flow if there is a closed path for currents to circulate. These currents have a low frequency (below 1 Hz); therefore, the entire power network can be described using resistances.
General simulation guidelines:
The potential induced by the time varying magnetic field is modeled as a voltage source in series with the transmission line.103 The magnitude of the voltage source depends on the relative orientation of the geoelectric field and the geographical orientation of the transmission circuit. If the geoelectric field can be assumed to be constant in the geographical area of a transmission circuit, then only the coordinates of the end points of the line are important regardless of routing twists and turns. The end points of a circuit are defined as the buses to which transformers and/or other circuits are connected.
The transmission line is modeled as a resistor. The DC resistance at operating temperature should be used. Conductor tables typically provide this information.
The network can be modeled as a single phase network since the spatial distances between conductors of a transmission circuit are negligible compared to the distance of the transmission circuit to the electrojet. That is why GICs are often referred to as zero sequence currents (they are the same in all phases).
Transformers can be modeled by their winding resistance to ground. In the case of an autotransformer, the resistance of common and series windings should be modeled separately.
103 D. H. Boteler, R. J. Pirjola, “Modelling Geomagnetically Induced Currents Produced by Realistic and Uniform Electric Fields,” IEEE Transactions on Power Delivery, vol. 13, no. 4, October 1998, pp. 1303 1308.
Effects of Geomagnetic Disturbances on the Bulk Power System–February 2012 |
63 |

Chapter 8–Power System Analysis
Equivalent station grounding resistance Rg should be modeled, if known. This is the equivalent resistance of the station grounding mat and the ground wire of all transmission circuits connected to the station grounding mat.
Shunt reactors and shunt capacitors do not have to be modeled. Shunt capacitors represent an infinite resistance to near DC currents and shunt reactors are normally connected to tertiary transformer windings and are largely decoupled from the DC network. HV line reactors can be included into the network, but their resistance is usually larger than the transformer winding resistance and their effect is not as important.
Only transformers with a galvanic path between neutral and ground have to be modeled.
Transmission lines below 230 kV are typically not modeled because the resistances of conductors used in lines 115 kV and below are usually much higher than those used in circuits 230 kV and above.
Interconnections to other utilities can be modeled as a transmission line terminated in a transformer. Normally the approximate geographical orientation and length of the circuits to the neighboring utility transmission station are known, and generic resistance values can be used based on voltage level and interconnection capacity.
Once the DC network and the voltages induced on the transmission circuits are known, the calculation of the distribution of DC currents in every branch of the network will provide the GIC flows throughout the studied system. These can be used for further detailed study of equipment vulnerability.
8.3 Calculation of Geoelectric Fields in an HV Network
During a GMD event, the voltages induced on transmission circuits at any one point in time depend on a number of complex factors that depend on the interaction between the solar wind, the electrojet and Earth’s magnetic field.104 The geology of the area and geographical location of the transmission circuits also have a strong influence on the induced earth potentials. If the intent of the study is to calculate the GIC flows on every branch of the system in real time, then magnetic field changes in the area under study must be known and the induced potential can be calculated with a number of well established methods.105 If a time series of the magnetic field is known or measured, it is possible to calculate the time series of induced potentials. This calculation could also be used in a real time simulation for situational awareness or to study time dependent phenomena, such as transformer spot heating during a GMD event.
104D. H. Boteler, R. J. Pirjola, “Modelling Geomagnetically Induced Currents Produced by Realistic and Uniform Electric Fields,” IEEE Transactions on Power Delivery, vol. 13, no. 4, October 1998, pp. 1303 1308.
105Viljanen, A.; , "Relation of geomagnetically induced currents and local geomagnetic variations," Power Delivery, IEEE Transactions on , vol.13, no.4, pp.1285 1290, Oct 1998
64 |
GMDTF Interim Report: Affects of Geomagnetic Disturbances on the Bulk Power System–February 2012 |

Chapter 8–Power System Analysis
If the purpose of the study is to determine the prevalent GIC flows in lines and transformers for planning purposes, the calculation of the voltages induced in transmission circuits can follow a different approach:
Assume an average geoelectric potential of, say 2, 4, 10, etc. V/km. The highest peak
geoelectric potentials in the Hydro Québec system during the March 1989 GMD was 1.7 V/km.106
Calculate GICX flow assuming that the direction of the electric field is east west
Repeat the calculation assuming that the direction of the electric field is north south and obtain GICY.
If the electric field can be assumed to be uniform, then the GIC flow in any line and
transformer in the system will be the linear combination of the GICX and GICY and the maximum GIC flow is demonstrated in Equation 1.
Equation 1: Maximum GIC flow in any line
GICmax  GICx2 GICy2
The maximum GIC in a given line or transformer will occur when the direction of the electric field (assuming a reference E W field as zero angle) is demonstrated in Equation 2.
Equation 2: Maximum GIC flow in a given line
electric tan 1 (GICy / GICx )
Note that the GICMAX obtained this way reflects the maximum currents that could flow for a given electric field assumption. This maximum current does not flow in every part of the network at any given point in time because the direction of the geoelectric field changes with time. To assess the performance of the power network, the average geoelectric field assumption must be made first.
8.4 Calculation of Reactive Power losses Due to GIC
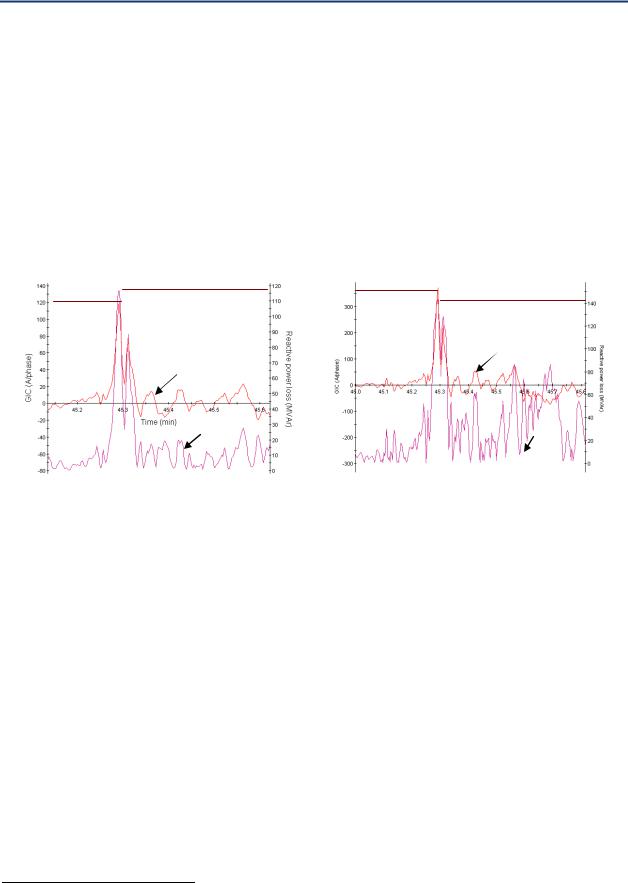
When a transformer enters half cycle saturation, the effective magnetizing reactance of a transformer becomes small and from the point of view of active and reactive power flows, the transformer effectively absorbs more reactive power than when it is not saturated. The amount of reactive power absorbed by a transformer is directly proportional to the flux linkages produced by the GIC in the winding, as well as the core form of the transformer (e.g., single phase core, three legged, three phase, etc.).
A number of approximate relationships between GIC and reactive power loss can be found in technical literature.107,108 Figure 33 (on the following page) shows a sample reactive power loss
for a single phase transformer 100 year reference storm. Using such relationships and the GIC
106Bolduc, L.; Langlois, P.; Boteler, D.; Pirjola, R., “A study of geoelectromagnetic disturbances in Quebec. I. General results “, IEEE Transactions on Power Delivery, Volume: 13 , 1998 , pp. 1251 – 1256.
107X. Dong, Y. Liu, J. G. Kappenman, “Comparative Analysis of Exciting Current Harmonics and Reactive Power Consumption from GIC Saturation Transformers,” IEEE Power Engineering Society Meeting, 2001, pp. 318 322.
108L. Marti, J. Berge, and R. K. Varma, "Determination of Geomagnetically Induced Current Flow in a Transformer from Reactive Power Absorption", Submitted to IEEE Transactions on Power Delivery
Effects of Geomagnetic Disturbances on the Bulk Power System–February 2012 |
65 |
Chapter 8–Power System Analysis
flows in the transformers expected for a given geoelectric field scenario, it is possible to conduct a number of important assessments:
1.Real time simulation of GIC flows in a power network for system operator situational awareness.
2.Credible maximum scenarios, such as the ones described in Chapter 4.
3.Support for load flow studies and assessment of operating limits described in Chapter 9.
Figure 33: Sample reactive power loss 1 phase 500/16.7 kV transformer bank 100 year reference storm
(a) 5 kV high conductivity and (b) 20 V/km low conductivity
116 MVAr
370 A
120 A |
143 MVAr |
|
GIC
GIC
|
Q-loss |
Q-loss |
|
|
|
(a) |
|
(b) |
8.5 Calculation of Harmonics Due to GIC
As indicated in earlier chapters, when a transformer enters into half cycle saturation, magnetizing currents become large and distorted, which is equivalent to saying the transformer injects harmonics into the HV network. The presence of harmonics is a potential problem for protective relaying (see Chapter 6). Substantial harmonic currents could also have an adverse effect on shunt compensation capacitor banks (see Chapter 7).
At this time, the tools to calculate harmonics as a function of GIC flows are relatively limited to transient analysis simulations with one of the family of electromagnetic transients programs or with approximation techniques.109 Electromagnetic transient simulations tend to be complex and not well suited to simulate full scale interaction of GIC and transformer saturation. However, next generation simulators will ease this problem thanks to a two dimensional graphical user interface capable of representing a complex network and estimating harmonic voltages. Nevertheless, it would be prudent for the planning engineer to be qualitatively aware of the presence of harmonics and their potential effects. The magnetizing current harmonics for a transformer design can be accurately performed for different levels of GIC using the actual design parameters of the transformer.
109 L. Marti, J. Berge, and R. K. Varma, "Determination of Geomagnetically Induced Current Flow in a Transformer from Reactive Power Absorption", Submitted to IEEE Transactions on Power Delivery
66 |
GMDTF Interim Report: Affects of Geomagnetic Disturbances on the Bulk Power System–February 2012 |

Chapter 8–Power System Analysis
8.6 Assessment of Equipment Performance
In order to assess the performance of major power apparatus under GIC, it is necessary to know the stresses imposed on equipment and their withstand characteristics when exposed to those stresses.
The determination of stresses, namely GIC during a GMD event, can be calculated using the guidelines discussed in this chapter and Attachment 8, using the maximum credible scenarios discussed in Chapter 4 or variations based on the simulations of the power network discussed in the next section. However, such maximum credible threats are not yet an industry standard for use by equipment manufacturer to test the performance under credible and reproducible GIC stresses. That said, these hazard levels can be used by planners to determine impacts and take mitigating actions, balanced against the risk to reliability and overall organizational goals.
As discussed, GIC capability vs. load of major equipment, such as transformers, cannot be generalized because the effects are dependent on design and construction details of the transformer and will be different depending on the duration of the GIC pulses. GIC withstand characteristics of major equipment, such as transformers, cannot be generalized because the effects are dependent of design and construction details. Another difficulty is that there are no testing standards against which to assess equipment withstand. This is an area that still requires much work. Industry transformer standards associations (IEEE/IEC) are encouraged to develop such standards.
Therefore, in terms of equipment performance, conservative use of engineering judgment in combination with information equipment manufacturers provide to support that judgment, should be used to assess the effects from GMD events.
8.7 Power System Modeling and Analysis Approaches
Power system modeling and analysis of GMD events involves a comparison of the power system under steady state conditions and when subjected to GIC flows. For context, the power system is operating under normal conditions when:
Generation supplies load and losses.
Bus voltage magnitudes are within accepted limits.
Generation operates within specified real and reactive power limits.
Transmission lines and transformers are not overloaded.
All the conditions above are respected after an accepted contingency, such as a bus fault or protective relaying misoperation.
8.7.1 Load Flow Analysis
Many of the potential adverse effects of a GMD event are caused by transformer half cycle saturation, which causes the injection of harmonics in the high voltage network and the effective reactive power losses in heavily saturated transformers. The link between the distribution of GIC flows in the network and the performance of the system under steady state conditions is reactive power losses. As indicated in Chapter 8, the relationship between GIC
Effects of Geomagnetic Disturbances on the Bulk Power System–February 2012 |
67 |

Chapter 8–Power System Analysis
flow in a transformer winding and effective reactive power loss depends on the transformer type (e.g., two three winding, number of transformer legs, autotransformer, etc.) and construction of the transformer (e.g., single phase versus three phase, three legged core type). Using relationships such as those proposed in Dong et. al., and Marti et. al., the reactive power loss of every transformer in the system can be estimated and modeled in a load flow program as static reactive loads connected to the transformers. The value of these additional reactive loads changes with GIC, which changes according to the direction and magnitude of the geoelectric field during a GMD event.
There is no simple way to predict the behavior of the power system under all possible GMD events and system configurations. There are, however ways to reduce the number of studies required to manageable levels. For instance:
Determine the directions of the geoelectric field that cause the largest loss of reactive power in key parts of the network. These key parts are system specific but generally known to experienced planning engineers.
Assume that equipment is not vulnerable and increase the maximum geoelectric field until post contingency voltages or overloading requires control action.
Once the limits and scenarios from the point of view of operational performance have been identified, equipment vulnerability, if known (e.g., effects from one of more SVCs tripping) can be included.
The approach suggested above is not a recommendation or guideline. Rather, it illustrates that when the distribution of GIC flows and associated loss of reactive power are known (or reasonably estimated), determining the behavior of the system becomes a substantial but manageable power system analysis problem.
8.7.2 Harmonic Analysis
As discussed above, half cycle transformer saturation can inject a substantial amount of harmonics into the high voltage network. In addition to the potential for relay misoperation discussed in Chapter 6, and potential generator damage/tripping discussed in Chapter 7, there is, in principle, the potential for harmonic resonance. The most common way to carry out harmonic resonance studies is to use the Electromagnetic Transients (EMTP) programs. This is not a trivial exercise. It is nevertheless an important class of studies because the power system is not normally subjected to a sustained mix of even and odd harmonics.
8.7.3 Mitigation Measures by Design
Low cost, low risk, equipment specification practices are available that could increase resilience to GMD events. For instance:
Specify GIC withstand on new transformers. Until such time as industry standards specify levels and testing protocols, withstand levels need to be determined on the basis of system studies. Note that transformer manufacturers may not be able to do a GIC flow withstand test. Such a test requires two auto transformers energized in parallel on the test floor with DC circulating between them. The MVAr required for two saturated transformers is beyond the capacity of most transformer plants.
68 |
GMDTF Interim Report: Affects of Geomagnetic Disturbances on the Bulk Power System–February 2012 |