

Geomagnetic_Disturbance_Task_Force_2012
.pdfChapter 5–Power Transformers
Figure 20: Magnetizing current pulse drawn from power grid under (AC+DC) excitation
5.2.1 Factors that Determine the Behavior of Half-Cycle Saturation
The magnitude of DC flux offset in the core depends on the magnetic reluctance of the DC flux path. Thus, the DC flux offset in a three phase, three legged, core form transformer would be the lowest of all transformer core types because the design offers an order of magnitude higher magnetic reluctance to the DC amp turns in the core tank magnetic circuit (see Figure 21). The DC flux passes through the high reluctance path from the core top yoke to the tank cover, through the tank walls, and returns to the bottom yoke and again through the high reluctance path from the tank bottom. All other core types offer much less reluctance to the DC ampere turns because the return path for this DC flux is through the core, which has orders of magnitudes higher permeability (see Figure 21 below). Core material and core joint type have some influence; however, this influence is small and depends on the core type and the operating flux density in the core. The influence of core material and joint type decreases even further for high magnitudes of GIC.
Effects of Geomagnetic Disturbances on the Bulk Power System–February 2012 |
29 |

Chapter 5–Power Transformers
Figure 21: Core DC flux path in various core types
*
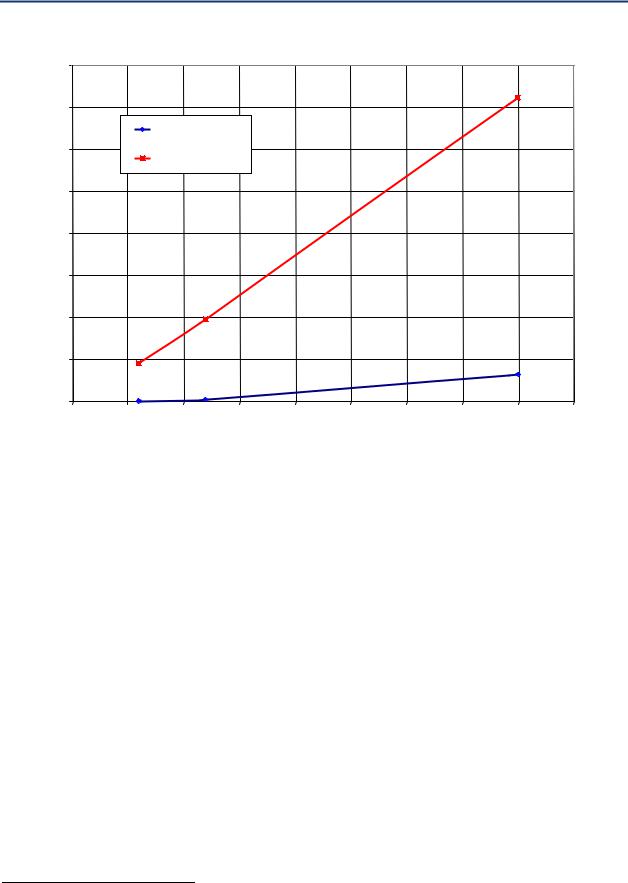
To illustrate, Figure 22 (below) shows the percentage magnetizing current drawn by two different types of power transformers,55 a large single phase power transformer with a three egged core and a large three phase power transformer with a three legged core. The excitation current drawn by the three phase, three legged transformer is much smaller than that of the single phase transformer for the same value of DC winding current.
55.R. Girgis, K. Vedante, “Effects of GIC on Power Transformers and Power Systems”, To be presented at IEEE T&D Conference May 2012
30 |
GMDTF Interim Report: Affects of Geomagnetic Disturbances on the Bulk Power System–February 2012 |
Chapter 5–Power Transformers
Figure 22: RMS magnetizing current for two transformers with two different core types
|
8 |
|
Percent [%] Excitation Current versus DC Current |
|
|
|
||||
|
|
|
|
|
|
|
|
|
|
|
|
7 |
|
|
|
|
|
|
|
|
|
|
|
|
3-Phase, 3-Limb XFMR |
|
|
|
|
|
|
|
|
6 |
|
1-Phase XFMR |
|
|
|
|
|
|
|
|
|
|
|
|
|
|
|
|
|
|
Current |
5 |
|
|
|
|
|
|
|
|
|
|
|
|
|
|
|
|
|
|
|
|
% Excitation |
4 |
|
|
|
|
|
|
|
|
|
3 |
|
|
|
|
|
|
|
|
|
|
|
|
|
|
|
|
|
|
|
|
|
|
2 |
|
|
|
|
|
|
|
|
|
|
1 |
|
|
|
|
|
|
|
|
|
|
0 |
|
|
|
|
|
|
|
|
|
|
0 |
5 |
10 |
15 |
20 |
25 |
30 |
35 |
40 |
45 |
DC Current/Phase
5.2.2 Harmonic Content of the Magnetizing Current during Half-Cycle Saturation
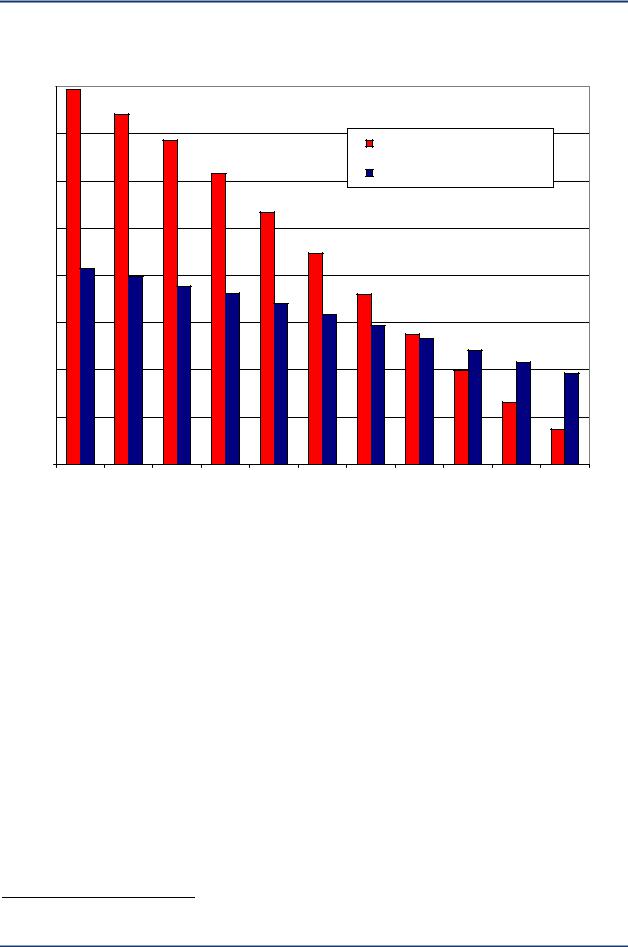
Typically, when three phase transformers with a three legged core are subjected to GIC, they have narrower excitation current pulses compared to corresponding magnetizing current pulses of transformers with other core types.56 The magnetizing current pulse of three phase transformers has higher amplitudes of the lower order harmonics and much lower amplitudes of the high order harmonics (see Figure 23 as a representative case). For other core types represented by the single phase transformer data below, the magnetizing current pulse has uniform amplitudes between low order and high order harmonics. Therefore, these transformers have a significant content of higher order harmonics. Other impacts from the introduction of GIC to the power system are covered in more detail in Chapter 6 (Protection and Control), Chapter 7 (Other Equipment), and Chapter 8 (Power System Analysis).
56R. Girgis, K. Vedante, “Effects of GIC on Power Transformers and Power Systems”, To be presented at IEEE T&D Conference May 2012
Effects of Geomagnetic Disturbances on the Bulk Power System–February 2012 |
31 |
Chapter 5–Power Transformers
Figure 23: Harmonic content of magnetizing current during half cycle saturation
Harmonics Spectrum of Excitation current under DC Conditions
|
16% |
|
|
|
|
|
|
|
|
|
|
|
14% |
|
|
|
|
|
3 - Phase, 3 - Limb Transformer |
|
|||
|
|
|
|
|
|
|
|
||||
|
12% |
|
|
|
|
|
1 - Phase Transformer |
|
|
||
|
|
|
|
|
|
|
|
|
|
|
|
Amplitude |
10% |
|
|
|
|
|
|
|
|
|
|
|
|
|
|
|
|
|
|
|
|
|
|
Harmonics |
8% |
|
|
|
|
|
|
|
|
|
|
6% |
|
|
|
|
|
|
|
|
|
|
|
% |
|
|
|
|
|
|
|
|
|
|
|
|
|
|
|
|
|
|
|
|
|
|
|
|
4% |
|
|
|
|
|
|
|
|
|
|
|
2% |
|
|
|
|
|
|
|
|
|
|
|
0% |
|
|
|
|
|
|
|
|
|
|
|
60 |
120 |
180 |
240 |
300 |
360 |
420 |
480 |
540 |
600 |
660 |
Harmonic Frequency, Hz
5.2.3 Thermal Effects of GIC on Power Transformers
When GIC cause half cycle saturation, flux “flows” through structural elements of the transformer, such as tank, tie plates, and core support, rather than through the transformer laminated steel core. Heat is generated by the eddy currents induced by changing off core flux, causing hot spot heating. Winding and structural element hot spots are the inevitable effects of saturation. Off core or stray flux due to half cycle saturation has different characteristics than stray flux caused by overexcitation.
Hot spot heating can degrade the mechanical strength of winding insulation elements. The Institute of Electrical and Electronic Engineers (IEEE) Standard C57.91 1995 sets definite limits on hot spot temperature for steady state and short time emergency loading. These limits were specified for overload conditions and are not applicable to half cycle saturation conditions. Additionally, the standards are silent regarding the adverse effects of overheating by a given temperature over a given time period, but there are some well known empirical relationships that associate an expected reduction in the expected life of dielectric insulation with the magnitude and duration of overheating.57
57 R. D. Vecchio, B. Poulin, P. Feghali, D. M. Shah, R. Ahuja, Transformer Design Principles, 2nd Edition, CRC Press, 2010
32 GMDTF Interim Report: Affects of Geomagnetic Disturbances on the Bulk Power System–February 2012
Chapter 5–Power Transformers
If construction and design details of a transformer are known, it is possible to estimate the
amount of winding and structural elements heating by mathematical modeling, and to relate it to the amount of GIC flowing through the windings.58,59,60 For instance, the calculated
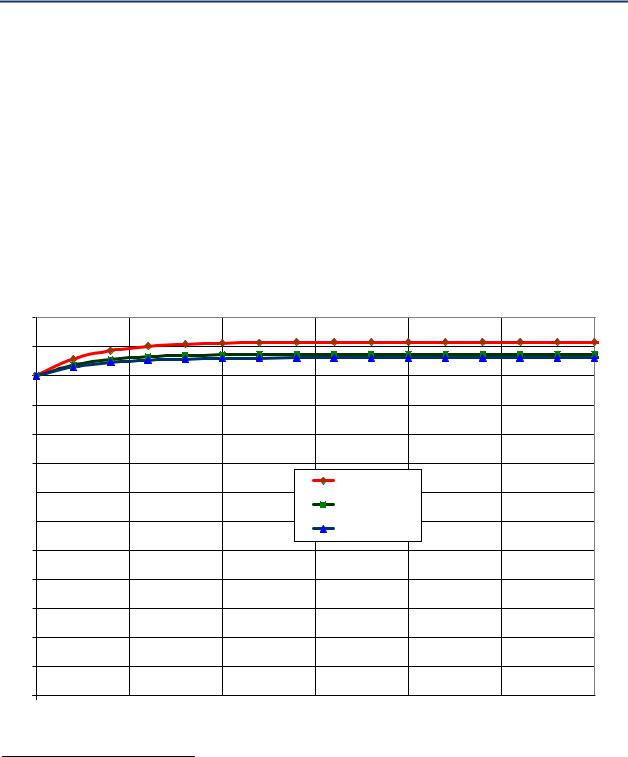
temperature rise as a function of time for a single phase 750 MVA, 345/24.5 kV (three phase) transformer is shown in Figures 24 and 25.61 For this transformer, the temperature rise time constant in the tie plate due to a step GIC excitation is approximately five minutes.
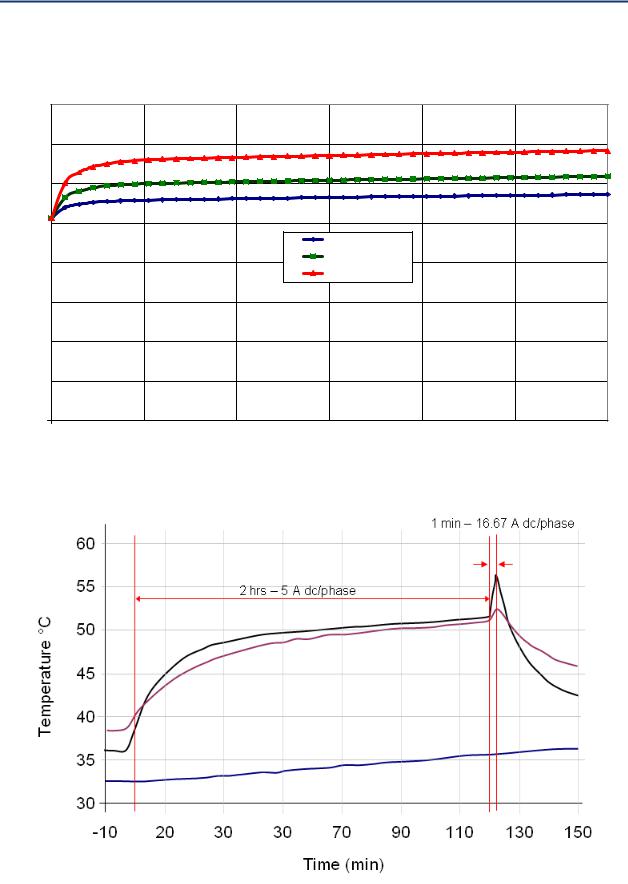
This temperature rise as a function of GIC can also be obtained from actual measurements if such measurements are specified as part of acceptance tests. For instance, Figure 26 shows the measured temperature rise of a 400 MVA, 550/16.5 kV bank (single phase).62
Figure 24: Winding hot spot temperatures for various values of DC current.
Wdg Hot Spot Tempt, Degree C
Winding Hot Spot Temperature vs Time, 1-Phase Transformer
130 |
|
|
|
|
|
|
120 |
|
|
|
|
|
|
110 |
|
|
|
|
|
|
100 |
|
|
|
|
|
|
90 |
|
|
|
|
|
|
80 |
|
|
|
|
|
|
70 |
|
|
|
Idc = 50 Amps |
|
|
|
|
|
Idc = 30 Amps |
|
|
|
60 |
|
|
|
|
|
|
|
|
|
Idc = 20 Amps |
|
|
|
|
|
|
|
|
|
|
50 |
|
|
|
|
|
|
40 |
|
|
|
|
|
|
30 |
|
|
|
|
|
|
20 |
|
|
|
|
|
|
10 |
|
|
|
|
|
|
0 |
|
|
|
|
|
|
0 |
5 |
10 |
15 |
20 |
25 |
30 |
|
|
|
Time, Minutes |
|
|
|
58Nobuo Takasu, et al, “An experimental analysis of DC excitation of transformers by geo magnetically induced currents,” IEEE Transactions on Power Delivery, vol. 9, no. 2, April 1994, p 1173 1182.
59X. Dong, Y. Liu, J. G. Kappenman, “Comparative Analysis of Exciting Current Harmonics and Reactive Power Consumption from GIC Saturation Transformers,” IEEE Power Engineering Society Meeting, 2001, pp. 318 322.
60P. R. Price, Geomagnetically Induced Current Effects on Transformers,” IEEE Transactions on Power Delivery, vol. 17, no. 4, October 2002.
61R. Girgis, K. Vedante, “Effects of GIC on Power Transformers and Power Systems”, To be presented at IEEE T&D Conference
May 2012
62 L. Marti, A. Rezaei Zare, A. Narang, “Simulation of Transformer Hot Spot Heating due to Geomagnetically Induced Currents,” submission to IEEE Transactions on Power Delivery.
Effects of Geomagnetic Disturbances on the Bulk Power System–February 2012 |
33 |
Chapter 5–Power Transformers
Figure 25: Plate temperature for different values of DC current
Flitch-Plate Temperature vs Time
|
160 |
|
|
|
|
|
|
|
140 |
|
|
|
|
|
|
|
120 |
|
|
|
|
|
|
C |
|
|
|
|
|
|
|
Degree |
100 |
|
|
|
|
|
|
|
|
|
Idc = 20 Amps |
|
|
|
|
Tempt, |
|
|
|
|
|
|
|
80 |
|
|
Idc = 30 Amps |
|
|
|
|
|
|
Idc = 50 Amps |
|
|
|
||
|
|
|
|
|
|
||
Flitch-Plate |
|
|
|
|
|
|
|
60 |
|
|
|
|
|
|
|
|
|
|
|
|
|
|
|
|
40 |
|
|
|
|
|
|
|
20 |
|
|
|
|
|
|
|
0 |
|
|
|
|
|
|
|
0 |
20 |
40 |
60 |
80 |
100 |
120 |
Time, Minutes
Figure 26: Measured temperature characteristic of a 400 MVA, 550/16.5 kV bank (single phase)
Tie plate points
Bottom oil
34 |
GMDTF Interim Report: Affects of Geomagnetic Disturbances on the Bulk Power System–February 2012 |

Chapter 5–Power Transformers
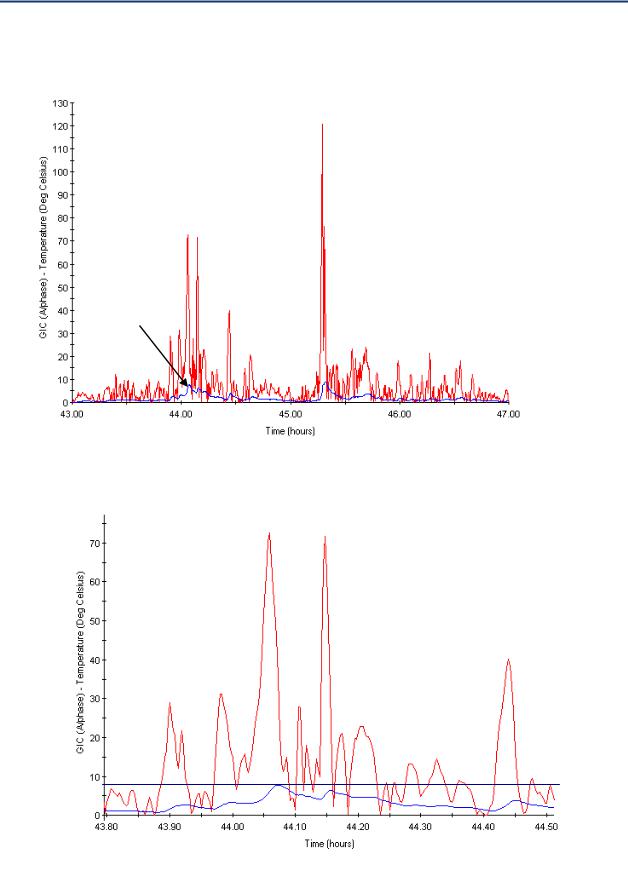
If the temperature response as a function of GIC is known, it is possible to approximate the transformer thermal behavior as a black box and examine the incremental heating due to a GMD event or pre defined test function.63 For instance, using the 100 year scenario corresponding to the 5 V/km electric field (see Chapter 4), the tie plate temperature rise for the 345/24.5 kV 750 MVA transformer is shown in Figure 27. Note that the absolute value of GIC is plotted since the polarity of the current does not have a significant effect on temperature rise. From Figure 27, it is apparent that for this transformer the tie plate temperature rise for these GIC only reaches 8 degrees Celsius.
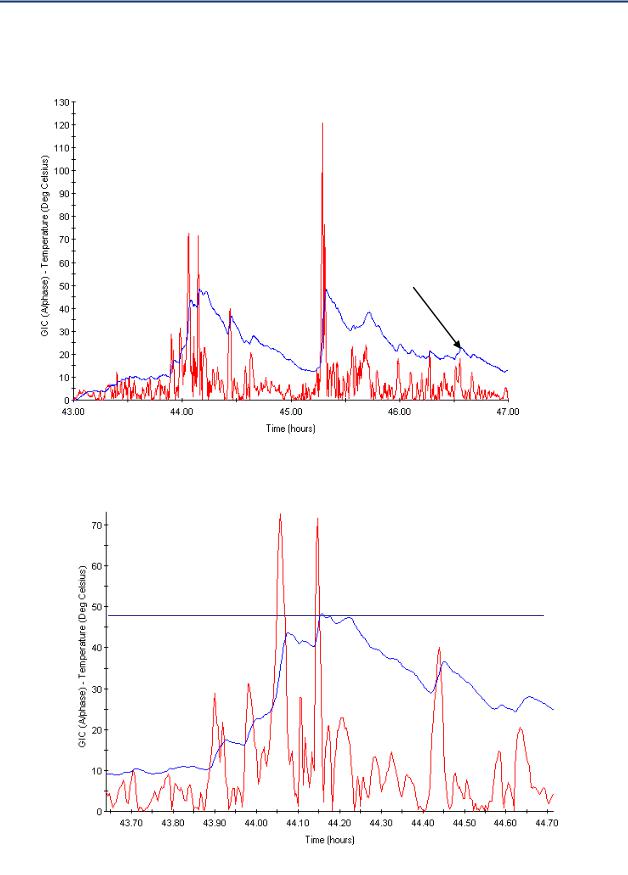
In contrast, using the thermal behavior of the 400 MVA, 500/16.5 kV transformer in Figure 26, the same 100 year scenario produces the response shown in Figure 28. In this case, the temperature rise in the tie plate reaches 48 degrees Celsius for approximately four minutes. The maximum calculated metallic part temperature at full load, oil direct air forced (ODAF) rating for this transformer, assuming 40 degrees Celsius ambient temperature, would be 120 degrees Celsius. This is below the 200 degrees Celsius threshold in IEEE C57.91 1995. Note that the extrapolation from testing at no load/normal ambient to full load/maximum ambient does not take into account reduction in stray losses and increase in cooling rate because of the much higher metallic and oil temperatures.
In the case of the 20 V/km, low conductivity, 100 year scenario, and a 400 MVA, 500/16.5 kV transformer, the maximum calculated metallic part temperature exceeds 200 degrees Celsius for 14 minutes, therefore IEEE C57.91 1995 thresholds would be exceeded. To place this scenario in perspective, this level of GIC represents more than 10 times what was experienced by Hydro Québec and Public Service Electric and Gas (PSE&G) on March 13, 1989. Also, the 14 minute duration is greater than the duration of the highest peaks experienced by the same systems in 1989. For the 750 MVA, 345/24.5 kV transformer, maximum temperature reaches 130 degrees Celsius and the IEEE C57.91 1995 thresholds would not be exceeded. Note that the results in Figures 27 and 28 do not take into account different heating and cooling rates because cooling rates were not available.
63L. Marti, A. Rezaei Zare, A. Narang, “Simulation of Transformer Hot Spot Heating due to Geomagnetically Induced Currents,” submission to IEEE Transactions on Power Delivery.
Effects of Geomagnetic Disturbances on the Bulk Power System–February 2012 |
35 |
Chapter 5–Power Transformers
Figure 27: Tie plate temperature rise and GIC time series. Calculated characteristic of a single phase 345/24.5 kV 750 MVA transformer
(a) Complete 5 V/km 100 years scenario
(a)
Temperature
(b) Zoom in of first substorm
(b)
36 |
GMDTF Interim Report: Affects of Geomagnetic Disturbances on the Bulk Power System–February 2012 |
Chapter 5–Power Transformers
Figure 28: Tie plate temperature rise and GIC time series. Measured characteristics of a 400 MVA, 500/16.5 kV, single phase transformer
(a) Complete 5 V/km 100 years scenario
(a)
Temperature
(b) Zoom in of first substorm
(b)
Effects of Geomagnetic Disturbances on the Bulk Power System–February 2012 |
37 |

Chapter 5–Power Transformers
These examples highlight several points:
Hot spot heating can vary significantly among transformers, even when they appear to be similar in size and construction.
The magnitude, frequency, and duration of the GIC peaks during a substorm are key in assessing the possibility of winding and structural parts heating, and the affect of this heating on transformer condition, performance, and insulation life.
If the calculated or measured heating behavior of a transformer is known, it is possible to ascertain tangible thresholds with a reasonable degree of confidence.
Measurements of GIC heating characteristics can be specified during the commissioning of new units. (Thermocouples need to be installed in key parts for the transformer.)
IEEE and International Electrotechnical Commission (IEC) should design and test standards to improve reliability of transformers during and after GMD events.
Calculation of GIC heating characteristics can be made if the design and construction details are known. Transformer manufacturers have the design information and tools needed to produce the GIC heating characteristics.
Once the heating characteristics are known, it is relatively straightforward to assess temperature thresholds for any type of GMD event or test function.64
5.3 Reported Transformer Effects
This section provides an overview of instances where transformers been reported to be affected by GMD in the literature.
5.3.1 Salem No. 1 Nuclear Plant Generator Step-Up (GSU) Transformer
The Salem No. 1 Nuclear Plant Generator Step Up (GSU) transformer was adversely affected by the March 1989 solar storm.65,66 The GSU is comprised of three single phase transformers and
is rated at 360 MVA, 500 kV Grounded Y – 24 kV Delta [2]. Effects observed during the storm included the following:67,68
50 MVAr (14% of nameplate rating) increase in MVAr demand.
Unacceptable levels of dissolved combustible gases in oil.
High noise levels.
64L. Marti, A. Rezaei Zare, A. Narang, “Simulation of Transformer Hot Spot Heating due to Geomagnetically Induced Currents,” submission to IEEE Transactions on Power Delivery.
65J. Wrubel, “Monitoring for Geomagnetic Induced Current Flow Effects Using Existing EMS Telemetering,” Conference Proceedings of Power Industry Computer Application Conference, 1991, pp. 44 49.
66R. S. Girgis, R. J. Nevins, “Analysis of Observed Geomagnetically Induced Current Effects on Transformers,” Proceedings of EPRI Geomagnetically Induced Current Conference, June 1992, TR 100450.
67R. S. Girgis, R. J. Nevins, “Analysis of Observed Geomagnetically Induced Current Effects on Transformers,” Proceedings of EPRI Geomagnetically Induced Current Conference, June 1992, TR 100450.
68CIGRE Study Committee 12, “Effects of Geomagnetically Induced Currents on Power Transformers,” Electra, no. 141, April 1992.
38 |
GMDTF Interim Report: Affects of Geomagnetic Disturbances on the Bulk Power System–February 2012 |