

Geomagnetic_Disturbance_Task_Force_2012
.pdfChapter 5–Power Transformers
The units were removed from service a week later, and internal inspections were conducted. Internal inspection of all three phases revealed the following:69,70
Charred winding series connections between two parallel low voltage windings.
Degree of burning varied for different series connections.
Phases A and C had burnt connections, but phase B was clean.
The cause of overheating by the low voltage windings was determined to be circulating currents in the series connections.71 The low voltage leads were an old design that consisted of a hundred strands connected by welding joints in two parallel sections of the winding.72 A considerable circulating current would have been established within this connecting lead after the appearance of saturation flux73 potentially caused by GIC flows. A thorough description of these circulating currents and design methods for mitigation can be found in “Calculation Techniques and Results of Effects of GIC Currents as Applied to Two Large Power Transformers.”74
5.3.2 Salem No. 2 Nuclear Plant Generator Step-Up Transformer
On September 19, 1989, a GMD event caused significant GIC flows in the neutrals of the transformers located at the Salem substation. This event was suggested to have caused minor damage to one phase of Salem No. 2 Nuclear Plant GSU. The GSU had the same design as that of Salem No. 1 transformers. However, no details were provided in the published literature. This damaged phase of the GSU was replaced during a subsequent refueling of Salem No. 2. 75
5.3.3 Allegheny Power System (APS)
A three phase, seven leg, core shell form autotransformer rated 210/280/350 MVA, 500kV/138 kV and located at Meadowbrook Substation, was affected by the March 1989 solar storm.76 Effects observed during the GMD included:77
Significant increase in dissolved combustible gases in oil.
Bands of discolored tank paint at four locations78.
69R. S. Girgis, R. J. Nevins, “Analysis of Observed Geomagnetically Induced Current Effects on Transformers,” Proceedings of EPRI Geomagnetically Induced Current Conference, June 1992, TR 100450.
70CIGRE Study Committee 12, “Effects of Geomagnetically Induced Currents on Power Transformers,” Electra, no. 141, April 1992.
71R. S. Girgis, R. J. Nevins, “Analysis of Observed Geomagnetically Induced Current Effects on Transformers,” Proceedings of EPRI Geomagnetically Induced Current Conference, June 1992, TR 100450.
72CIGRE Study Committee 12, “Effects of Geomagnetically Induced Currents on Power Transformers,” Electra, no. 141, April 1992.
73CIGRE Study Committee 12, “Effects of Geomagnetically Induced Currents on Power Transformers,” Electra, no. 141, April 1992.
74Ramsis Girgis and Chung Duck K.O., “Calculation Techniques and Results of Effects of GIC Currents as Applied to Two Large Power Transformers,” IEEE Transactions on Power Delivery, vol. 7, no. 2, April 1992, pp. 699 705.
75J. Wrubel, “Monitoring for Geomagnetic Induced Current Flow Effects Using Existing EMS Telemetering,” Conference Proceedings of Power Industry Computer Application Conference, 1991, pp. 44 49.
76Ramsis Girgis and Chung Duck K.O., “Calculation Techniques and Results of Effects of GIC Currents as Applied to Two Large Power Transformers,” IEEE Transactions on Power Delivery, vol. 7, no. 2, April 1992, pp. 699 705.
77Ramsis Girgis and Chung Duck K.O., “Calculation Techniques and Results of Effects of GIC Currents as Applied to Two Large Power Transformers,” IEEE Transactions on Power Delivery, vol. 7, no. 2, April 1992, pp. 699 705.
78J. G. Kappenman, V.D. Albertson, “Bracing for the Geomagnetic Storms,” IEEE Spectrum, vol. 27, issue 3, 1990, pp. 27 33.
Effects of Geomagnetic Disturbances on the Bulk Power System–February 2012 |
39 |

Chapter 5–Power Transformers
14% increase in MVAr demand.
Increase in harmonic current (THDi = 9.2%).79
Significant increase in noise level (10 15 dB).
The transformer was removed from service, and a detailed internal inspection was performed, revealing no internal damage [4]. Finite element analysis indicated the wooden slats sandwiched between the outer periphery of the core and the tank walls blanketed these regions of the tank walls, which contributed to the heating and caused discoloration of the external tank paint. Citing calculated results from Westinghouse and Allegheny [5], the temperature of the tank wall was estimated to have reached 400 degrees Celsius at some locations of the transformer tank.
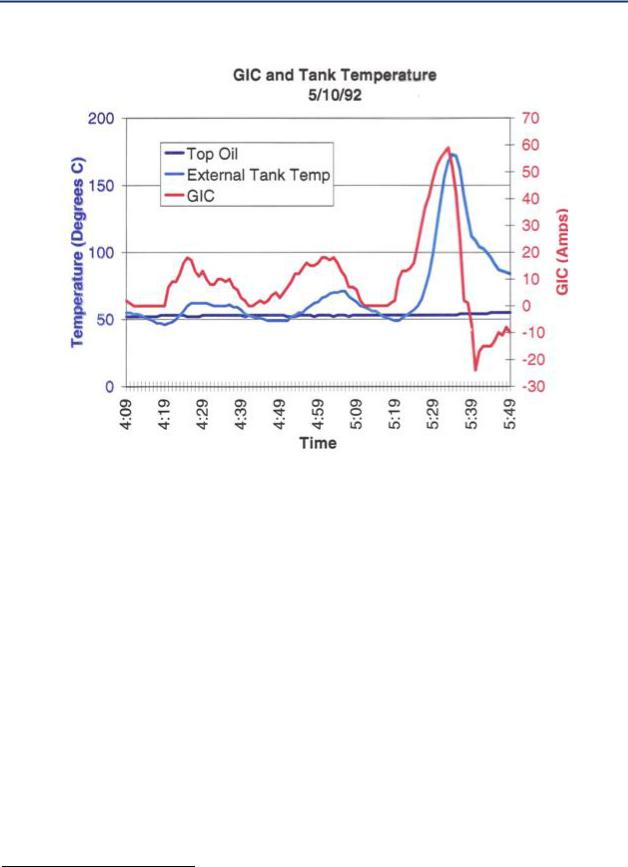
APS experienced an additional GMD event on May 10, 1992.80,81 Figure 29 demonstrates the correlated rise of GIC with tank and oil temperature captured during the event. During the course of the storm, GIC flow in the neutral of the transformer reached a level of approximately 60 amps DC (20 amps per phase) in about 15 minutes with a corresponding steady increase in temperature on the exterior of the tank (see Figure 29). The peak temperature measurement on the exterior of the tank was 173 degrees Celsius, and occurred approximately 1 2 minutes after the peak GIC occurred. The oil temperature rise during the event was negligible.
79NERC March 13, 1989 Disturbance Report.
80Leonard L. Grigsby, Electric Power Engineering Handbook, 2nd Edition, CRC Press, 2007.
81Metatech Corporation for Oak Ridge National Laboratory, “Geomagnetic Storms and Their Impacts on the U.S. Power Grid,” Meta R 319, January 2010, http://www.ornl.gov/sci/ees/etsd/pes/pubs/ferc_Meta R 319.pdf
40 |
GMDTF Interim Report: Affects of Geomagnetic Disturbances on the Bulk Power System–February 2012 |
Chapter 5–Power Transformers
Figure 29: GIC and measured tank temperature82
5.3.4 Eskom, South Africa
After the severe geomagnetic storm in November 2003 (also called the Halloween storms), the levels of some dissolved gasses in the transformers increased rapidly. A transformer at Lethabo Power Station tripped on protection November 17. There was another severe storm November 20, and on November 23 the Matimba #3 transformer tripped on protection, and January 19, 2004, one of the transformers at Tutuka was taken out of service. Two more transformers at Matimba Power Station (#5 and #6) had to be removed from service with high levels of dissolved gas analysis (DGA) in June 2004. A second transformer at Lethabo Power Station tripped on Buchholz protection in November 2004. More information and background on this
event can be found in Transformer Failures in Regions Incorrectly Considered to Have Low GIC Risk. 83
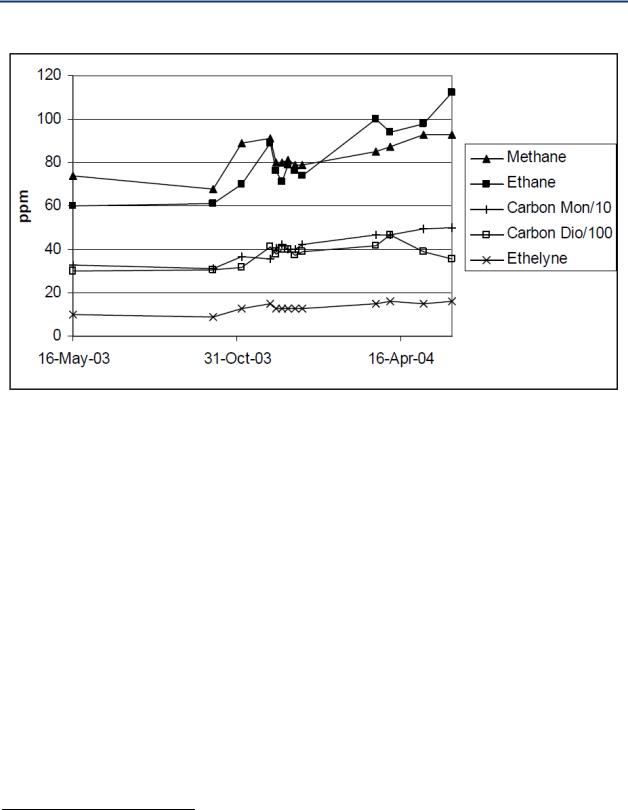
Figure 30 shows the DGA record for one of the Matimba transformers, and is characterized as typical for other Eskom transformers affected by the storm.
82Leonard L. Grigsby, Electric Power Engineering Handbook, 2nd Edition, CRC Press, 2007.
83C. T. Gaunt, G. Coetzee, “Transformer Failures in Regions Incorrectly Considered to Have Low GIC Risk,” IEEE Power Tech 2007, Lausanne, pp. 807 812.
Effects of Geomagnetic Disturbances on the Bulk Power System–February 2012 |
41 |
Chapter 5–Power Transformers
Figure 30: DGA results Matimba #1: May 2003 to June 200484
Figure 30 shows an increase in dissolved gas after the onset of the Eskom storm. The DGA results shown in Figure 30 are consistent with low temperature thermal degradation.
Internal inspection of the failed transformers identified thermal damage to paper insulation in various parts of the transformer, which was found to be consistent with the DGA results. In all cases, the extent of the damage was small, and discoloration of paper insulation beyond the immediate vicinity of the fault location was negligible, which is consistent with low levels of DGA.85 In transformers with corrosive oil, localized heating caused by GIC (especially at leads that were over insulated) could result in the formation of copper sulfide, which can cause dielectric breakdown of winding insulation.
5.3.5 National Grid Company, United Kingdom
Suggestion from Geomagnetically Induced Current Detection and Monitoring86 is that two 400/275 kV autotransformers (Norwich Main and Indian Queens87) failed in southern England during a GMD that occurred on March 13, 1989. Both transformers exhibited significant increases in DGA. No additional details regarding the transformer failures were provided.
84C. T. Gaunt, G. Coetzee, “Transformer Failures in Regions Incorrectly Considered to Have Low GIC Risk,” IEEE Power Tech 2007, Lausanne, pp. 807 812.
85Leonard L. Grigsby, Electric Power Engineering Handbook, 2nd Edition, CRC Press, 2007.
86T. H. Breckenridge, T. Cumming, J. Merron, “Geomagnetically Induced Current Detection and Monitoring,” Developments in Power System Protection Conference, Publication No. 479 IEE 2001
87A. Erinmez, J. G. Kappenman, W. A. Radasky: Management of the geomagnetically induced current risks on the National Grid Company’s electric power transmission system,” Journal of Atmospheric and Solar Terrestrial Physics, 64, 2002, p 743 756.
42 |
GMDTF Interim Report: Affects of Geomagnetic Disturbances on the Bulk Power System–February 2012 |

Chapter 5–Power Transformers
5.3.6 Transpower New Zealand
On November 6, 2001, widespread alarms occurred in many of the monitored South Island transformers in the Transpower New Zealand grid. Around the same time, a transformer at the Halfway Bush Substation tripped.88 No additional details are provided.
5.4 Measured Effects of GIC on Power Transformers
Several experiments have been performed to characterize the effects of GIC on transformers. Both Hydro Québec89 and FINGRID Power90 subjected single phase and three phase power transformers to high levels of DC current for extended time periods. Tests were also conducted by Tokyo Electric Power Corporation, in collaboration with Toshiba, Hitachi, and Mitsubishi, to study several small scale models of core form and shell form transformers with different core types.91 The Idaho National Laboratory has also conducted EMTP tests on transformers, though results of these tests have not yet been published in scientific literature.
5.4.1 Hydro-Québec Tests
The temperature rise in transformers subjected to a DC source of excitation was measured on core form, single phase, 735 kV autotransformers rated at 370 MVA and 550 MVA.92 Injections of 12.5 amps, 25 amps, 50 amps, and 75 amps on the high voltage side were performed for an hour at each DC level. The injection sequence was as follows: one hour at 735 kV without DC current injected, one hour with a DC current of 25 amps, and one hour with a DC current of 75 amps. The initial temperature inside the transformers stabilized at 25 degrees Celsius prior to every test. Test results showed that the tie plates of the particular type of transformer tested were the components most susceptible to rapid temperature rise. The maximum temperature rise above the top oil temperature (of both transformers) was found to be 52 degrees Celsius at the upper end of a tie plate of the 370 MVA class transformer after the circulation of 75 amps DC. Gas analysis was also performed after each DC injection test, and the results did not show notable rise of dissolved gas in oil.
5.4.2 FINGRID Power Tests
FINGRID Power conducted tests on two 400 MVA transformers equipped with 38 thermocouples and 16 optical fiber based temperature sensors. The test adjusted the magnetizing current of a DC generator stepwise, resulting in the increase of neutral current from 50 amps to 200 amps, with increases occurring approximately every 10 15 minutes. Results show that the tested transformers can tolerate, without damage, very high DC currents four times typical of geomagnetic storms. 93
88Transpower New Zealand, System Operators Report, June 2011.
89P. Picher, L. Bolduc et al., “Study of the acceptable DC current limit in core form power transformers,” IEEE Transactions on Power Delivery, vol. 12, no. 1, January 1997, page 257 265.
90Matti Lahtinen and Jarmo Elovaara, “GIC Occurrences and GIC Test for 400 kV System Transformer,” IEEE Transactions on Power Delivery, vol. 17, no. 2, April 2002, page 555 561.
91Nobuo Takasu, et al, “An experimental analysis of DC excitation of transformers by geo magnetically induced currents,” IEEE Transactions on Power Delivery, vol. 9, no. 2, April 1994, p 1173 1182.
92P. Picher, L. Bolduc et al., “Study of the acceptable DC current limit in core form power transformers,” IEEE Transactions on Power Delivery, vol. 12, no. 1, January 1997, page 257 265.
93Matti Lahtinen and Jarmo Elovaara, “GIC Occurrences and GIC Test for 400 kV System Transformer,” IEEE Transactions on Power Delivery, vol. 17, no. 2, April 2002, page 555 561.
Effects of Geomagnetic Disturbances on the Bulk Power System–February 2012 |
43 |

Chapter 5–Power Transformers
5.4.3 Tokyo Electric Power Corporation Tests
Measurements were made of two large scale models with linear dimensions 1/3 to 1/2 of those of actual power transformers. Single phase, three legged, 1,000 kV/550 kV, core form (30 MVA) and shell form (6 MVA) transformers were evaluated. These transformers were tested with a DC current level of up to 66 amps, which corresponds to 400 600 amps/phase for the corresponding full size transformers. DC was continuously applied for 20 30 minutes. The leakage flux and temperatures were measured in windings and structural parts of the transformers. After 30 minutes of large magnitudes of continuous DC current, the maximum temperature measured was approximately 110 degrees Celsius in the core form transformer tie plate and the shell form transformer core support. The paper suggested temperature rises would have been 1/10th of these values if the tie plates and the core support were made of non magnetic steel. The study concluded the short duration of these temperatures would not appreciably affect the transformer life. Also, the short duration of GIC would not allow hot spot temperatures to rise to a fraction of these temperatures. 94
5.4.4 Idaho National Laboratory Tests
The Idaho National Laboratory is conducting a set of experiments in which a 138 kV/13 kV transformer is subjected to a DC current of 120 amps to determine the effects of harmonics on power system equipment and other electrical loads. Results of these experiments were not available at the time of publication.
5.5 Transformer Vulnerability Assessment
Section 9.2.3 of IEEE C57.91 – 1995 summarizes what is currently known in terms of the vulnerability of transformer winding insulation from the perspective of normal and emergency operation winding and other metallic hot spot temperatures:
“9.2.3 Risk considerations
Normal life expectancy loading is considered to be risk free; however, the remaining three types of loading (planned overloading, long term emergency, and short term emergency) have associated with them some indeterminate level of risk. Specifically, the level of risk is based on the quantity of free gas, moisture content of oil and insulation, and voltage.
The presence of free gas as discussed in annex A may cause dielectric failure during an overvoltage condition and possibly at rated power frequency voltage. The temperatures shown in table 8 for each type of loading are believed to result in an acceptable degree of risk for the special circumstances that require loading beyond nameplate rating. A scientific basis for the user's evaluation of the degree of risk is not available at this time. Current research in the area of model testing has not established sufficient quantitative data relationships between conductor temperature, length of time at that temperature, and reduction in winding dielectric strength. Additionally, there are other important factors that may affect any reduction, such as moisture content of the winding insulation and rate of rise of conductor temperature.”
94Nobuo Takasu, et al, “An experimental analysis of DC excitation of transformers by geo magnetically induced currents,” IEEE Transactions on Power Delivery, vol. 9, no. 2, April 1994, p 1173 1182.
44 |
GMDTF Interim Report: Affects of Geomagnetic Disturbances on the Bulk Power System–February 2012 |

Chapter 5–Power Transformers
Placed in context of overheating caused by half cycle saturation, it is only possible to say that if the winding and other metallic part, hot spot temperatures remain below 180 degrees Celsius and 200 degrees Celsius, respectively, during the short term emergency loading timeframe of 15 minutes, it would result in an acceptable degree of risk. Exceeding these suggested temperatures would result in additional, but indeterminate risk. The magnitude, frequency, and duration of GIC flows, as well as the geology and transformer design are key considerations in determining the amount of heating that develops in the windings and structural parts of a transformer and the potential for insulation damage.
With the current state of knowledge, the best vulnerability assessment option is to use transformer thermal models to determine the appropriate risk free temperatures that specific transformers may reach when subjected to GIC. Thermal models can take many forms, such as the detailed finite element method (FEM) models used by manufacturers or the transfer function models presented in Simulation of Transformer Hot Spot Heating due to Geomagnetically Induced Currents.95
If the short term emergency temperatures suggested in IEEE C57.91 1995 are exceeded, a transformer can be flagged as being exposed to a higher degree of risk and deserving of a closer look in the context of its condition (e.g., age, moisture, dissolved gasses). Whether a given transformer can be expected to see such temperatures during a severe GMD event can only be estimated when all relevant factors are considered:
Local ground resistivity and network configuration.
Loading and availability of reactive support.
Voltage and loading limits.
Such factors can be estimated using the modeling and simulation considerations discussed in Chapters 8 and 9.
GIC reduction devices, system reconfiguration or other mitigation measures could be deployed in transformers flagged as potentially vulnerable. As discussed in Chapter 11, GIC flow reduction devices also require careful studies, notwithstanding cost, performance and maturity considerations as with any given technology.
5.6 Conclusion
This chapter describes the parameters that would need to be considered by entities to prepare an informed assessment of the effects of GIC flows on each power transformer within their system. The magnitude, frequency, and duration of GIC, as well as the geology and transformer design are key considerations in determining the amount of heating that will develop in the windings and structural parts of a transformer. The effect of this heating on the condition, performance, and insulation life of the transformer is also a function of a transformer’s design
95L. Marti, A. Rezaei Zare, A. Narang, “Simulation of Transformer Hot Spot Heating due to Geomagnetically Induced Currents,” submission to IEEE Transactions on Power Delivery.
Effects of Geomagnetic Disturbances on the Bulk Power System–February 2012 |
45 |

Chapter 5–Power Transformers
and operational loading during a GMD event. Further, GIC measurement data shows that the change in the magnetic field (dB/dt) and corresponding GIC values vary considerably throughout the duration of a given geomagnetic storm; thus, impacts to the system and power transformers in particular, are time dependent. This chapter also reviews past transformer failures from strong GMD events and illustrates that some older transformer designs and those that have high water content and high dissolved gasses or nearing their dielectric end of life are more at risk to experiencing increased heating and VAr consumption, than newer designs.
NERC recognizes that other studies have indicated a severe GMD event would result in the failure of a large number of EHV transformers. Based on the results of this chapter, the most likely worst case system impacts from a severe GMD event and corresponding GIC flow is voltage instability caused by a significant loss of reactive power support and simultaneous to a dramatic increase in reactive power demand. Loss of reactive power support can be caused by the unavailability of shunt compensation devices (e.g., shunt capacitor banks, SVCs) due to harmonic distortions generated by transformer half cycle saturation. Noteworthy is that the lack of sufficient reactive power support, and unexpected relay operation removing shunt compensation devices was a primary contributor to the 1989 Hydro Québec GMD induced blackout.
NERC has identified a number of recommendations in Chapter 13 to better understand and address the issues identified within this Chapter. NERC intends to pursue additional detailed analyses and assessments to provide results that are open and transparent, and would enable the industry, transformer manufacturers, government agencies, and policy makers to validate the findings.
5.7 References
[1]J. Wrubel, “Monitoring for Geomagnetic Induced Current Flow Effects Using Existing EMS Telemetering,” Conference Proceedings of Power Industry Computer Application Conference, 1991, pp. 44 49.
[2]R. S. Girgis, R. J. Nevins, “Analysis of Observed Geomagnetically Induced Current Effects on Transformers,” Proceedings of EPRI Geomagnetically Induced Current Conference, June 1992, TR 100450.
[3]CIGRE Study Committee 12, “Effects of Geomagnetically Induced Currents on Power Transformers,” Electra, no. 141, April 1992.
[4]Ramsis Girgis and Chung Duck K.O., “Calculation Techniques and Results of Effects of GIC Currents as Applied to Two Large Power Transformers,” IEEE Transactions on Power Delivery, vol. 7, no. 2, April 1992, pp. 699 705.
[5]J. G. Kappenman, V.D. Albertson, “Bracing for the Geomagnetic Storms,” IEEE Spectrum, vol. 27, issue 3, 1990, pp. 27 33.
[6]NERC March 13, 1989 Disturbance Report.
[7]Leonard L. Grigsby, Electric Power Engineering Handbook, 2nd Edition, CRC Press, 2007.
46 |
GMDTF Interim Report: Affects of Geomagnetic Disturbances on the Bulk Power System–February 2012 |

Chapter 5–Power Transformers
[8]C. T. Gaunt, G. Coetzee, “Transformer Failures in Regions Incorrectly Considered to Have Low GIC Risk,” IEEE Power Tech 2007, Lausanne, pp. 807 812.
[9]T. H. Breckenridge, T. Cumming, J. Merron, “Geomagnetically Induced Current Detection and Monitoring,” Developments in Power System Protection Conference, Publication No. 479 IEE 2001.
[10]A. Erinmez, J. G. Kappenman, W. A. Radasky: Management of the geomagnetically induced current risks on the National Grid Company’s electric power transmission system,” Journal of Atmospheric and Solar Terrestrial Physics, 64, 2002, p 743 756.
[11]Transpower New Zealand, System Operators Report, June 2011.
[12]P. Picher, L. Bolduc et al., “Study of the acceptable DC current limit in core form power transformers,” IEEE Transactions on Power Delivery, vol. 12, no. 1, January 1997, page 257 265.
[13]Matti Lahtinen and Jarmo Elovaara, “GIC Occurrences and GIC Test for 400 kV System Transformer,” IEEE Transactions on Power Delivery, vol. 17, no. 2, April 2002, page 555 561.
[14]Nobuo Takasu, et al, “An experimental analysis of DC excitation of transformers by geo magnetically induced currents,” IEEE Transactions on Power Delivery, vol. 9, no. 2, April 1994, p 1173 1182.
[15]R. A. Walling, A. H. Khan, “Characteristics of Transformer Exciting Current During Geomagnetic Disturbances,” IEEE Transactions on Power Delivery, vol. 6, no. 4, October 1991.
[16]X. Dong, Y. Liu, J. G. Kappenman, “Comparative Analysis of Exciting Current Harmonics and Reactive Power Consumption from GIC Saturation Transformers,” IEEE Power Engineering Society Meeting, 2001, pp. 318 322.
[17]R. Girgis, K. Vedante, “Effects of GIC on Power Transformers and Power Systems”, To be presented at IEEE T&D Conference May 2012
[18]P. R. Price, Geomagnetically Induced Current Effects on Transformers,” IEEE Transactions on Power Delivery, vol. 17, no. 4, October 2002.
[19]L. Marti, A. Rezaei Zare, A. Narang, “Simulation of Transformer Hot Spot Heating due to Geomagnetically Induced Currents,” submission to IEEE Transactions on Power Delivery.
[20]Metatech Corporation for Oak Ridge National Laboratory, “Geomagnetic Storms and Their Impacts on the U.S. Power Grid,” Meta R 319, January 2010, http://www.ornl.gov/sci/ees/etsd/pes/pubs/ferc_Meta R 319.pdf
Effects of Geomagnetic Disturbances on the Bulk Power System–February 2012 |
47 |

Chapter 6–Protection and Control
6.Protection and Control
6.1 Introduction
During a GMD event, protection and control devices may experience elevated harmonic content and increased risk of current transformer (CT) saturation. Incorrect operation of protection and control devices can lead to unintended isolation of equipment at times when the equipment provides critical support to the system. Isolating components, such as transmission lines, transformers, capacitor banks and SVCs due to a GMD event may reduce margins further, moving the system closer to collapse.
The operation of protection and control devices must be assessed to ensure proper operation during a GMD event. Reviewing protection and control devices requires careful understanding of how the devices operate and the role they play in the operating scheme.
6.2 Relay Technology
A wide variety of relay types and vintages are in service today with assorted operating principles and technologies used to perform their functions. Relay technology has advanced dramatically in the past 25 30 years, but improved relatively slowly in the years prior. Early vintage relays are electromechanical, designed in most cases for a singular function. As technology advanced, solid state electronic relays became an alternative to electromechanical relays. These relays can consolidate several functions and provide protection via electronic circuitry. In the mid 1980s, microprocessor based relays were introduced that continue to be used today. Electromechanical relays are more susceptible to GIC induced misoperation than microprocessor based relays, as the electromechanical relays generally lack the ability to filter extraneous signals resulting from distorted wavefronts caused by harmonics. Both relay types are susceptible to CT saturation, but the electromechanical relays are more susceptible to GIC tripping.
Today’s microprocessor relay is actually a computer running complex algorithms to sample, filter and operate on the signals provided from the instrument transformers. The filtering and operational methods employed vary depending on the function provided and the techniques implemented by the particular manufacturers. Each relay often provides many protection and control elements in a single unit and may employ more than one method for filtering and operating.
When assessing protection and control for susceptibility to GIC influence, it is critical to understand relay operating principles. Electromechanical relays lack the filtering ability available in modern relays and need to be reviewed carefully. Given the limited amount of information available on some of the older designs, testing may be required to determine how the relay will operate under the anticipated conditions. In some applications, it may be advantageous to consider replacing the electromechanical relay with a microprocessor relay capable of filtering fundamental harmonics, and rejecting quasi DC GIC signals properly to avoid potential undesired operation.
48 |
GMDTF Interim Report: Affects of Geomagnetic Disturbances on the Bulk Power System–February 2012 |