

Geomagnetic_Disturbance_Task_Force_2012
.pdfChapter 2–Monitoring and Predicting Space Weather
2.2 Forecasting a Space Weather Storm
Both North American space weather centers gather the available data in real time that describes the state of the sun, heliosphere, magnetosphere, and ionosphere to form a picture of the environment between the sun and Earth. With this information, forecasts, watches, warnings, and alerts are prepared and issued to those impacted by space weather. Scientists and technicians use a variety of ground and space based sensors and imaging systems to view activity at various depths in the solar atmosphere. The SWPC and CSWFC have both partnered with the International Space Environment Services (ISES) to coordinate the exchange of solar terrestrial data between organizations around the world. Regional Warning Centers35 (RWCs) within the ISES structure are responsible for collecting magnetometer data from their geographical areas and exchanging data throughout the global ISES network.
A number of satellite assets are employed to provide timely space weather information, including the Solar Terrestrial Relations Observatory (STEREO), the Geostationary Operational Environmental Satellite (GOES), and the Polar Operational Environmental Satellite (POES) (see Figure 5). Early indications of initiating solar storm events are received between 14 to 96 hours before the effects are felt on Earth. The United States National Aeronautics and Space Administration (NASA) Advanced Composition Explorer (ACE) satellite36 is stationed at the Lagrangian L 1 Point,37 which is one million miles from Earth (see Figure 6). It provides indications of a solar storm’s potential intensity and polarity.
Figure 5: Location of NASA satellites between Earth and sun38
35At present, there are ten RWCs: Beijing (China), Boulder (USA), Moscow (Russia), Brussels (Belgium), New Delhi (India), Ottawa (Canada), Prague (Czech Republic), Tokyo (Japan), Sydney (Australia) and Warsaw (Poland).
36The NASA Advanced Composition Explorer Satellite http://www.srl.caltech.edu/ACE/
37Lagrange points are locations in space where gravitational forces and the orbital motion of a body balance each other. There are five Lagrangian points in the Sun Earth system, and such points also exist in the Earth Moon system (see Figure 6). http://www.esa.int/esaSC/SEMM17XJD1E_index_0.html
38NASA Goddard Space Flight Center: http://stereo.gsfc.nasa.gov/img/sciencevisuals/preview/ST_orbit1.jpg
9 |
GMDTF Interim Report: Affects of Geomagnetic Disturbances on the Bulk Power System–February 2012 |

Chapter 2–Monitoring and Predicting Space Weather
These warnings can be received as short as 30 minutes before the onset of an impending geomagnetic storm.
Figure 6 Lagrange points between the sun and Earth
If forecasters conclude that a CME from the sun is Earth directed, and a significant geomagnetic storm is possible, NOAA issues a Geomagnetic Storm Watch. This notice usually provides a one to four day notice that a geomagnetic storm is expected. One to four days after the eruption on the sun, the CME impacts the sensors located on the ACE satellite at the L1 orbit. Forecasters at CSWFC and SWPC can then provide more accurate warnings up to 30 minutes in advance of the imminent onset of a geomagnetic storm. Forecasters then issue a Sudden Impulse Warning, which indicates that Earth’s magnetic field will soon be distorted by the incoming geomagnetic disturbance. Forecasters may also issue a projected geomagnetic K index warning (K4 though K7), depending on the forecast strength of the geomagnetic storm. These are followed immediately by the appropriate enhanced Geomagnetic K index Alert (K4 to K9) as thresholds are crossed. Alerts and warnings are issued as warranted for the duration of the storm.
2.3 Explanation of Watches, Warnings, and Alerts
Geomagnetic storm watches, warnings, and alerts released by the SWPC and NRCan. CSWFC also includes references to space weather intensity scales. The following table defines geomagnetic activity in terms of A and K indexes (see Table 1).39
39The A index refers to the 24 hour A Index observed at a mid latitude observatory such as Fredericksburg, Virginia, not the planetary A Index (Ap) based on data from a set of specific stations. The K Indices are, likewise, mid latitude values.
GMDTF Interim Report: Affects of Geomagnetic Disturbances on the Bulk Power System–February 2012 |
10 |

Chapter 2–Monitoring and Predicting Space Weather
|
Table 1: NOAA SWPC indices |
|
|
|
|
Solar Activity |
A Index Level |
K Index Level |
|
|
|
|
|
|
Quiet |
A Index <7, |
Usually no K indices >2 |
|
|
|
|
|
|
Unsettled |
7 < A Index < 15, |
Usually no K indices > 3 |
|
|
|
Active |
15 < A Index < 30, |
A few K indices of 4 |
|
|
|
|
|
|
Minor Geomagnetic Storm |
30 < A Index < 50, |
K indices mostly 4 and 5 |
|
|
|
Major Geomagnetic Storm |
50 < A Index <100 |
K indices mostly 5 and 6 |
|
|
|
|
|
|
Severe Geomagnetic Storm |
A Index>100 |
K indices 7 or greater |
The Kp index scale40 summarizes the global level of geomagnetic activity, though it is not always understandable for those affected by the space environment.41 The NOAA G scale was designed to correspond to the significance of effects of geomagnetic storms. SWPC uses estimates of the planetary average Kp index to determine geomagnetic storm (space weather scale) level (see Table 2).
|
Table 2: NOAA space weather storm levels |
|
|
|
|
Kp Index |
|
NOAA Space Weather Scale Geomagnetic Storm Levels |
|
|
|
|
|
|
Kp=5 |
|
G1 (Minor) |
|
|
|
Kp=6 |
|
G2 (Moderate) |
|
|
|
Kp=7 |
|
G3 (Strong) |
|
|
|
Kp=8 |
|
G4 (Severe) |
|
|
|
Kp=9 |
|
G5 (Extreme) |
|
|
|
Kp index levels of zero to four are below geomagnetic storm levels and considered to be a G0 event.42
Solar flare radio blackout alerts are issued when a large solar flare is observed on the sun. Within minutes, radiation storm warnings are issued if forecasters conclude that the eruption on the sun has resulted in accelerated solar protons toward Earth. Radiation storm alerts are issued when the solar protons measured on the NOAA Geostationary Satellite exceed alert thresholds.
40Background on the NOAA K Index can be found here: http://www.swpc.noaa.gov/info/Kindex.html
41The official planetary Kp index is derived by calculating a weighted average of K indices from a network of geomagnetic observatories.
42The complete NOAA Space Weather Scales can be found at: http://www.spaceweather.gov/NOAAscales/
11 |
GMDTF Interim Report: Affects of Geomagnetic Disturbances on the Bulk Power System–February 2012 |
Chapter 2–Monitoring and Predicting Space Weather
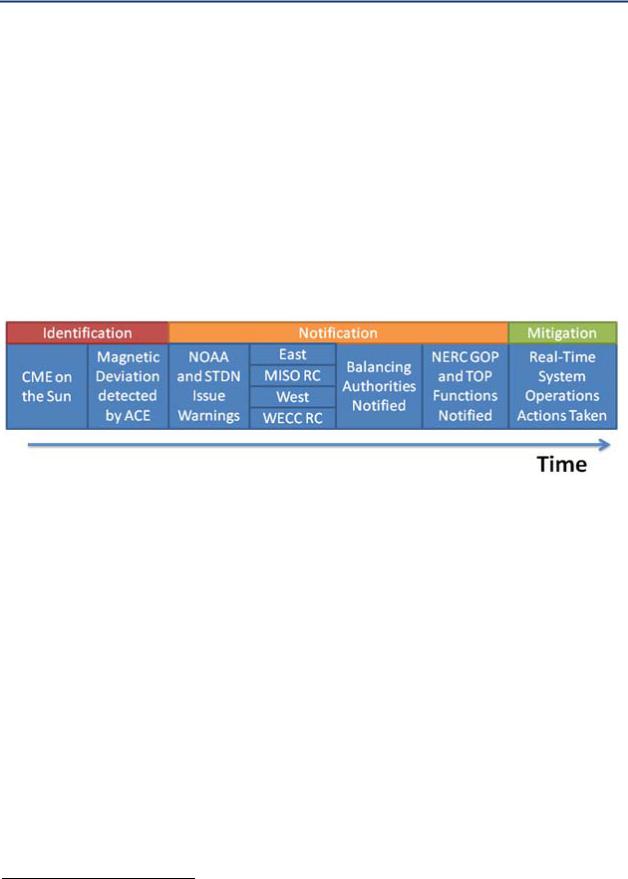
2.4 Space Weather Notification Process
In the United States, information from SWPC is made available to Midwest ISO (MISO), located in St. Paul, Minnesota, which is designated to receive and disseminate notifications of possible GMD to Reliability Coordinators, Balancing Authorities, and Transmission Operators in the Eastern and Electric Reliability Council of Texas (ERCOT) Interconnections. In the Western Interconnection, information from SWPC is also made available to the Western Electric Coordinating Council’s (WECC’s) Reliability Coordinators in Vancouver, Washington, and Loveland, Colorado, which are designated to disseminate notifications to other operating entities. SWPC monitors the preliminary values of the K index in real time and notifies the New York Independent System Operator (NYISO), WECC Reliability Coordinators, and MISO when the critical thresholds of 6, 7, and 8 are exceeded. Table 3 below provides a brief demonstration of this process.
Table 3: NOAA space weather notification process
Together, the three interconnections (Eastern, Western and ERCOT) cover all systems in the United States and Canada, except the Québec Interconnection. The latter receives notifications of possible GMD from the Solar Terrestrial Dispatch Center (STDC),43 which is a private company that specializes in space weather forecasting in Canada. The SWPC and the Geological Survey of Canada serve as the backup to the STDC.
2.6 Advances in Space Weather Forecasting
The understanding of extreme space weather events and the physics of solar terrestrial phenomena has substantially improved over the past decade. The emergence of new forecasting capability is vital to improving early warning and understanding of potential GMD effects, and is based on 1) the state of the art information currently available via in situ interplanetary and remote solar observations, and 2) physics based large scale simulations of the space environment. More specifically, ACE, STEREO A and B, Solar and Heliospheric Observatory (SOHO, which is joint NASA European Space Agency44 mission) and Solar Dynamics Observatory (SDO) missions provide the data feeds needed to drive models for solar corona, interplanetary medium, and magnetosphere ionosphere systems developed by the international space science research community.
43Solar Terrestrial Dispatch: http://www.spacew.com/
44 European Space Agency: http://www.esa.int
GMDTF Interim Report: Affects of Geomagnetic Disturbances on the Bulk Power System–February 2012 |
12 |

Chapter 2–Monitoring and Predicting Space Weather
The new forecasting capability enables a great variety of space weather information not available via any traditional space weather information sources. Importantly, numerical forecasting of the near space environment conditions can be used to tailor information specifically to industry needs. The new forecasts are able not only to characterize the general level of global geomagnetic activity, but also to provide information about the local geoelectric field induced on the surface of Earth and to predict actual GIC flows through individual nodes of the transmission system.
The new forecasting capacity is demonstrated by the Solar Shield system residing at the NASA Goddard Space Flight Center (Pulkkinen et al., 2009).45 The Solar Shield project was launched to design and establish a forecasting system that can be used to mitigate the adverse impacts of GIC flows on the North American bulk power system. The forecasting system uses a two level approach that provides two different forecast lead times needed to meet the identified system requirements. The two different lead times are obtained by using extensive heliospheric and magnetospheric magnetohydrodynamic (MHD) simulations driven by remote solar and in situ solar wind observations, respectively.
The Solar Shield46 system has been running in real time since February 2008 and further development of the system is underway. Continued collaboration with industry is important to maximize the future applications of the system. Development of current GIC prediction models is dependent on data from GIC monitoring sites. One of the central goals is to provide Solar Shield coverage for any interested collaborator. Solar Shield output is being integrated into the European space weather infrastructure via collaboration under European Union Framework Program 7 project European Risk from Geomagnetically Induced Currents (EURISGIC).47
Figure 7: Process used to generate short lead time NASA Solar Shield GIC forecasts
45The system is a collaborative activity between the NASA GSFC and the Electric Power Research Institute (EPRI).
46More details and a collection of Solar Shield documentation can be found at http://ccmc.gsfc.nasa.gov/Solar_Shield/Solar_Shield.html. See attachment 2 for more information on the future of space
weather forecasting.
47European Risk from Geomagnetically Induced Currents Project http://www.eurisgic.eu
13 |
GMDTF Interim Report: Affects of Geomagnetic Disturbances on the Bulk Power System–February 2012 |

Chapter 3–Existing Response Capability
3.Existing Response Capability
3.1 Introduction
To help stakeholders address GMD risks and vulnerabilities, NERC issued an alert in the form of an advisory in May 2011.48 This advisory outlined action that the industry should consider using given each stakeholders system topology, location, ground resistivity, equipment susceptibility to GIC flows, and experience with past GMD events.
The actions are divided into three categories: 1) operations planning actions, 2) real time operations actions, and 3) long term stakeholder actions. The operations planning actions are intended for the time period after SWPC or STDC predicts a severe GMD event (K>6), but before a severe GMD warning is issued. The real time operations actions are intended for the time period after receiving a severe GMD warning (K>6, about 30 60 minutes before storm impact), but before detection of increased GIC levels. The long term actions are intended to prepare for future occurrences of severe GMD. Attachment 3 contains the text of the alert, and Attachment 4 contains more information on current GMD response procedures.
3.2 Limitations of the Existing Response Capability
3.2.1 Enhancing Situational Awareness
Operating measures suggested in NERC’s GMD alert are based on system stability considerations, reactive consumption of transformers experiencing half cycle saturation, and the potential loss of reactive compensation due to harmonic overloading of reactive power devices at a time when reactive compensation needs are high. These measures are based on minimal operator visibility of the location and magnitude of GIC, which can only be achieved by simulation of GIC flows on the network and extensive monitoring during an event. These simulations require an understanding of equipment vulnerability, as well as a clear picture of legitimate equipment tripping due to harmonics injected by transformer saturation. However, extensive simulation capabilities and monitoring are not widely available and the existing operating procedures may not be sufficient to successfully respond to all GMD events. NERC recommends development of operational planning and operator tools to enhance situational awareness of the impacts of GMD.
3.2.2 Categorizing Assets to Aid Mitigation
In the absence of GIC visibility (monitoring) or extensive contingency simulations, it is still possible to improve safe posture measures. Identifying the general vulnerability of a fleet of power transformers to core half cycle saturation and, in some cases, possible winding/structural parts heating due to GIC flows can be best determined by:
1)Determining the possible levels and duration of the GIC pulses to which transformers would be subjected.
2)Evaluating the general vulnerability of the transformers to core half cycle saturation, based on the voltage rating, core design, and age.
48NERC, “Industry Advisory, Preparing for Geo Magnetic Disturbances,” Initial Distribution: May 10, 2011, http://www.nerc.com/fileUploads/File/Events%20Analysis/A 2011 05 10 01_GMD_FINAL.pdf.
GMDTF Interim Report: Affects of Geomagnetic Disturbances on the Bulk Power System–February 2012 |
14 |

Chapter 3–Existing Response Capability
3)Performing appropriate magnetic and thermal calculations of detailed transformer designs identified as vulnerable to heating to determine the GIC withstand capability of these transformer designs, given magnitude and duration of the GIC versus loading.
4)Defining acceptable levels of risk tolerance for asset managers based on operating philosophy.
Once the above steps are taken, then:
Identify low priority assets: These system assets are unaffected by GIC flows because they are connected to high voltage backbone transmission with delta connections, and are single point grounded or ungrounded.
Identify medium priority assets: These system assets are somewhat vulnerable to half cycle core saturation by high levels of GIC (e.g., three phase, three leg, core type transformers).
Identify high priority assets: These system assets are most vulnerable to half cycle core saturation by lower levels of GIC (e.g., shell form transformers and core form transformers other than three phase transformers with three legged cores).
Additionally, using traditional power flow analysis, planners should complete simulations that anticipate the possibility of system operation where only low and medium priority assets are available. This might represent a possible end state of a severe GMD event, where generation and load rejection is used to prevent system collapse. For more moderate GMD events, planners should identify contingencies where the tripping of capacitor banks and SVCs can result in high priority assets being taken off line. In most cases, capacitor banks and SVCs will trip before a high priority transformer is stressed by GIC effects. Once the studies are complete, planning for operational procedures and equipment mitigation should be considered based on the potential risk to reliability for an individual organization and expected outcomes.
More on this approach is provided in the following chapters of this assessment.
15 |
GMDTF Interim Report: Affects of Geomagnetic Disturbances on the Bulk Power System–February 2012 |

Chapter 4–GMD Credible Threat Definition
4.Credible Threat Concept and GIC Calculation
4.1 Introduction
To assess the geomagnetic effects on power systems and associated equipment requires knowledge about the magnitudes and duration of GIC pulses. The potential impacts of GIC on power transformers, as well as protection and control systems, are addressed in Chapters 5 and 6, respectively. The purpose of this chapter is to show how GIC magnitudes can be calculated and amplitudes that can be expected at different latitudes. In particular, this section considers the “one in 100 year” storm scenario as a potential design criterion for the power system.
4.2 Definition of Design Basis Credible Threat
To reasonably set expectations for the industry to establish its response plan, a definition of a credible threat is needed that can be used as a guide for development of multiple classes of mitigation actions. Therefore, the following definition is designed to provide transmission system planners, engineers, and operators with an approach to address the space weather threat that is consistent with current design practices, facility ratings methods, and NERC Reliability Standards.
The design basis credible threat (DBCT) for GMD events can be characterized as the magnitudes and corresponding durations of GIC pulses sustained over a period of time that have historical and geographical significance for a region or operating entity, and are substantiated by data measurement and/or engineering models. The DBCT shall be identified by asset owners and operators for their specific regions, and be used as the minimum system design requirement for equipment specifications, hardening, and system resilience for the respective region/entity. Asset owners and operators shall establish methods for their respective regions in the determination of their DBCT. As part of the overall response plan for GMD, use of a DBCT as a basis for system hardening constitutes a first level of defense for higher rates of expected GMD events. This first level of defense will be complemented by operating procedures or postures for more extreme levels of GMD.
This definition leaves the determination of the design basis GIC levels to the asset owners. Once simulation tools and operational tools are available, owners should be able to assess levels of GIC expected on their equipment and the relative risk to system reliability and specific equipment based on latitude and equipment fleet. This approach is consistent with current asset owner responsibilities for system modeling, facility ratings, and the maintenance documentation on methods and calculations.
GMDTF Interim Report: Affects of Geomagnetic Disturbances on the Bulk Power System–February 2012 |
16 |

Chapter 4–GMD Credible Threat Definition
4.3 Determination of GIC
The process of determining the geomagnetic effects on a power system can be divided into three parts:
Determining the occurrence of geomagnetic activity.
Calculating the electric fields experienced by the power system.
Modeling the GIC produced.
The characteristics of geomagnetic disturbances can be measured by a number of activity indices that measure magnetic field variations. A statistical analysis of the index values can then be used to show the occurrence of different levels of activity. Calculating electric fields requires knowledge of Earth’s conductivity structure, which is used to calculate the response in each area of the power system. Magnetic field values are used as input to Earth’s response to calculate expected electric fields.
As an alternative, geomagnetic data can be used to calculate electric fields and a statistical analysis can be completed on the electric fields themselves as a way to determine the expected GIC values based on GMD directionality and intensity. The electric field values can be used as input to a DC resistance model of the power system to calculate the GIC flows throughout the bulk power system. Measurements of geomagnetic field variations have been collected for more than 150 years. For most of that time, recordings were analog (photographic), only in the past 30 years has digital data been available. To provide a measure of different aspects of the magnetic activity, a number of magnetic indices were developed. They provide the longest record of magnetic activity (i.e., from 1932 for Kp index, and from 1868 for ap index).
4.3.1 Predicting GIC for Use in Modeling Power System Response
Although magnetic indices are used in a variety of applications, they were originally designed for scientific applications. Thus, they are often not suited to this specific application. However, the indices continue to be used because they provide an important historical perspective, and better alternatives do not exist.
Kp is probably the most widely used magnetic index and the most misunderstood (see Figure 8). The scale was designed as a measure of the magnetic activity around the world – hence the suffix “p” for “planetary” –based on values measured at observatories around the world. However, the observatories are located at different latitudes so they experience different amplitude disturbances. To compensate, different scales are used at each observatory to correct values for latitude differences, so the contributing observatories can provide equivalent K values that can be combined for the global Kp index value. The disadvantage is the individual K values do not refer to the same magnitude of local magnetic disturbance.
The “ap” index is a linear equivalent of Kp. This conversion is based on the mid scale values developed by the Neimegk observatory in Germany49, but with ap expressed in units of 2 nano
49 Niemegk observatory contains the Adolf Schmidt Observatory for Geomagnetism. Available at: http://www app3.gfz potsdam.de/obs/niemegk/en/index.html
17 |
GMDTF Interim Report: Affects of Geomagnetic Disturbances on the Bulk Power System–February 2012 |

Chapter 4–GMD Credible Threat Definition
Teslas (nT). Because they are based on a linear scale, the eight daily ap values can be averaged to calculate a daily value for magnetic activity, which is designated “ap.”
Figure 8: Occurrence of Kp values from 1932 to 1991.
In 1972, PN Mayaud 50compared the ranges of measurements from two magnetic observatories –in the United Kingdom and Australia – and combined to produce the “aa index” of magnetic activity back to 1868. This measure uses a linear scale like ap, but aa has units of 1nT, so it is easier to convert to the size of the actual magnetic field variations. The aa values are produced for three hour intervals (like Kp and ap), but they are derived from only two stations that might not be well placed to record every short term magnetic field variation. For this reason, the daily averages of the aa values, designated as “AA,” are not recommended for use.
The Dst index is designed to measure the amplitude of the main phase disturbance (D) of a magnetic storm (st). To avoid contamination from the auroral zone magnetic activity, the Dst index is derived from the magnetic field variations recorded at four low latitude observatories. These are combined to provide a measure of the average main phase magnetic storm amplitude around the world. Dst should not be used for geomagnetic hazard assessments. Substorm activity occurs at the same time as the magnetic storm main phase, but Dst is not a good proxy for the size of substorm activity, which is better measured using the Kp, ap or aa indices.
4.3.2 Geomagnetic Data
Modern magnetic measurements are made with three component fluxgate magnetometers. These measure the X, Y, Z or H, D, Z components of the magnetic field. The X, Y, Z measurements correspond to the northward, eastward, and vertical (downward) components of the magnetic field in a geographic coordinate system. Some instruments are aligned in the geomagnetic coordinate system and measure the field directed to magnetic north (H), directed
50 Mayaud, P.N. 1972, The aa indices: a 100 year series characterizing the magnetic activity. J. Geoph. Res., 77, 6870 6874.
GMDTF Interim Report: Affects of Geomagnetic Disturbances on the Bulk Power System–February 2012 |
18 |