

Учебное пособие 800637
.pdf544.6
|
|
. |
. |
|
, . . |
1 |
|
|
|
|
|
|
|
|
|
|
|
|
. |
|
|
|
|
|
|
|
- |
, |
|
|
, shalimov_yn@mail.ru |
|
|
||
« |
|
|
|
|
|
|
» |
|
– |
|
|
|
. |
|
, |
|
- |
|
|
|
|
|
|
|
- |
|
|
|
|
|
|
|
|
|
|
|
|
|
|
|
|
. |
, |
- |
|
|
|
|
|
|
, |
. |
|
: |
|
|
, |
|
|
, |
|
. |
. . |
, |
|
|
|
|
|
|
. |
|
|
- |
|
|
|
|
|
|
|
. |
|
|
, |
|
. . |
|
. |
|
|
|
|
|
|
|
||
|
|
|
|
|
|
|
|
- |
|
|
|
|
|
|
. . |
|
. |
V |
|
|
|
|
|
|
|
|
. . |
, |
|
|
|
|
|
|
[1-3]. |
|
|
|
|
|
|
. |
- |
|
|
|
|
|
|
|
|
||
). |
|
|
|
( |
|
|
|
|
|
|
|
|
|
|
|
|
|
, |
|
|
|
|
|
, |
|
. |
|
|
|
|
|
|
, |
|
|
|
|
|
|
. |
, |
|
|
|
, |
|
|
|
|
|
|
|
, |
|
|
|
|
|
|
|
|
|
« |
|
|
» |
. |
|
|
|
|
|
|
|
|
|
|
|
||
. |
|
( |
) |
) |
, ) |
, ) |
: |
|
20

,
, |
|
|
, |
|
i |
|
2T |
|
|
|
|
|
|
||
(1) |
|
||
( |
|
, |
|
-
.
. |
, |
, |
- |
|
|
|
, |
|
|
. |
- |
|
|
. |
- |
|
|
- |
|
|
|
|
.
|
|
i |
|
|
i |
w |
|
w |
y |
|
|
|
|
||||
|
x |
x |
|
y |
|
|
|
|
|
||
|
i |
|
1 |
|
|
|
|
w |
|
|
|
|
div |
j i |
(1) |
|
|
||||||
z |
|
|
|
|
|
k k |
|
|
z |
|
|
k |
- |
||
|
|
|
|
|
|
|
|
|
, |
|
|
|
|
). |
|
|
|
|
|
|
- |
||
|
|
|
|
|
|
|
|
|
|
|
|
|
|
|
- |
|
|
|
|
- |
|
|
|
|
|
, |
|
|
|
. |
|
|
- |
|
|
, |
|
|
|
|
|
|
|
|
|
|
|
|
|
|
|
|
. |
|
|
|
|
|
|
|
|
|
|
|
|
|
|
|
|
|
|
|
1. |
|
|
. ., |
|
|
. ., |
|
. . |
|
|
|
- |
2000. 343 . |
|
|
|
|
|
|
|
|
|
. - |
: |
, |
|
|
|
|
|
|
|
|
|
|
|
|
|
2. |
|
|
. . |
|
|
|
|
. 2- |
., |
. |
. .: |
- |
, 1974. 351 . |
|
|
|
|
|
|
|
|
|
|
||
3. |
|
, |
. |
|
|
|
. .: |
, 1977. 463 . |
|
|
||
537.9 |
|
|
|
|
|
|
|
|
|
|
|
|
|
|
|
|
|
|
, |
|
|
|
|
|
|
|
|
. . |
1, . . |
|
2, |
. . |
3, . . |
|
4 |
|
|
|
|
|
1 |
- |
.- |
. |
, |
, vladimir.shur@urfu.ru |
|
|
|||
2 |
. |
.- |
. |
, |
|
|
|
, andrey.akhmatkhanov@urfu.ru |
|
|||
|
|
|
|
|
||||||||
|
|
|
|
3 |
|
, Alexander.Esin@urfu.ru |
|
|
|
|
||
|
|
|
|
|
|
|
|
|
|
|
|
|
|
|
4 |
|
|
|
|
, m.a.chuvakova@urfu.ru |
|
|
|||
|
|
|
|
|
|
|
|
|
||||
|
|
« |
|
|
|
|
|
. . |
|
», |
|
|
|
|
|
|
|
|
|
|
|
|
|
|
- |
|
|
|
|
|
. |
|
|
|
|
|
|
- |
, |
|
|
|
|
|
|
|
|
|
|
. |
- |
, |
|
|
|
|
|
|
|
|
|
|
|
|
. |
|
|
: |
|
, |
, |
|
|
, |
|
, |
- |
. |
|
|
|
|
|
|
||||||
|
|
|
|
|
|
|
|
|
|
|
|
|
-
LiNbO3 (CLN)
21
|
|
. |
|
|
|
, |
: |
- |
- |
|
, |
– |
|
|
|
(confocal Raman microscopy) |
|
||
(Cherenkov-type second harmonic generation). |
|
|
||
, |
|
CLN |
|
- |
[1,2]. |
|
|
|
- |
|
, |
|
|
- |
[3]. |
|
|
(dendrite envelope) |
|
. |
|
|
|
( |
) |
|
[4]. |
|
|
|
|
|
||
, |
|
. |
|
|
( |
|
) |
- |
|
|
|
|||
[4]. |
, |
|
|
|
200 C |
. |
|
|
- |
|
|
|
||
, |
CLN, |
|
|
- |
, |
|
|
|
|
. |
[5]. |
|
|
|
|
|
|
|
|
|
, |
|
, |
- |
|
, |
. |
|
|
[6]. |
|
Wulff plot |
|
|
|
|
200 C |
|
|
|
|
|
|
|
, |
|
|
. |
- |
. |
|
№ 19-12-00210. |
|
- |
|
|
|
||
« |
|
» |
|
|
. |
|
|
|
|
1.Shur V.Ya. Formation of dendrite domain structures in stoichiometric lithium niobate at
elevated temperatures / V.Ya. Shur, D.S. Chezganov, M.S. Nebogatikov, I.S. Baturin, M.M. Neradovskiy // J. Appl. Phys. – 2012 . - V. 112. - P. 104113.
2.Shur V.Ya. Formation of snowflake domains during fast cooling of lithium tantalate crystals
/V.Ya. Shur, M.S. Kosobokov, E.A. Mingaliev, D.K. Kuznetsov, P.S. Zelenovskiy // J. Appl. Phys. - 2016. - V. 119. - P. 144101.
3.Shur V.Ya. Domain shape instabilities and dendrite domain growth in uniaxial ferroelectrics
/V.Ya. Shur, A.R. Akhmatkhanov // Phil. Trans. R. Soc. A. – 2018. - V. 376. - P. 20170204.
4.Shur V.Ya. Kinetics of ferroelectric domains: application of general approach to LiNbO3 and LiTaO3 // J. Mater. Sci. - 2006. - V. 41. - P. 199-210.
5.Shur V.Ya. Shape evolution of isolated micro-domains in lithium niobate / V.Ya. Shur, A.I. Lobov, A.G. Shur, E.L. Rumyantsev, K. Gallo // Ferroelectrics. - 2007. - V. 360. - P. 111-119.
6.Esin A.A. Superfast domain wall motion in lithium niobate single crystals. Analogy with crystal growth / A.A. Esin, A.R. Akhmatkhanov, V.Ya. Shur // Appl. Phys. Lett. – 2019. - V. 114. - P. 192902.
22
541.127:541:128.21
|
|
. |
. |
|
1, |
. . |
|
2 |
|
|
|
1 - |
|
. |
, . . |
, anapon@ispm.ru |
|
|
|||
|
2 |
- |
. |
, |
. |
., shev@ispm.ru |
|
|
||
|
|
|
|
|||||||
|
|
|
|
|
|
|
|
. . . |
|
|
|
, |
|
|
|
|
|
|
, |
|
- |
|
|
|
|
|
|
. |
|
|
|
- |
|
. |
|
|
|
|
|
|
|
|
- |
|
|
|
|
, |
|
|
|
|
- |
|
|
- |
|
|
|
. |
|
|
|
||
|
: |
|
|
|
, |
|
, |
, |
- |
|
|
|
|
|
|
|
|||||
|
, |
|
|
|
, |
|
|
|
|
, |
|
. |
|
|
|
|
|
|
|
|
|
|
, |
|
|
|
100 |
3/ |
, |
, |
, |
|
|
|
|
|
|
|
|
||||
. . |
'' |
|
|
|
|
|
|
, |
|
- |
". |
|
|
, |
|
|
|
1926 |
. |
. |
- |
|
|
|
|
|
|
|
|
|
|
|
. . |
|
|
, |
|
|
|
[1]. |
|
|
- |
- |
|
" |
|
|
|
, |
|
|||
|
|
|
|
|
, |
|
|
|
|
|
|
|
|
". |
|
|
|
|
|
- |
|
|
|
|
|
|
|
|
|
|
||
|
|
|
|
|
|
|
|
, |
|
- |
|
. |
|
|
|
|
|
|
|
|
- |
|
|
|
|
|
|
|
|
|
- |
|
|
|
|
|
|
|
|
|
|
|
|
|
|
|
|
|
|
|
|
|
|
- |
, |
|
|
, |
|
|
|
|
|
|
- |
|
|
|
|
|
|
|
|
|
|
|
|
|
|
, |
|
|
|
|
|
|
|
[3]. |
|
|
|
|
|
|
|
|
, |
|
|
|
|
|
|
|
|
|
. |
- |
|
|
|
|
|
|
|
|
|
|
||
|
|
|
|
|
|
|
|
|
|
- |
|
|
|
|
|
|
|
|
. |
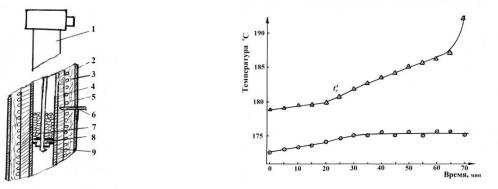
.1 |
- |
|
, |
|
|
, |
|
|
|
|
. |
- |
|
|
|
|
|
|
|
. |
|
||
|
|
|
(8) |
|
|
|
|
, |
|
|
|
|
|
|
. |
|
|
|
- |
||
|
|
|
|
|
50 |
. |
. 2 |
|
||
|
|
|
|
|
|
|
|
|||
|
. |
|
, |
|
|
|
|
|
|
- |
|
|
|
|
|
|
|
|
|
|
|
|
|
|
|
|
23 |
|
|
|
|
|
.
. 1. |
|
|
|
|
|
. 2. |
|
|
|
|
|
|
|
|
200 |
. 1 - |
, |
|
|
|
|
|
. |
|
|
; 2 - |
|
|
|
|
|
|
|||
3 - |
|
, 4 - |
|
, |
|
|
- |
|
, |
|
|
5- |
|
|
|
|
, |
|
- |
|
|
|
|
6 – |
|
|
, 8 - |
|
|
|
|
|
|
|
|
|
|
, 9 - |
|
|
|
|
|
|
|
|
|
|
|
|
|
|
|
.- |
., |
. |
. . |
, |
. . . |
. . |
, |
. . ., |
. |
. . |
|
, .- |
., . . . . . |
. . ., |
. |
||
. . |
|
60- |
|
|
|
|
|
|
|
- |
|
|
|
|
|
|
|
|
|
|
|||
|
|
|
|
|
, |
|
|
. . |
, |
. |
- |
|
|
|
|
|
|
|
|
|
|
||
1. . . |
|
, |
. . |
, . . |
|
, . . |
|
. |
|
- |
|
|
|
|
|
, 2015, |
.15, N5, c.23-45. |
|
– |
. |
|
- |
|
|
|
|
|
|
|
|
|
|
|||
2. . . |
- |
|
, |
|
|
|
|
|
, |
, |
|
., 1967, 491 . |
|
|
|
|
|
|
|
|
|
|
|
3. . . |
, . . |
|
, . . |
, . . |
|
. |
|
- |
|||
|
|
|
|
|
|
|
|
|
. |
|
- |
, 1964, |
.5, |
.5, |
. 920-926. |
|
|
|
|
|
|
|
|
UDC 543.42
HIGH-RESOLUTION MECHANICAL SPECTROSCOPY, HRMS:
RECENT PROGRESS AND NOVEL SOLUTIONS
Leszek B. Magalas
AGH University of Science and Technology, Faculty of Metals Engineering and Industrial Computer Science, Al. Mickiewicza 30, 30-059 Kraków, Poland
The high-resolution mechanical spectroscopy, HRMS, was developed in a time span from 2011 [1] to 2019 in Kraków, Poland. In this lecture we present the multi-scale high-
resolution characterization of dissipation of mechanical energy in solids for low-frequency mechanical spectroscopy. The high-resolution mechanical spectrometer is a very sensitive torsion pendulum characterized by an extremely low internal friction background, tan 2 10- 5, in the frequency range from 0.001 to 5 Hz. The sinusoidal external stress signal and the symbiotic strain response signal are acquired with a resolution of 24 bits at a sampling rate of around 10 kHz. The stress signal (harmonic or linear ramp) is generated by a 20-bit DAC. Stress and strain signals are subjected to simultaneous coherent sampling.
24
Progress in our ability to control and record low-noise stress and strain signals pave the way to high-resolution measurements of complex mechanical susceptibility: extremely small magnitudes of mechanical loss tangent, tan , high-resolution fine variations in shear modulus, and, thus, very low internal friction background. It should be emphasized that highquality stress and strain signals are subjected to on-line Signal Quality Test, which involves complementary and supplementary analysis of the signals in both the frequency and time domain. Experimental and computational tools exist to address both domains with high precision
such as interpolated discrete Fourier transform (IpDFT) and Hilbert transform, and computa- tion of ‘true envelope’ [2]. Thereby, the stress and strain signals can be analyzed at each step
of the experimental procedure: (1) simulations carried out on synthetic signals, (2) analysis of
the reference harmonic signal and (3) output signal from a bipolar amplifier, (4) strain signal acquired from a laser triangulation system, (5) signals’ deterioration caused by noise, (6) slow
drifts of the base line of strain signal (zero-point drift, ZPD), and (7) standard signal analysis. The performance of computational methods and algorithms is also optimized. Recent experimental results indicate that the mean background level in the high-resolution mechanical
spectrometer ranges from 1 to 2 10-5 in the frequency range from 10-3 to 5 Hz. Moreover, the dispersion of experimental points is negligible: from ±1 10-5 to ±2.5 10-5. It can be
safely concluded that the overall performance of the high-resolution mechanical spectrometer, HRMS, is more than one order of magnitude higher than current spectrometers (forced torsion pendula). As of writing this text, new high-resolution mechanical loss spectra are being measured; recent results are demonstrated, and new challenges and perspectives for the resonant and subresonant mode are advocated. Furthermore, stochastic nature of investigated material and imprecision in measurements are also tackled.
It is noteworthy that commercially available DMA analyzers suffer from high background (tan 5 10-3) and low resolution, which drastically limits practical applications of DMA instruments.
Devised novel IpDFT methods provide precise estimation of the logarithmic decrement, , and resonant frequency of exponentially damped sinusoidal signals embedded in additive white Gaussian noise and corrupted by time-dependent zero-point drift (ZPD). As anticipated, classical methods for determining the logarithmic decrement and frequency, for the same input data, yield incorrect results, and these inaccuracies are quantitatively assessed. In this context, we discuss the performance of the: (1) reference-resolution (RR) method designed for ZPD-free exponentially damped sinusoidal signals embedded in additive noise, and
(2) high-resolution (HR) method designed for exponentially damped sinusoidal signals embedded in additive noise and corrupted by ZPD is illustrated and discussed. Hitherto unattainably high-resolution estimations of the logarithmic decrement and resonant frequency are successfully obtained. The devised methods and algorithms can be used in a wide range of damping magnitudes, that is, for logarithmic decrement ranging from 1×10⁻⁹ to 0.5.
References
1.L.B. Magalas, Development of high-resolution mechanical spectroscopy, HRMS: status and perspectives. HRMS coupled with a laser dilatometer, Arch. Metall. Mater. 60, 2069-2076 (2015).
2.L.B. Magalas, M. Majewski, Hilbert-twin: A novel Hilbert transform-based method to compute envelope of free decaying oscillations embedded in noise, and the logarithmic decrement in highresolution mechanical spectroscopy HRMS, Arch. Metall. Mater. 60, 1092-1098 (2015).
25
I.
UD 539.612
KINETICS OF ORIENTATION AND ABSORPTION PROCESSES
IN POLYMER SYSTEMS ON SUBSTRATES
A.V. Maksimov1, O.G. Maksimova2 1Dr. Sci., Professor, a_v_maximov@mail.ru 2 Ph. D., Associate Professor, og62@mail.ru
Cherepovets State University
In this paper, the kinetic theory of orientation and absorption processes in flexible-chain polymer systems on solid substrates is depeloped in the mean field approximation. Kinetic equation for the order parameter was derived; its solution was obtained for two types of relaxation behavior during transitions to the state of chains completely torn off from the surface and the chains fully adsorbed on the substrate surface.
Keywords: mean field approximation, flexible-chain polymer systems, orientational order parameter, absorption, relaxation times, critical slowdown.
The investigation of physico-chemical properties of surface polymer structures: films, layers, membranes, etc. has not only theoretical, but also practical meaning associated with their unique characteristics important for use, for example, as protective coatings for sheet metal [1, 2]. The solution of the problem of adsorption of macromolecules is nessecary for constructing a theory of adhesion of polymers at interphase boundaries [2, 3].
For first order phase transitions of classical low-molecular systems, the description of both phases and the study of equilibrium and dynamic effects associated with the finite size of the system is a very difficult task [4]; it is achieved only by means of numerical calculations and computer simulation methods.
In this paper, the critical behavior and dynamics of the orientation and absorption processes of partially adsorbed polymer chains under the action of intermolecular orientational
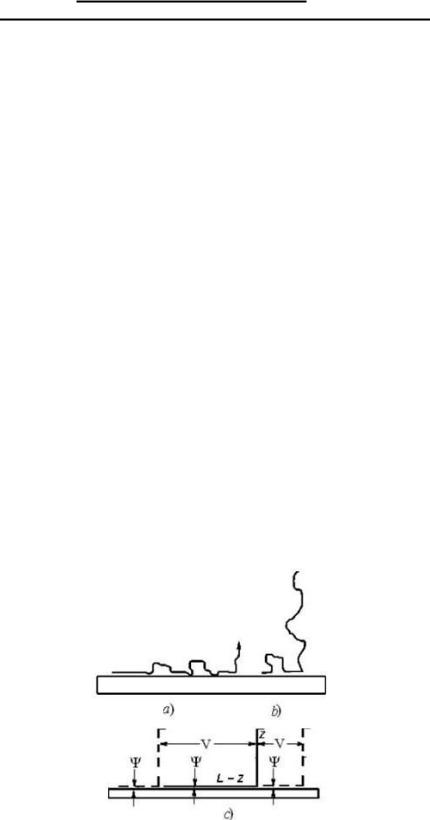
interactions with elongated sections of other chains were studied in the effective mean field approximation for the multichain version [5] of the “sticky tape” model [3].
Figure. The “sticky tape” model [3]: the schematic drawing of the polymer chain adsorbed on a plane
surface (a) and the chain nearly completely peeled-off from it (b) at small and great intermolecular interactions correspondingly. The multichain version [5] of the “sticky tape” model: an adsorbed
flexible macromolecule placed in mean field created by other chains (c). The energetic constants and V describe accordingly interactions with the surface and other chains
(they are shown by dashed lines)
26
It is shown that the system has a first-order phase transition, accompanied by an increase in fluctuations of the order parameter and adgesion degree, the presence of metastable states, and jumps in the degree of elongation and heat capacity of the chains at the transition
point. Two transitions with different relaxation behavior were found: to the state of chains completely cut off from the surface and the state of fully adsorbed chains. At the transition point, a “critical slowing down” effect is obsered [6], which consistsin a sharp increase
in the relaxation times to the mentioned states.
References
1.Sanchez I.C. Physics of Polymer Surfaces and Interfaces / I.C. Sanchez and Fitzpatrick L.E. // Boston: Butterworth - Heinemann. - 1992. - P. 3.
2.Karim A. Polymer Surfaces, Interfaces and Thin Films /A. Karim, and S.Kumar – Singapore. - World Sci. - 2000. - P. 5.
3.Skvortsov A.M. Mechanical desorption of a single chain: Unusual aspects of the coexist-
ence of a first-order transition /A.M.Skvortsov, L.I. Klushin, A.A. Polotsky, K.Binder // Phys.Rev. E. - 2012. V.85. – 031803. P. 1-16.
4.Landau L.D. Statistical physics. /L.D. Landau, and E.M. Lifshits - 1976. M.-Science. - V. 5. Part 1. - P. 484.
5.A.V. Maksimov, A.A.V. Maksimov, O.G. Maksimova, D.V.Diordiichuk // Ferroelectrics. - 2013. - V. 5 - № 444. - P. 150–155.
6.Fleury P.A. Phase Transitions, Critical Phenomena and Instabilitils /P.A. Fleury // Science. - V. 211. - № 4478. - PP. 125-131.
538.915
|
|
|
|
. . |
|
|
|
|
. |
.- |
. |
, |
,pomerant_yu@mail.ru |
|
|
|
« |
|
|
|
|
» |
|
|
|
|
|
|
– |
|
– |
|
|
|
|
|
. |
|
|
|
: |
|
|
|
, |
, |
- |
|
, |
|
|
|
. |
|
|
|
, |
|
|
|
|
|
- |
|
|
|
|
|
|
|
|
|
[1 -3]. |
|
|
|
, |
|
- |
|
, |
|
|
|
|
|
|
, |
, |
|
, |
|
. |
|
- |
, |
|
|
|
|
, |
|
, |
|
. |
|
- |
|
|
|
|
|
, |
|
|
|
|
- |
|
|
|
|
|
, |
|
||
, |
|
|
|
|
|
, |
|
|
|
|
|
|
|
||
|
( |
|
|
) |
, |
|
- |
|
|
|
|
. |
( |
|
) |
|
|
|
|
|
|
27

|
|
|
nk |
|
|
|
|
|
|
|
|
|
|
|
|
|
|
|
|
( |
|
) |
|
- |
|
|
|
|
|
|
|
|
|
|
|
|
|
|
|
|
|
|
|
|
|||||
|
|
|
wn (k ) |
2 |
(U0a2 ) |
dz c(z)(1 c(z)) Ann (z)gn (En (k )) . |
|
|
(1) |
|||||||||||||||
|
|
|
|
|
|
|||||||||||||||||||
|
|
|
|
|
|
|
|
|
n |
|
|
|
|
|
|
|
|
1D |
|
|
|
|
|
|
|
|
|
|
|
|
|
|
|
; gn (E) - |
|
|
|
|
n - |
|
|
- |
|||||||
c(z) ; a - |
|
|
|
|
|
|
|
|
|
|
|
|
||||||||||||
|
|
|
|
, |
|
|
|
|
|
|
|
|
|
|
|
|
|
|
|
|
|
|
|
|
|
|
|
|
|
gn (E) |
|
1 |
|
|
d 2k |
En (k ) E , |
|
|
|
|
|
(2) |
|||||||
|
|
|
|
|
|
|
|
|
|
|
|
|
||||||||||||
|
|
|
|
|
(2 )2 |
|
|
|
|
|
|
|||||||||||||
U0 - |
|
|
|
|
|
|
|
|
|
|
|
|
|
|
, |
|
|
|
|
|
- |
|||
|
|
|
|
|
|
|
|
|
|
: |
|
|
|
|
|
|
|
|
|
|
|
|
|
|
|
|
|
|
|
|
|
|
U (r) U0a3 ( ) (z z0 ) , |
|
|
|
|
|
(3) |
||||||||||
z0 - |
|
|
|
|
|
|
, |
- |
|
|
|
|
( |
|
xy) |
|
- |
|||||||
, |
|
|
|
|
|
|
|
|
|
|
|
|
|
|
|
|
|
|
|
|
|
|
|
|
|
|
|
|
|
|
|
A |
(z) f (z) f |
n |
(z) f |
n |
(z) f (z)a 1 |
, |
|
|
|
|
(4) |
||||||
|
|
|
|
|
|
|
nn |
|
|
n |
|
|
|
|
n |
|
|
|
|
|
|
|||
|
|
fn (z) |
|
|
|
|
|
|
|
|
|
|
|
|
|
|
|
|
|
|
|
|
, |
|
|
|
|
|
|
|
|
|
|
|
|
|
. |
|
|
|
|
|
|
, |
|
|
|
- |
|
|
|
|
|
|
|
|
|
|
|
|
|
|
|
|
|
, |
|
|
|
|
- |
|||
|
|
|
|
|
|
|
|
|
|
|
|
|
|
|
|
|
|
|
|
|
|
|
||
, |
|
|
|
|
|
|
|
|
|
|
|
|
|
|
|
|
|
|
|
. |
|
- |
||
|
|
|
|
|
|
|
|
|
|
|
|
|
|
|
|
|
|
|
. |
|
|
|
, |
- |
|
|
|
|
|
|
|
|
(1) |
|
|
|
|
|
|
|
|
|
|
|
|
|
- |
||
|
|
|
|
|
|
|
|
|
|
|
|
|
|
|
|
|
|
|
|
|
|
|||
|
|
|
|
|
|
|
|
|
|
|
|
|
|
|
|
|
|
Al0.3Ga0.7 As GaAs |
|
|
- |
|||
|
|
|
|
|
|
|
|
|
|
|
|
|
|
|
|
|
|
4-4-4 |
|
|
||||
- 4 ). |
|
|
( |
|
|
|
|
|
|
|
|
|
|
|
|
|
|
|
4 , |
|
|
|
- |
|
|
|
|
|
|
|
|
|
|
|
|
|
|
|
|
|
|
|
, |
|
|
|
|
||
4-4-4, |
|
|
|
|
|
|
|
|
|
|
|
|
|
|
|
|
|
|
|
|
|
|
meV, |
|
|
|
|
|
|
|
|
|
|
|
|
|
|
|
|
|
|
|
|
|
m0 . |
|
|
|
|
|
|
|
|
|
|
, |
|
|
|
|
|
|
|
|
|
|
|
|
|
|
|
|
4-4-4 |
|
|
|
1 |
|
2 |
|
|
|
1 |
|
|
|
2 |
|
|
|
LH1 |
|
LH2 |
|
|
|
|
||
|
4-4-4 |
121.8 |
180.75 |
|
57.158 |
|
|
65.228 |
|
|
84.97 |
|
131.098 |
|
|
, meV |
||||||||
|
|
0.075 |
0.076 |
|
0.136 |
|
|
|
0.142 |
|
|
0.165 |
|
0.178 |
|
. |
|
, m0 |
||||||
-
dz c(z)(1 c(z)) Ann (z)
c(z) const |
|
|
m* |
|
. |
|
|
|
|
|
|
|
(1 10) ps . |
1. |
Zhang Yong. Electronic structures of impurities and point defects in semiconductors / Yong |
|||||
Zhang // Chinese Physics B. – 2018. - Vol. 27. - Num.11. - |
. 1–40. |
|
||||
2. |
. . |
|
|
|
|
- |
|
|
/ |
. . |
, . . |
, . . |
// |
. – |
1995. - .62, |
. 3. - |
. 197–202. |
|
|
|
3. |
Belyavsky V.I. Deep Impurity States in Semiconductor Quantum Well Structures / Yu.V. |
|||||
28
Kopaev, N.V. Kornyakov, Yu.A. Pomerantsev and S.V. Shevtsov // Semicon. Sci. Technol. – 1998. - Vol. 13. - . 460–467.
UDC 537.9
ABOUT THE RELAXATION SPECTRUM OF THIN FERROELECTRIC
FILM IN A PHASE TRANSITION POINT
V.N. Nechaev1, A.V. Shuba2
1Doct. of phys.-math. sci, Prof., wladnic@mail.ru 2Cand. of phys.-math. sci, Assoc. prof., shandvit@rambler.ru
Military Educational and Scientific Centre of the Air Force N.E. Zhukovsky
and Y.A. Gagarin Air Force Academy (Voronezh)
In the framework of the Landau – Khalatnikov theory, the spectrum of relaxation frequencies and it temperature dependences in the near of the second-order phase transition point in a thin ferroelectric film were determined depending on the film thickness and degree of polarization fixation on the film surface.
Keywords: soft mode, ferroelectric film, phase transition.
The study of the relaxation time spectrum is necessary for understanding the general laws control the physical kinetics of materials, in particular, their thermal and electrical properties, absorption and damping of various types of waves. In second-order phase transitions, the shortest relaxation time in the system is the relaxation time of the order parameter. The relaxation of the order parameter in the phase transition under conditions of limited geometry and the influence of the environment is significantly different from the relaxation in the bulk material. The purpose of this work is to determine the temperature dependences of the lowest relaxation frequencies associated with the phase transition in a thin ferroelectric film for different thickness l and the degree of polarization fixation on the film surface. On the base of the Landau-Khalatnikov theory we write the dynamic equation, describing the oscillations of the polarization vector P 0,0,P :
F |
P 0, |
(1) |
P |
t |
|
where the first term is the variation of free energy F, and |
is the damping factor. We expand |
|
the expression for free energy density [1] in a series near the Curie temperature TC of an ideal crystal:
|
1 |
|
|
|
|
2 |
|
|
|
2 |
|
1 s |
2 |
|
|
||
F |
|
|
|
P |
|
|
|
P |
dV |
|
|
|
P |
dS, |
(2) |
||
V V |
|
|
V S 2 |
||||||||||||||
|
|
|
2 |
|
|
2 |
|
|
|
|
|
|
|||||
where 0 TC T , s are |
the |
volume |
and surface decomposition |
coefficients, re- |
|||||||||||||
spectively; a2 is the correlation constant, a is the lattice parameter; V and S are the volume and surface area of the film, respectively. Substituting expression (2) into (1), and, as-
suming a simple harmonic dependence of polarization on time P z,t P z e i t |
, we get |
|||||||
the equation |
d 2 P z |
|
|
|
|
|
|
|
|
i P z 0 |
|
(3) |
|||||
dz2 |
|
|
||||||
|
|
|
|
|
|
|
|
|
with boundary conditions |
|
dP z |
|
|
|
|
|
|
|
|
s P z |
|
|
0. |
(4) |
||
|
|
|
||||||
|
|
dz |
|
z 0,l |
||||
|
|
|
|
|
|
|
||
|
|
|
|
|
|
|
|
|
Substituting the solution of equation (3) into the boundary conditions (4), we obtain a homo- geneous system of linear equations for the integration constants .Equating it’s determinant to
zero gives a transcendental equation for determining the temperature dependences of relaxa-
29