

Учебное пособие 800637
.pdf
|
|
|
|
|
|
|
|
|
|
- |
|
10÷20 |
103 |
|
|
|
0 |
~ 80 % |
|
- |
|
|
[2]. |
|
|
|
|
|||||
|
|
+1500 |
|
|
|
|
|
|
|
|
|
|
. |
|
|
|
|
|
|
|
|
tg . |
. |
0,1 |
100 |
|
|
|
|
|
|
- |
|
|
|
|
|
|
|
|
|
|
|
|
|
|
|
|
|
|
. |
, |
|
|
|
|
, |
|
|
|
|
|
2 |
. |
- |
|
|
|
|
|
|
|
|
|
|
|
|
|
|
|
|
|
|
SiO2. |
|
|
|
|
1. Nguyen H.T.. Electrophysical Properties of Matrix Composites Nanocrystalline Cellulose - |
|||||||||
Triglysine Sulfate. / S.D. Milovidova, |
. . |
, . . |
|
|
|
//Ferroelectrics .- 2017. - |
||||
Vol. 512. N 1. - P. 71 - 76. |
|
|
|
|
|
|
|
|
||
|
2. |
. . |
|
|
|
|
|
|
- |
.// |
. . |
, . . |
. |
. . |
// |
. |
. |
. |
., 2019. - . 83. - № 9. |
||
-. 1201 - 1204.
:537.227
|
. . |
|
|
1, . . |
|
2, . . |
3 |
1 |
. |
.- |
. |
, |
|
, milovidova@Phys.vsu.ru |
|
|
|
||||||
|
2 |
. |
.- |
. |
, |
, olamil@mail.ru |
|
|
|
|
|||||
|
3 - . |
.- |
. |
, |
|
, darinskii@mail.ru |
|
|
|
« |
|
|
|
|
» |
|
|
|
|
|
|
, |
. |
|
|
|
|
|
|
|
|
. |
: |
|
|
|
|
, |
, |
. |
|
|
|
|
|||
|
|
|
|
|
|
|
|
|
|
|
|
|
|
|
- |
. |
|
|
|
|
|
-, |
- |
|
|
|
|
|
|
- |
|
|
|
|
|
|
|
|
|
|
|
|
|
|
|
|
. |
|
|
|
|
|
|
. |
, |
|
|
|
|
|
|
|
|
|
, . . |
|
|
|
, |
[1]. |
|
|
|
|
|
|
|
|
|
|
|
|
|
|
[2] |
|
- |
. |
|
|
|
|
|
|
- |
|
|
|
|
|
|
|
|
|
, |
|
|
|
|
|
- |
90
|
[3]. |
|
|
|
|
|
, |
|
|
|
|
|
|
. |
|
|
|
|
|
|
|
|
|
|
|
|
|
|
|
. |
- |
|
. |
|
|
|
|
- |
|
|
|
|
|
|
|
||
|
|
|
, |
|
|
|
(a). |
|
, |
50 |
( |
~ 50 / ) [2], |
|
|
- |
|
. |
|
|
|
|||
|
|
|
|
|
|
|
|
( |
2 |
. a). |
|
+ |
|
|
- |
|
|
|
|
|
|
||
|
|
|
|
( |
1 |
. b). |
- |
|
|
|
|
( |
2 |
. b). |
|
a) |
|
|
) |
. |
|
|
(a) |
(b): 1 – |
|
, 2 - |
|
, |
L, α – |
[1]. |
- |
,
,
,
.
1. Lines M., Glass . Ferroelectrics and related materials.// M., “Mir”, 1981. - 736 p.
2. Rogazinskaya O.V. Electrophysic Properties of TGS Crystals Grown at the Temperatures Below 00C./ S.D. Milovidova, A.S. Sidorkin, O.B. Yatsenko, A.N. Yuryev, and Zh.D. Stekhanovaa // Ferroelectrics, 2004. - V. 307. - P. 251 - 254.
3. |
. .,. |
|
|
|
|
, |
|
|
|
/ |
. . |
, . . |
, . . |
// |
, 2009. |
- . 51. - |
.7. - |
. 1433 - 1435. |
|
|
91
UDC 537.226
STUDIES OF THE ION SUBSTITUTION EFFECT ON THE MAGNETIC PHASE TRANSITION TEMPERATURE OF BiFeO3-ATiO3 (A=Pb, Sr) SOLID SOLUTION MULTIFERROICS
S.P. Kubrin1, I.P. Raevski2, M.D. Miruschenko3, E.A. Bikyashev4, M.A. Malitskaya5, I.N.
Zakharchenko6, S.I. Raevskaya7, V.V. Titov8, Jian Zhuang9 1PhD, senior research associate, stasskp@gmail.com
2Dr. phys-mat.sci., professor, igorraevsky@gmail.com
3Student , miruschenko98@gmail.com
4PhD, associate professor, eabikyashev@yandex.ru
5PhD, senior research associate, mamalitskaya@sfedu.ru
6PhD, senior research associate, zinik46@mail.ru
7PhD, associate professor, siraevskaya@sfedu.ru
8PhD, research associate, vvtitov@sfedu.ru Southern Federal University, 344090, Rostov-on-Don, Russia
9PhD, associate professor, jzhuang@xjtu.edu.cn
Xi’an Jiaotong University, 710049, Xi’an, People’s Republic of China
Mossbauer and magnetization studies of 0.5BiFeO3-0.5ATiO3 (A=Pb, Sr) solid solution compositions prepared using solid phase reactions route have been carried out. Temperature TN of
magnetic phase transition for 0.5BiFeO3-0.5PbTiO3 is about 150 K, while for 0.5BiFeO3-0.5SrTiO3 it is only ≈ 20 K. This dramatic difference in TN values is ascribed to additional contribution of the
magnetic superexchange between Fe3+ ions via the empty 6p states of Bi3+ and Pb2+ ions to the overall superexchange in accord with theoretical predictions.
Keywords: multiferroics, Mossbauer effect, BiFeO3, magnetic superexchange.
BiFeO3 is the most widely studied multiferroic due to high temperatures of both ferroelectric and magnetic phase transitions. Recently a possibility of magnetic superexchange between Fe3+ ions in BiFeO3 via the empty 6p states of Bi3+ was predicted theoretically [1]. Earlier we showed the role of Pb2+ ions which also possess the empty 6p states, in the enhancement of the magnetic phase transition temperature TN in perovskite Pb1−xAxFe1/2Nb1/2O3 (A= Ca, Ba) solid solutions [2, 3]. However this mechanism of magnetic superexchange seems to become noticeable only at high enough dilution of the Fe-sublattice, i.e. in solid solutions.
The 0.5BiFeO3-0.5ATiO3 (A=Pb, Sr) solid solution compositions were prepared using solid phase reactions route. The XRD study revealed that the samples are single phase and possess the perovskite structure. Room temperature Mossbauer spectra of both compositions consist of the quadrupole-split double lines. The main reason of quadrupole splitting in such systems is a compositional disorder in B-sublattice. All spectra contain 2 or 3 doublets with different values of quadrupole splitting. The isomer shift values of doublets correspond to the Fe3+ ions in oxygen octahedron. The presence of 2 or 3 doublets indicates that Fe3+ has 2 or 3 different environments in the lattice which may be a fingerprint of B-cations short-range ordering or clusterization [4]. To estimate the temperature of magnetic phase transition (TN) we performed the measurement of Mossbauer spectrum line intensity Im under subsequent temperature lowering. Near magnetic phase transition the Mossbauer spectrum transforms from
doublet into sextet and Im decreases dramatically. Mossbauer studies have shown that while for 0.5BiFeO3-0.5PbTiO3 the TN value is about 150 K, for 0.5BiFeO3-0.5SrTiO3 it is only ≈
20 K. This dramatic difference in TN values seems to be due to additional contribution of the superexchange between Fe3+ ions via the empty 6p states of Bi3+ and Pb2+ ions to the overall superexchange in accord with predictions of De Sousa et al. for BiFeO3 [1] and the experimental findings for PbFe1/2Nb1/2O3–based solid solutions [2, 3].
For both compositions magnetization M studies in the 5 K- 200 K range revealed only a maximum at 20-25 K in the zero-field cooling mode. In the field-cooled mode this maximum was not observed. Such behavior is typical of spin glasses. In PbFe3+1/2B5+1/2O3
92
(B5+=Nb, Ta) perovskite multiferroics a spin-glass state is known to coexist at low temperatures with the antiferromagnetic state [2]. The absence of the M(T) anomaly at around 150 K for 0.5BiFeO3-0.5PbTiO3 composition seems to be due to the strong diffusion of this anomaly. Similar "disappearance" of the M(T) anomaly corresponding to antiferromagnetic phase transition was observed, e.g. for some compositions of the PbFe2/3W1/3O3-PbTiO3 and PbFe1/2Nb1/2O3 -PbTiO3 solid solutions [5, 6].
This work was supported in part by RFBR project 19-52-53030 GFEN_a and by the Ministry of Education and Science of the Russian Federation (research projects 3.1649.2017/4.6 and 3.5346.2017/BP).
References
1.De Sousa R. Theory of spin-orbit enhanced electric-field control of magnetism in multifer-
roic BiFeO3 / R. De Sousa, M. Allen, M. Cazayous, Phys. Rev. Lett. – 2013. – V. 110 – № 26. – P.267202-1 – 267202-5.
2.Raevski I.P. Experimental evidence of the crucial role of nonmagnetic Pb cations in the en-
hancement of the Néel temperature in perovskite Pb1−xBaxFe1/2Nb1/2O3 / I.P. Raevski, S.P. Kubrin, S.I. Raevskaya, et al. // Phys. Rev. B – 2009. – V.80. – № 2. P.024108-1 -024108-6.
3.Raevski I.P. Studies of ferroelectric and magnetic phase transitions in Pb1−xAxFe1/2Nb1/2O3 (A-Ca, Ba) solid solutions / I.P. Raevski, S.P. Kubrin, S.I. Raevskaya, et al. // Ferroelectrics 2010. – V. 398. – № 1. – P. 16-25.
4.Raevski I.P. Magnetic Properties of PbFe1/2Nb1/2O3: Mossbauer spectroscopy and first principles calculations / I. P. Raevski, S. P. Kubrin, S. I. Raevskaya, et al. // Phys.Rev.B. – 2012. – V. 85. – № 22. – P. 224412 –1 – 224412 –5.
5.Mitoseriu L. Magnetic properties of PbFe2/3W1/3O3-PbTiO3 solid solutions / L. Mitoseriu, D.
Marre, A. S. Siri, P. Nanni, Appl. Phys. Lett. – 2003. – V. 83. – № 26. – P. 5509 – 5511.
6. Singh S.P. Ferroic transitions in the multiferroic (1−x)Pb(Fe1/2Nb1/2)O3–xPbTiO3 system and its phase diagram / S.P. Singh, S.M. Yusuf, S. Yoon, S. Baik, N. Shin, D. Pandey // Acta Mater. – 2010. – V. 58. – P. 5381–5392.
537.9
-
Sn2P2S6
|
. . |
|
|
1, . . |
|
2, . |
3, . . |
4 |
|
|
|
|
1 |
|
, i.morsakov@gmail.com |
|
|
||
|
|
|
|
|
|
|
|
|
|
|
2 |
- |
.- |
. |
, |
, a.solnyshkin@mail.ru |
|
|
|
|
|
|
|
3 |
|
, ars@mail.ru |
|
|
|
|
4 - |
. |
, |
|
|
, nanointech@mail.ru |
|
||
|
|
|
|
|
|||||
|
|
|
|
« |
|
|
» |
|
|
|
|
|
|
|
|
|
« |
» |
|
|
|
|
|
|
. |
, |
|
Sn2P2S6 |
|
|
|
|
|
|
|
|
. |
||
|
|
|
|
|
|
|
|
|
|
|
|
: |
|
|
|
, |
. |
. |
|
|
|
|
|
|
|
|
|||
|
|
|
|
- |
|
|
|
Sn2P2S6 |
- |
|
|
|
|
|
|
|
|
. |
- |
ё |
|
|
|
|
|
|
|
|
- |
, |
, |
|
|
, |
|
|
|
|
- |
|
|
|
|
. |
|
, |
|
|
- |
|
|
|
|
|
|
|
|
|
|
|
|
|
|
ё |
|
. |
|
|
- |
93
|
|
|
|
|
|
|
|
. |
|
ё |
, |
|
|
|
|
|
|
|
|
|
|
|
|
|
, |
|
|
- |
|
|
|
|
, |
|
|
|
|
|
|
|
|
|
||
|
|
|
|
|
|
|
|
|
|
Sn2P2S6. |
Sn2P2S6, |
- |
||
|
|
|
. |
|
|
|
|
|
|
|
|
|||
|
- |
|
|
. |
|
|
|
|
|
|
|
|
- |
|
|
, |
|
|
|
|
|
|
|
|
|
. |
|
|
|
|
|
|
|
|
|
|
|
|
|
|
|
|
||
|
20 120 |
|
|
|
|
- |
|
|
|
Sn2P2S6 |
|
- |
||
|
|
|
|
|
|
|
|
|
. |
|
|
|
|
- |
|
|
|
|
|
~510 |
|
|
|
|
|
, |
|
- |
|
|
|
|
|
|
|
|
|
|
|
|
|
|||
|
|
|
|
|
|
|
|
|
|
|
|
|
|
- |
|
|
|
Sn2P2S6. |
|
. |
|
|
|
|
|
|
|
|
- |
|
|
|
|
|
|
|
|
|
|
|
|
|
|
|
|
|
|
|
- |
. |
|
|
|
|
|
Sn2P2S6 |
|
|
|
|
7-20. |
|
|
|
|
|
|
|
|
|
|
|
||
|
|
|
|
|
|
|
|
|
|
|
|
|
||
|
, |
|
( |
) |
|
|
|
|
|
. |
. |
|
|
- |
|
|
|
Sn2P2S6. |
|
|
|
|
|
|
|
||||
|
16 |
|
|
|
|
|
|
0,5 |
|
|
|
|
|
|
|
|
|
|
|
|
|
0,4 |
|
|
|
|
|
|
|
|
14 |
|
|
|
|
|
|
|
|
|
|
|
|
|
Ф |
|
|
|
|
|
0,3 |
|
|
|
|
|
|
||
|
|
|
|
|
|
|
|
|
|
|
|
|
||
, |
|
|
|
|
|
|
|
|
|
|
|
|
|
|
С |
|
|
|
|
|
|
|
|
|
|
|
|
|
|
12 |
|
|
|
|
|
|
0,2 |
|
|
|
|
|
|
|
|
|
|
|
|
|
|
|
|
|
|
|
|
||
|
10 -20 |
-10 |
0 |
10 |
20 |
|
|
0,1 -20 |
-10 |
0 |
10 |
20 |
|
|
|
|
|
U, В |
|
|
|
|
|
|
|
U, В |
|
|
|
|
. |
|
) |
|
|
|
( |
) |
|
|
) |
|
|
|
|
|
|
|
. |
|
|
|
|
– |
|
|
|||
|
|
– |
|
|
|
|
|
|
|
|
|
|
||
|
; |
|
|
|
|
|
|
|
|
|
|
|
|
|
|
|
|
|
|
( |
. |
), |
|
|
C(U) |
|
|
- |
|
|
|
|
|
|
, |
|
|
|
|
|
|
|
|
. |
|
|
|
|
|
|
|
|
|
|
|
|
|
|
- |
Sn2P2S6, |
|
|
|
|
|
|
|
|
C(U). |
|
. |
- |
||
|
|
|
|
|
|
|
|
|
|
|
|
|
- |
|
|
|
|
|
|
|
|
|
|
|
|
. |
|
|
- |
|
|
|
|
|
|
|
|
|
|
|
|
|
- |
|
|
|
|
|
|
|
|
|
|
|
|
|
|
, |
|
|
|
|
|
|
. |
|
|
|
|
|
|
|
- |
|
|
|
|
|
|
|
|
|
|
|
|
|
|
||
|
|
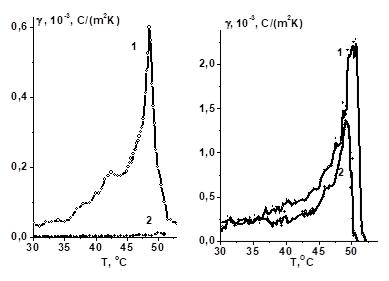
Tmax 70 . |
|
|
|
|
|
|
|
|
|
|
- |
|
|
|
|
|
|
Sn2P2S6 ( |
=66 ). |
. |
|
|
- |
||||
|
|
|
|
|
|
|
|
|
|
|
|
|
- |
|
|
|
|
|
|
|
|
|
|
|
|
|
|
|
- |
|
|
|
|
|
~5 |
|
|
|
|
|
|
|
520 |
, |
|
|
|
|
|
94 |
|
|
|
|
|
|
|
|
|
. |
- |
|
- |
Sn2P2S6.
( |
RFMEFI57517X0129). |
537.9
|
. . |
|
|
|
1, Y.Gagou2, P.Saint-Gregoire3, . . |
4, |
|
|||
|
|
|
|
|
. . |
5, . |
. |
6 |
|
|
|
1 |
- |
|
.- . |
, |
, sidorkin@phys.vsu.ru |
|
|||
|
|
|
|
|||||||
|
|
|
|
|
|
2Lecturer |
|
|
|
|
|
|
|
|
|
|
3Professor |
|
|
|
|
|
|
4 |
. |
.- . |
, |
, lolita122@mail.ru |
|
|||
|
|
|
|
|||||||
|
|
5 |
. |
|
.- . |
, , n-popravko@yandex.ru |
|
|||
|
|
|
|
|
||||||
|
6 |
|
. |
.- . |
, , alexeypakhomovvv@gmail.com |
|
||||
|
1,4,5,6 |
|
|
|
« |
|
|
|
» |
|
|
|
|
|
|
|
|
|
|
|
|
|
|
|
2 LPMC, Universite de Picardie Jules Verne |
|
|
|||||
|
3ICGM, C2M, Laboratory MIPA, Department of Sciences and Arts, University of Nimes |
|
||||||||
|
|
|
|
|
|
: SrTiO3/BaTiO3/SrTiO3. |
, |
- |
||
|
|
|
|
|
|
|
|
|
|
- |
|
|
|
BaTiO3. |
|
. |
|
|
- |
||
|
|
: |
|
|
, |
|
, |
|
- |
|
. |
|
|
|
|
|
|
||||
|
|
|
|
|
|
|
|
|
|
|
|
|
|
|
|
|
|
|
|
|
- |
|
|
|
|
|
|
|
|
|
. |
- |
|
, |
|
|
|
|
|
|
|
|
|
|
|
|
|
|
|
|
|
|
- |
|
|
|
|
|
|
|
|
|
|
|
|
|
[1,2]. |
|
|
|
|
|
|
|
|
- |
|
BaTiO3 |
|
|
|
, |
|
|
|
|
- |
|
|
|
|
|
|
|
|
|
|
|
|
. |
|
|
|
|
|
|
|
|
|
BaTiO3. |
|
|
|
|
|
|
|
SrTiO3 |
|
|
|
|
|
|
|
|
|
|
- |
||
|
|
|
|
|
|
, |
|
|
, |
|
SrTiO3/BaTiO3/SrTiO3, |
|
|
|
|
|
- |
||||
|
|
|
|
|
|
|
||||
ST-Nb |
|
|
|
|
|
LaSrCoO3 |
|
- |
||
. |
. |
|
|
|
|
BaTiO3 |
|
|
|
|
7,51 |
|
|
|
|
|
|
|
- |
- |
|
|
ё |
|
|
|
|
Pt |
|
, |
|
|
|
. |
|
|
|
|
|
|
|
, |
|
|
|
|
|
|
|
|
, |
|
- |
|
|
Ps |
|
|
|
Ec. |
|
|
|
||
|
|
|
|
|
|
|
|
|
||
95
|
|
, |
- |
, |
|
|
- |
|
, |
|
BaTiO3 |
SrTiO3. |
|
|
3, 987 Å. |
|
|
|
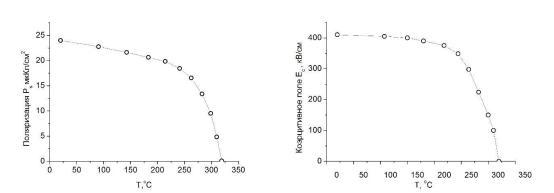
310 ° |
320 ° , |
|
700 |
- |
100 ° |
150 ° |
40, |
6 % |
. |
|
|
310-320 ° . |
|
|
|
|
|
|
Ps Ec, |
, |
320 ° . |
|
|
|
а) б)
Рисунок. Температурная зависимость спонтанной поляризации (а) и коэрцитивного поля (б) слоистой тонкопленочной структуры SrTiO3/BaTiO3/SrTiO3
,
№17-72-20105.
1.Shimuta T. Enhancement of remanent polarization in epitaxial BaTiO3/SrTiO3 superlattices with “asymmetric” structure / T. Shimuta, O. Nakagawara, T. Makino and S. Arai // J. Appl. Phys. –
2002. – V. 91 – P. 2290–2294.
2. El Marssi M. Ferroelectric BaTiO3/BaZrO3 superlattices: X-ray diffraction, Raman spectroscopy, and polarization hysteresis loops / M. El Marssi, Y. Gagou, J. Belhadi, F.De Guerville, Y.I.Yuzyuk and I.P. Raevski // J. Appl. Phys. – 2010. - 108:084104
UDC 53.043
RELAXATION OF THE STRUCTURE OF THIN PZT FILMS DURING RAPID
THERMAL ANNEALING
V.V. Petrov1, V.V.Polyakov2, Yu.N.Varzarev3, A.A. Rozhko4, A.S. Kamentsev5 1Dr. tech. Sciences, Professor, vvp2005@inbox.ru
2Cand. tech. Sciences, Associate Professor, polvadim@yandex.ru
3Cand. tech. Sciences, lecturer, varzarevyuv@sfedu.ru
4Research engineer, tolstanton@yandex.ru
5Graduate student, drerozhko@mail.ru
Southern Federal University, Scientific-educational center "Microsystem engineering and multisensory monitoring systems", Taganrog, Russia
This paper presents the results of the influence of rapid thermal annealing (RTA) on the crystal structure of lead zirconate titanate (PZT) films formed by the method of high-frequency reactive plas-
96
ma spraying. It is shown that with an increase in the temperature of the RTA from 500 to 700 ° C, the number of crystallites growing in the (110) direction increases.
Keywords: lead zirconate titanate, crystal structure, rapid thermal annealing.
Thin ferroelectric PZT films of Pb (Zr, Ti)O3 composition were deposited on silicon substrates on the “Plasma-80» installation using high-frequency reactive plasma spraying in
an oxygen atmosphere with a pressure of 0.51 Torr [1, 2]. The thickness of the PZT film ap- plied to the silicon substrate was 1.0 ± 0.1 m. In the future, the samples were divided into
several parts. One part of the samples was subjected to rapid thermal annealing (RTA) with halogen lamps in the ITO-18 installation at temperatures of 500, 600 and 700 °C and anneal-
ing times of 30 s, and a number of the samples remained without exposure to RTA.
Using X-ray phase analysis, it was found that the films that did not undergo RTA have a PZT phase with a predominant crystallite growth in the (110) and (001) directions. And in the films that underwent RTA, the crystal structure changed, namely, the maximum of the peak of the perovskite phase (001) shifted towards smaller angles 2 , and the maximum of
peak (110), conversely, shifted towards larger angles 2 , as shown in the table. These results indicate that at higher RTA temperatures (600 and 700 °C), the transformation of the PZT
crystal lattice towards the predominance of the tetragonal phase is observed.
This conclusion is also confirmed by an estimate of the crystallite size of the PZT, which was produced by the Scherer equation, as well as by the ratio of the intensities of the maxima of the I(110) and I(001) peaks, which are presented in the table. The calculation showed that there is an increase in the size of crystallites of the crystallographic orientation (110) and a decrease in the size of crystallites of orientation (001).
Energy dispersive analysis of the film structure showed that the ratio of elements in the Zr / Ti film is 0.36 / 0.64. This fact, according to the PZT phase diagram [3], also indicates the predominance of the ferroelectric tetragonal phase.
|
|
|
|
|
|
Table |
|
|
|
The sizes of crystallites PZT |
|
|
|
||
Sample number |
Angle 2 for the maximum |
PZT crystallite size for |
Peak intensity |
|
|||
|
of the PZT peak for orien- |
orientations |
ratio |
|
|||
|
|
tations |
|
|
|
|
|
|
(001) |
|
(110) |
(001) |
(110) |
I(110)/I(001) |
|
PZT |
22,22 |
|
31,32 |
51 |
12.8 |
1,2 |
|
PZT + RTA 500 |
22,22 |
|
31,32 |
47 |
20.1 |
1,2 |
|
PZT + RTA 600 |
22,22 |
|
31,34 |
47 |
30.6 |
1,3 |
|
PZT + RTA 700 |
22,18 |
|
31,36 |
17.6 |
35.2 |
1,6 |
|
The results were obtained using the equipment of the centers for collective usage “Mi- crosystem Engineering and Integrated Sensory” and “Nanotechnologies” of Southern Federal
University.
Thanks to Pavlenko A. V. and Stryukov D. V. for conducting x-ray phase studies. This work was supported by the RFBR grant No. 18-29-11019.
References
1.Mukhortov V.M., Yuzyuk Yu I. Heterostructures based on nanoscale ferroelectric films: production, properties and applications/ Rostov-on-Don: Southern Scientific Center of RAS, 2008. – 224 .
2.Kovalenko D.A., Petrov V.V., Klindukhov V.G. Investigation of the influence of techno-
logical parameters of the formation of lead zirconate titanate thin films on their structural and electrophysical properties // J. Izvestiya SFedU. Engineering sciences, №9. P.124-132.
3.Shirane G. Suzuki K., Takeda A.Phase transition in solid solution of PbZrO3 and PbTiO3 X-ray study//J.Phys.Soc. Japan, 1952. - V. 7. - № 1. - P. 12-18
97
538.95, 544.344.015.4
|
. . |
1, . . |
2, . . |
3, . . |
4 |
|
|
1 |
|
, harigamypeople@gmail.com |
|
||
|
|
|
|
|||
|
|
2 |
, lugovaya_maria@mail.ru |
|
|
|
|
|
|
|
|
||
|
3 |
|
, step_scherbinin@list.ru |
|
|
|
|
|
|
|
|
||
4 - |
.- . |
, |
|
, arybyanets@gmail.com |
|
|
|
|
« |
|
|
» |
|
|
|
|
|
|
(X/65/35) |
|
|
|
. |
|
|
, |
|
|
|
|
|
|
. |
|
. |
: |
|
, |
|
, |
|
|
|
|
|
|
|
|
|
|
|
|
|
|
- |
|
. |
|
|
|
|
- |
|
|
|
|
|
|
- |
|
|
|
, |
|
|
- |
|
[1]. |
, |
|
|
|
- |
|
|
|
|
|
|
|
|
, |
|
|
|
, |
, |
|
(X/65/35) |
|
|
|
|
- |
|
|
|
|
|
- |
|
|
. |
|
|
|
|
|
|
|
|
|
|
|
|
(Pb1-xLax)(Zr0,65Ti0,35)O3 |
|
x=6.5 - 8.5%. |
- |
|||
|
|
|
|
|
|
- |
|
. |
|
|
|
|
7.715 |
/ 3. |
|
|
|
|
|
- |
|
|
|
|
|
NeoPhot-21. |
- |
|
|
, |
|
|
|
- |
Agilent 4294A |
|
|
|
PRAP [2]. |
- |
|
|
|
|
- |
|||
|
|
|
|
|
|
|
|
|
|
, |
|
, |
- |
|
|
|
|
(6.5/65/35). |
|
|
|
|
|
|
|
( |
) |
|
|
|
(7.5/65/35) |
|
|
Td , |
|
|
|
. |
|
|
- |
( . |
). |
|
|
|
|
- |
|
|
|
|
- |
||
|
|
|
|
|
|
|
|
|
|
(X/65/35) |
|
- |
|
|
|
(Td ), |
|
|
|
- |
|
|
|
98 |
|
|
|
-
.
) |
|
) |
|
|
. |
|
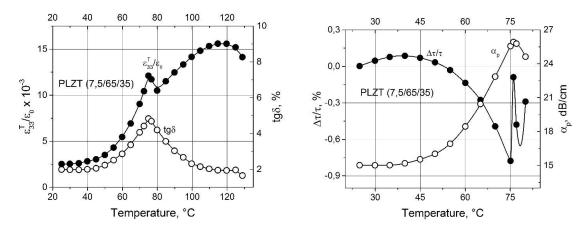
( 33T |
/ 0 ), |
|
|
(tg ) ( ), |
( / ) |
( p ) |
|
( ) |
( Pb0,925La 0,075)(Zr0,65Ti0,35)O3 . |
|
|
|
|
). |
|
( |
№ |
12.5425.2017/8.9, |
|
|
|
|
1.Pytel K. Dielectric properties of PLZT-X/65/35 (2 ≤x ≤13) under mechanical stress, electric field and temperature loading / Pytel et al. // Condens. Mater Phys. - 2013. - V. 16. - I. 3. - P. 1-6.
2.A. Rybianets et al., Accurate evaluation of complex material constants of porous piezoelectric ceramics. IEEE Ultrason. Symp. Proc., 1533 (2006).
3.A. Rybianets, SAW Method for Measuring of Relaxation Process in Ferroelectric Ceramics. Proc. 2007 IEEE Ultrason. Symp. IUS., 1909 (2007).
538.95
Ba0,8Sr0,2TiO3
|
. . |
1, |
. |
. |
2 |
|
|
1 - |
.- . |
, |
|
, s_gridnev@mail.ru |
|
|
|
|
2 |
, popovich_vano@mail.ru |
|
|
|||
« |
|
» |
|
||||
|
|
|
|
|
|
||
|
25 |
200 |
|
|
|
|
|
|
Ba0,8Sr0,2TiO3. |
|
. |
|
|
|
|
. |
|
|
|
|
|
|
|
|
|
|
|
|
|
|
|
: |
|
- |
, |
|
, |
|
. |
|
|
|
|
|
tg |
|
- |
|
Ba0,8Sr0,2TiO3. |
|
|
≈ 70 ° |
, |
- |
|
|
. |
1- |
. |
|
- |
w ≈ 105 |
, |
|
|
|
|
|
|
||
99