

vk.com/id446425943
Oil output
Renaissance Capital
20 June 2019
Russian oil & gas
Russia’s most recent peak in oil output was in 1987, when output stood at 11,484kb/d, and accounted for 18.9% of the world total. Russia was the largest oil producer in the world then, well ahead of the US (which produced 9,900kb/d) and Saudi Arabia (4,600kb/d). It was also the world’s largest exporter of liquid hydrocarbons in 1988, when it delivered an estimated 205mnt to export markets.
In 2009, Russia regained the top spot, which it maintained in 2010 with average production of 10.15mnb/d, 2.0% ahead of Saudi Arabia’s 9.96mnb/d – Russia’s production accounted for 12.3% of the world total. In 2011, Russia again moved to second place, with total crude output of 10.64mnb/d (accounting for 12.8% of the world total), 7.7% below Saudi Arabia’s 11.6mnb/d. In 2014 Russia slid to third place, with its production of 10.84mnb/d overtaken by the US with 11.78mnb/d production.
In 2018, Russia continued to hold third place, having produced 11.44mnb/d, below only Saudi Arabia, which produced 12.29mnb/d, and the US, which has solidified its first place with total production of 15.31mnb/d. In 2018, Russia’s total exports of liquids (including oil products) to non-CIS destinations reached 381mnt (242mnt of crude, 139mnt of products), and were the second largest in the world. Saudi Arabia held first place with 424mnt.
In the late 1980s and throughout most of the 1990s, the Russian oil sector experienced a protracted crisis caused by the disruption of Soviet commercial and technological links, and an economic slump at home. Importantly, severe underinvestment, which has often been blamed for the downturn in Russian oil output, was the effect, rather than the cause, of the slump in demand, in our view. Most production indicators declined sharply until 1996, the beginning of a three-year trough. From 2000, an increasingly vigorous recovery took place that lasted for several years.
Russia’s crude output growth began to slow markedly from mid-2004, before entering negative territory at the start of 2008. The breakup of Yukos was the principal cause, but the slowdown was fairly widespread, reflecting poor or paralysed policy in a number of important areas, in our view.
However, things started to reverse in early 2009, when crude output started rising again, after 14 consecutive months of decline. The launch of new fields (Yuzhno-Khulchuyskoye, Uvat, Talakan and Vankor) as well as the ramp-up of production at Sakhalin-2 helped to push growth to 2.2% in 2010. The growth rate averaged 1.1% over 2010-2015 and increased to 2.5% in 2016, as the next wave of greenfields such as Filanovskogo, Suzun, Pyakyakhinskoye, Novoportovskoye and Prirazlomnoye contributed to production growth. A key event in 2016 was the oil output cut agreement with OPEC countries, whereby Russia committed to a 300kb/d production cut from the reference level of November 2016 (11.3mnb/d). Russia delivered on this promise and in 2017 Russian production was down 266kb/d, or 2.4%. Following the relaxation of OPEC+ quotas in June 2018, Russia reached a new post-Soviet record in production of 11.45mnn/d in December 2018. On 7 December 2018 OPEC+ countries agreed to a further 1.2mnb/d output cut and a six-month production freeze. Russia’s share of the production cut was reported at 228kb/d, reflecting a 2.0% reduction vs the October 2018 actual output.
Russia is the third-largest oil producer in the world, and the second-largest exporter of liquids (including oil products)
Peak production of 11.45mnb/d was reached in December 2018, helped by new oil fields and relaxation of OPEC+ quotas
Figure 5: Russian oil industry indicators, mnt
|
2001 |
2002 |
2003 |
2004 |
2005 |
2006 |
2007 |
2008 |
2009 |
2010 |
2011 |
2012 |
2013 |
2014 |
2015 |
2016 |
2017 |
2018 |
Oil output |
352 |
384 |
426 |
463 |
475 |
486 |
497 |
494 |
501 |
512 |
519 |
527 |
532 |
535 |
542 |
556 |
554 |
563 |
Domestic consumption |
127 |
122 |
126 |
125 |
125 |
130 |
130 |
134 |
128 |
133 |
142 |
145 |
144 |
152 |
144 |
148 |
146 |
146 |
Non-CIS oil exports |
140 |
155 |
175 |
207 |
204 |
217 |
214 |
205 |
211 |
213 |
214 |
213 |
208 |
199 |
222 |
236 |
235 |
242 |
Exp drilling, km |
1144 |
721 |
681 |
583 |
627 |
723 |
867 |
852 |
464 |
701 |
747 |
804 |
817 |
994 |
818 |
914 |
988 |
1,067 |
Dev drilling, km '000 |
9.0 |
7.7 |
8.6 |
8.4 |
9.2 |
11.6 |
13.8 |
14.6 |
14.1 |
16.5 |
18.0 |
20.0 |
20.8 |
19.8 |
22.1 |
24.7 |
27.6 |
27.6 |
Idle well count, '000 |
31.5 |
36.1 |
36.3 |
36.8 |
30.0 |
27.2 |
25.8 |
25.4 |
25.9 |
22.5 |
22.4 |
22.2 |
21.6 |
22.0 |
21.5 |
21.6 |
24.6 |
22.4 |
Note: Domestic consumption includes refinery fuel and losses.
Source: BP’s Statistical Review of World Energy 2019, InfoTEK, Federal Customs Service
10
vk.com/id446425943
Figure 6: World oil consumption, mnt
|
|
North America |
|
|
|
|
|
|
Other |
|
|
|
|
|
|
|
|
Europe & Eurasia |
|
||||||||
|
|
Russia |
|
|
|
|
|
|
|
Asia Pacific |
|
|
|
|
|
|
|
Middle East |
|
|
|
||||||
1,800 |
|
|
|
|
|
|
|
|
|
|
|
|
|
|
|
|
|
|
|
|
|
|
|
|
|
|
|
1,600 |
|
|
|
|
|
|
|
|
|
|
|
|
|
|
|
|
|
|
|
|
|
|
|
|
|
|
|
1,400 |
|
|
|
|
|
|
|
|
|
|
|
|
|
|
|
|
|
|
|
|
|
|
|
|
|
|
|
1,200 |
|
|
|
|
|
|
|
|
|
|
|
|
|
|
|
|
|
|
|
|
|
|
|
|
|
|
|
1,000 |
|
|
|
|
|
|
|
|
|
|
|
|
|
|
|
|
|
|
|
|
|
|
|
|
|
|
|
800 |
|
|
|
|
|
|
|
|
|
|
|
|
|
|
|
|
|
|
|
|
|
|
|
|
|
|
|
600 |
|
|
|
|
|
|
|
|
|
|
|
|
|
|
|
|
|
|
|
|
|
|
|
|
|
|
|
400 |
|
|
|
|
|
|
|
|
|
|
|
|
|
|
|
|
|
|
|
|
|
|
|
|
|
|
|
200 |
|
|
|
|
|
|
|
|
|
|
|
|
|
|
|
|
|
|
|
|
|
|
|
|
|
|
|
0 |
|
|
|
|
|
|
|
|
|
|
|
|
|
|
|
|
|
|
|
|
|
|
|
|
|
|
|
1991 |
1992 |
1993 |
1994 |
1995 |
1996 |
1997 |
1998 |
1999 |
2000 |
2001 |
2002 |
2003 |
2004 |
2005 |
2006 |
2007 |
2008 |
2009 |
2010 |
2011 |
2012 |
2013 |
2014 |
2015 |
2016 |
2017 |
2018 |
Source: BP’s Statistical Review of World Energy 2019
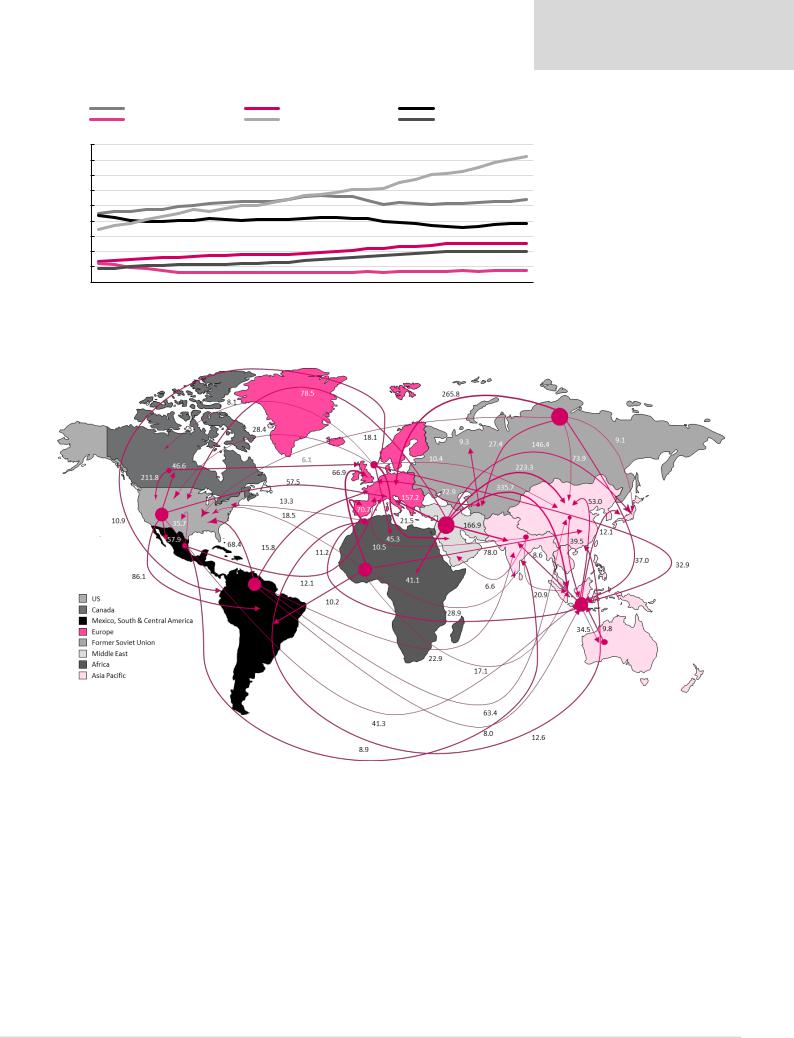
Figure 7: Worldwide trade flows of crude, mnt
Renaissance Capital
20 June 2019
Russian oil & gas
Source: BP’s Statistical Review of World Energy 2019, Renaissance Capital
11