


vk.com/id446425943
Complexity
According to the OGJ’s 2019 Worldwide Refining Survey, secondary processes (upgrading plus treating) represented 73% of primary distillation capacity in Russia in 2018, with cracking capacity (including coking) comprising 16% of primary distillation. On our estimates (which come from data published by the companies and general media releases), the ratios are higher: secondary processes represent 81%, with 29% allocated to upgrading.
Whichever data are considered, with regard to refinery complexity, Russia is still significantly behind international benchmarks. European and North American refineries typically have as much secondary processing as primary distillation capacity, which allows almost the entire barrel to be upgraded or converted into higher-quality products. Specifically, the US and global secondary processing ratios in 2018 stood at 161% and 98%, respectively, while their respective cracking ratios were 57% and 32%.
Figure 71: Russian refining in the global context – conversion capacities, kb/d (unless otherwise stated)
Renaissance Capital
20 June 2019
Russian oil & gas
Complexity continues to improve
|
|
Vaccum |
|
Thermal |
Catalytic |
Catalytic |
Catalytic |
Catalytic |
Nelson |
|
|
Secondary |
|
Crude |
Coking |
hydro- |
hydro- |
Complexity |
Upgrading |
Treating |
|||||
|
distillation |
operations |
cracking |
reforming |
processe |
|||||||
|
|
|
cracking |
treating |
Index |
|
|
|||||
|
|
|
|
|
|
|
|
|
|
|||
Russia |
6,451 |
2,754 |
287 |
550 |
537 |
651 |
495 |
2,696 |
6.2 |
29% |
52% |
81% |
US |
18,609 |
8,524 |
2,695 |
25 |
5,463 |
3,466 |
2,235 |
16,067 |
10.2 |
56% |
105% |
161% |
China |
10,388 |
886 |
546 |
- |
1,163 |
598 |
605 |
1,776 |
3.1 |
22% |
23% |
45% |
World |
91,864 |
29,720 |
5,451 |
3,186 |
14,797 |
11,636 |
7,019 |
47,716 |
6.5 |
33% |
65% |
98% |
Note: Upgrading defined as coking plus thermal operations plus catalytic cracking and hydrocracking divided by distillation capacity. Treating defined as catalytic reforming plus catalytic hydrotreating divided by distillation capacity.
Source: Renaissance Capital estimates, Oil&Gas Journal (2019 Worldwide refining survey)
Figure 71 displays a snapshot of Russia’s refining capacity, illustrating the upgrading ratio
(coking plus thermal operations plus catalytic cracking plus catalytic hydrocracking divided by distillation capacity) and the treating ratio (catalytic reforming plus catalytic hydrotreating divided by distillation capacity). We also add our estimates for the NCI, a common measure to identify the degree of sophistication of refinery facilities.
The principal secondary refining processes used in Russia are hydrotreating and catalytic reforming, which together account for 64% of secondary processing capacity, with hydrotreating alone accounting for 52%. These two processes are used to improve the quality of gasoline, jet and diesel fuel produced during primary distillation, but not to convert heavy fuels into light products.
Based on data in OGJ’s 2019 Worldwide Refining Survey, Russia’s average NCI is 5.4 While the survey gives out important statistics on conversion capacities and can serve as a benchmark for cross-country comparison, it does not include data on all of the refineries and fails to incorporate the results of the most recent upgrades. Therefore, our own estimate of Russia’s NCI is slightly higher, at 6.2 in 2018, showing an improvement vs 5.3 in 2013. When adjusted for gas condensate plants with distillation units, independent refineries without disclosed technological schemes and mini-refineries with no secondary capacities, NCI stands at 6.7 (vs 5.7 in 2013). In any case, NCI has moved closer to the global average (6.5) and is in line with it if we account for only the core capacities although it remains significantly below the benchmark of developed countries, such as the US (10.2).
64
vk.com/id446425943
Renaissance Capital 20 June 2019
Russian oil & gas
Figure 72: Average NCI, 2018 |
|
|
|
|
|
|
|
|
|
|
|
|
|
|
|
|
|
|||
|
0.0 |
2.0 |
|
4.0 |
6.0 |
|
8.0 |
10.0 |
12.0 |
|
||||||||||
|
|
NOVATEK |
|
|
|
|
|
|
|
|
|
|
|
|
|
|
|
|
|
|
|
|
|
1.0 |
|
|
|
|
|
|
|
|
|
|
|
|
|
|
|
|
|
|
|
Mariysky refinery |
|
|
1.6 |
|
|
|
|
|
|
|
|
|
|
|
|
|
|
|
|
Novoshakhtinsk refinery |
|
|
1.7 |
|
|
|
|
|
|
|
|
|
|
|
|
|
|
||
|
|
Krasnodar refinery |
|
|
|
2.9 |
|
|
|
|
|
|
|
|
|
|
|
|
|
|
|
|
Afipsk refinery |
|
|
|
|
|
3.9 |
|
|
|
|
|
|
|
|
|
|
|
|
|
|
Gazprom |
|
|
|
|
|
4.1 |
|
|
|
|
|
|
|
|
|
|
|
|
|
|
Antipinskiy |
|
|
|
|
|
4.6 |
|
|
|
|
|
|
|
|
|
|
|
|
|
|
Khabarovsk |
|
|
|
|
|
4.9 |
|
|
|
|
|
|
|
|
|
|
|
|
|
|
Orsk refinery |
|
|
|
|
|
|
|
6.4 |
|
|
|
|
|
|
|
|
|
|
TAIF (Nizhnekamsk refinery) |
|
|
|
|
|
|
|
6.5 |
|
|
|
|
|
|
|
|
|
|||
|
|
Surgutneftegas |
|
|
|
|
|
|
|
6.5 |
|
|
|
|
|
|
|
|
|
|
|
|
Rosneft |
|
|
|
|
|
|
|
6.6 |
|
|
|
|
|
|
|
|
|
|
|
|
Gazprom Neft |
|
|
|
|
|
|
|
|
|
7.2 |
|
|
|
|
|
|
|
|
|
|
LUKOIL |
|
|
|
|
|
|
|
|
|
7.4 |
|
|
|
|
|
|
|
|
|
|
Slavneft |
|
|
|
|
|
|
|
|
|
|
|
7.8 |
|
|
|
|
|
|
|
|
Tatneft |
|
|
|
|
|
|
|
|
|
|
|
|
|
|
9.9 |
|
|
|
|
|
Russia, average |
|
|
|
|
|
|
|
6.2 |
|
|
|
|
|
|
|
|
|
|
|
|
China average |
|
|
|
|
3.6 |
|
|
|
|
|
|
|
|
|
|
|
|
|
|
|
World average |
|
|
|
|
|
|
|
|
6.5 |
|
|
|
|
|
|
|
|
|
|
|
US average |
|
|
|
|
|
|
|
|
|
|
|
|
|
|
10.2 |
|
|
|
|
|
|
|
|
|
|
|
|
|
|
|
|
|
|
Source: Renaissance Capital |
|
||||
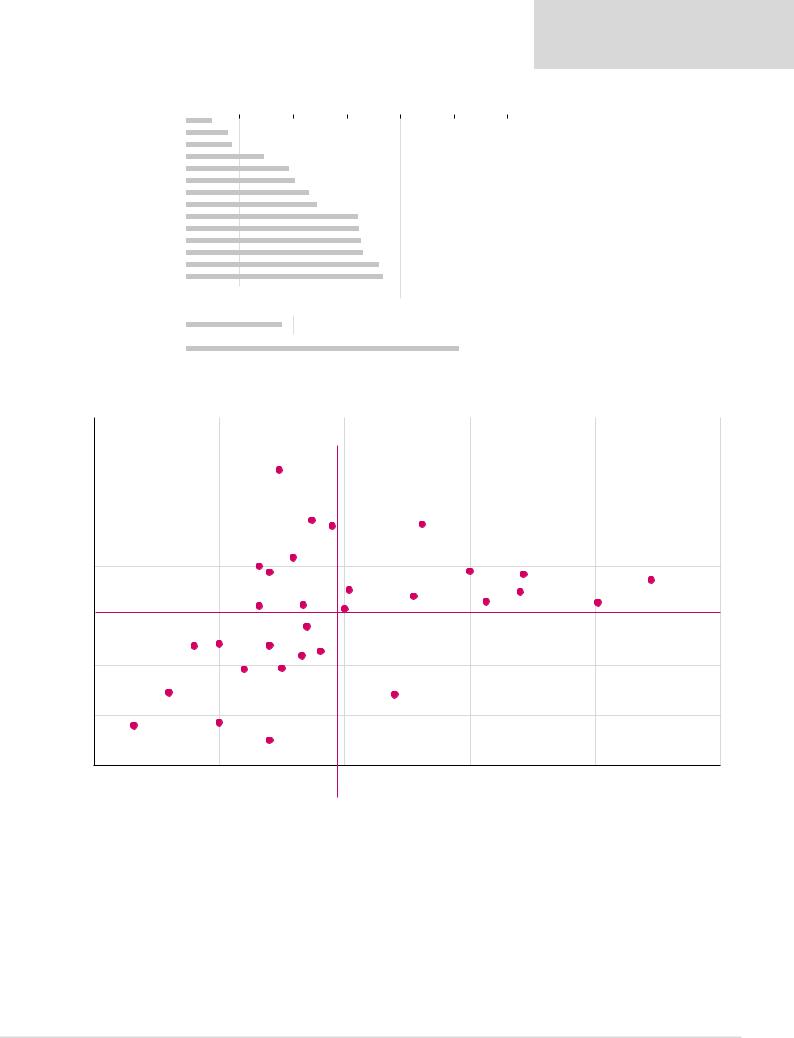
Figure 73: Russian refineries – capacity vs complexity |
|
|
|
|
|
|
|
|
|
|
|
|
|
|
||||||
|
14 |
|
|
|
|
|
|
|
|
|
|
|
|
|
|
|
|
|
|
|
|
|
|
|
|
|
|
Russian average capacity = 9.7 |
|
|
|
||||||||||
|
|
|
|
|
|
|
|
|
|
|
||||||||||
|
12 |
|
|
|
|
|
|
|
|
|
|
|
|
|
|
|
|
|
||
|
|
|
NOVOIL |
|
|
|
|
|
|
|
|
|
|
|
|
|
|
|||
|
|
|
|
|
|
|
TANECO |
|
|
|
|
|
Perm |
|
|
|
|
|
|
|
|
10 |
|
|
|
|
|
|
|
|
|
|
|
|
|
|
|
|
|
|
|
(NCI) |
|
|
|
|
|
|
Ufaneftekhim |
|
|
|
|
|
|
|||||||
|
|
|
|
|
|
|
|
|
|
|
|
|
||||||||
|
|
|
|
|
|
|
|
|
|
|
|
|
|
YaNOS |
|
|
|
|||
Index |
|
|
|
Ufa |
|
|
Novokuibyshev |
|
|
|
|
|
|
|||||||
8 |
|
|
|
|
|
|
|
|
|
|
|
Ryazan |
Omsk |
|||||||
Complexity |
|
|
|
|
|
|
|
|
|
|
|
|
|
|||||||
|
|
|
|
|
|
Kuibyshev |
|
Angarsk |
|
|
|
|
|
|
|
|
|
|||
|
|
|
|
|
|
|
|
|
|
|
Moscow |
|
|
|
|
|
|
|||
|
|
|
|
|
|
|
|
|
|
|
|
|
|
|
Volgograd |
Kirishi |
||||
|
|
|
|
|
|
|
|
|
|
|
|
|
|
|
|
|||||
|
|
|
|
|
Orsk |
Nizhnekamsk |
|
Salavat |
|
|
|
|
|
|||||||
|
|
|
|
|
|
|
|
|
|
|
|
|
NORSI |
|
||||||
|
|
|
|
|
|
|
|
|
|
|
|
|
|
|
|
|
|
|||
Nelson |
6 |
|
|
|
|
|
|
|
|
|
|
|
|
|
|
|
|
|
|
|
Ukhta |
Khabarovsk |
Saratov Syzran |
|
|
|
|
|
|
|
|
|
|
|
Russian average NCI = 6.2 |
||||||
|
|
|
|
|
|
|
|
|
|
|
|
|||||||||
|
|
|
|
|
|
|
|
|
|
|
|
|
|
|
|
|
|
|||
|
|
|
|
|
|
|
|
|
|
|
|
|
|
|
|
|
|
|
||
|
|
|
|
|
|
Komsololsk Antipinsk |
|
|
|
|
|
|
|
|
|
|
|
|
||
|
4 |
Krasnodar |
|
|
Afipsk |
Achinsk |
|
|
Tuapse |
|
|
|
|
|
|
|||||
|
|
|
|
|
|
|
|
|
|
|
|
|
||||||||
2 Mariysk
Novoshakhtinsk
Ust-Luga
0
0 |
5 |
10 |
15 |
20 |
25 |
Capacity (mntpa)
Note: Dotted lines denote the Russian average.
Source: Oil & Gas (2019 Refining Survey), company data, Interfax, Renaissance Capital
According to our research, as of 2019, the four following oil refineries stood out in terms of complexity: Rosneft/Bashneft’s Novoil (NCI of 11.9), Tatneft’s TANECO (NCI of 9.9), LUKOIL’s Perm (NCI of 9.7), and Rosneft’s//Bashneft’s Ufaneftekhim (NCI of 9.6).
Fourteen more refineries had an NCI above the estimated Russian average as of YE19:
Rosneft’s Novokuibyshevsk (NCI of 8.4); Rosneft/Bashneft’s Ufa (NCI of 8.0); Slavneft’s
YaNOS (NCI of 7.8), Rosneft’s Kuibyshev (NCI of 7.8), Rosneft’s Ryazan' (NCI of 7.7),
Gazprom Neft’s Omsk (NCI of 7.5), Rosneft’s Angarsk (NCI of 7.1), LUKOIL’s Norsi (NCI of
65

vk.com/id446425943
Renaissance Capital 20 June 2019
Russian oil & gas
7.0), Gazprom Neft’s Moscow (NCI of 6.8), LUKOIL’s Volgograd (NCI of 6.6),
Surgutneftegas’ Kirishi (NCI of 6.5), TAIF’s Nizhnekamsk (NCI of 6.5), Forteinvest’s Orsk
(NCI of 6.4) and Gazprom’s Salavat (NCI of 6.3).
We identify that six refineries had NCIs of 4.0-6.0 in 2019 (below Russia’s average): Rosneft’s Syzran' (NCI of 5.6), NNK’s Khabarovsk (NCI of 4.9), Rosneft’s Saratov (NCI of 4.8), LUKOIL’s Ukhta (NCI of 4.8), SOCAR’s Antipinsk (NCI of 4.6), Rosneft’s Komsomolsk
(NCI of 4.4).
The least sophisticated refineries are Rosneft’s Achinsk (NCI of 3.9), Afipsk (NCI of 3.9), and Tuapse (NCI of 2.8) and independent Krasnodar (NCI of 2.9), Novoshakhtinsk (NCI of 1.7) and Mariyskiy (NCI of 1.6). NOVATEK’s Ust-Luga Complex consists of a distillation unit with no secondary refining capacities and thus its NCI stands at 1.
We note that there is no information available on the configuration of the Yaisky, Ilsky, Nizhnevartosk, Slavyansk, build-in distillation units and mini-refineries. Adjusted for their distillation capacities, Russian NCI is increased up to 6.5.
In terms of capacity-weighted complexity, Tatneft currently leads Russian VICs with an overall NCI of 9.9 (we believe this may normalise down following the upcoming launch of an additional 7mn tpa of distillation capacity). Slavneft is in second place with an NCI of 7.8, followed closely by LUKOIL with the average NCI of 7.4 and Gazprom Neft with the average NCI of 7.2. Rosneft had a consolidated NCI of 6.6 in 2019, with the core assets
NCI of 5.8 offset by Bashneft’s 9.9. While NOVATEK’s NCI stands at 1, we note that the low complexity of the refining unit is compensated with the integral configuration of the UstLuga Complex, which allows it to process a stable gas condensate as a primary feedstock.
Surgutneftegas stands at an average NCI of 6.5 with its single refinery, Kirishi. Gazprom’s NCI of 4.1 is based solely on its Salavat plant and is negatively affected by additional distillation capacities from gas stabilisation plants.
66