


vk.com/id446425943
Domestic gas pricing
Dual-structure to Gazprom’s disadvantage
Domestic wholesale gas prices are regulated only for Gazprom and other owners of regional gas transportation networks, as well as their affiliates. This applies only to volumes fixed in 2007 contracts; any additional gas volumes produced by Gazprom are subject to free pricing (although within a rather wide band established by the government, see Figure 127). Because 2007 represented a historically high year in Russian domestic gas consumption (pipeline deliveries were 356bcm in 2007, not too different vs 365bcm in 2018, 11 years later), Gazprom continues to sell the majority of its domestic volumes at regulated prices.
The current regulatory framework then operates as follows:
▪For all intents and purposes, wholesale prices for volumes supplied by Gazprom and its affiliates are regulated.
▪Wholesale prices for so-called independent gas producers (i.e., those not affiliated with Gazprom) are not regulated, having been excluded from the list of regulated tariffs by the Russian government Decree No. 865 dated 30 July 1998.
The legal foundations for the regulation of wholesale gas prices are essentially the same as those for the regulation of the gas transportation tariff for third parties (discussed in more detail on pages 141-142). Article 21 of the Federal Law On gas supply, dated 31 March 1999, allows the Russian government to substitute regulation of the gas transportation tariff with regulation of the wholesale price. The government took advantage of this clause in government Decree No. 1021, On state regulation of gas prices and gas transportation tariffs on the territory of Russian Federation, dated 29
December 2000, by introducing the “temporary” regulation of wholesale gas prices. The decree anticipated a two-stage transition from the regulation of wholesale prices to the regulation of gas transportation tariffs: 1) the current stage, when the transportation tariff is regulated only for third parties; and 2) a second stage, when end-user tariffs are deregulated (meaning there will not be a fixed regulated tariff, but rather the end-user gas price will be determined by a “regulated” formula), and the Federal Tariff Service (FTS) starts regulating gas transportation tariffs for all delivered volumes. While the government confirmed on 28 May 2007 that the second stage should have started on 1 January 2011, it has been postponed – first until 1 January 2015 (Decree No. 1205, dated 31 December 2010) and then until 1 January 2018 (Decree No. 342, dated 15 April 2014), and then this deadline was removed altogether (Government Decree No. 941, dated 4 September 2015).
The government resumed its gas liberalisation agenda in 2018 with the passage of the roadmap towards an introduction of greater degree of competitiveness in certain sectors of Russian economy (Decree No 1697-p dated 16 August 2018). Specifically, this document prescribed the Ministry of Energy, the Ministry of Economic Development and FAS to introduce new gas liberalisation proposals by 1 October 2018. As of the date of this report, we are not aware that any of these proposals have been submitted.
Decree No. 1021 also prescribed that the regulator should develop methodologies for calculating transmission, distribution and supply tariffs, as well as retail tariffs for households. All these methodologies have already been developed and approved: for gas distribution in 2001, for supply services in 2002, for household retail tariffs in 2004 (this was replaced in 2011) and for gas transmission in 2005.
However, the FTS has no separate methodology for the regulation of wholesale gas prices. Historically (until the 2007 tariff-setting season), it followed the growth rates calculated in the annual forecast of macroeconomic parameters for the forthcoming year by the Ministry of Economic Development and Trade (and approved by the government
Renaissance Capital
20 June 2019
Russian oil & gas
Gas prices are regulated only for Gazprom and its affiliates
118

vk.com/id446425943
Renaissance Capital 20 June 2019
Russian oil & gas
each year). These were based on a combination of Gazprom’s own cost forecasts, the government’s current macroeconomic agenda, and intense lobbying by various interested parties. Since 2008, the FTS has followed the tariff growth rates for 2007-2010 approved by the Russian government on 30 November 2006. As a result, Gazprom’s tariff regulation has effectively moved from a cost-plus to a tariff indexation. However, the government has shown little consistency in its tariff decisions since, so that tariff indexation regulation has not provided the certainty needed for Gazprom to engage in active cost optimisation.
Before 2008, the FTS set tariffs by zone, which combined regions with approximately similar transportation costs from the key gas producing areas. In 2008, zonal pricing was replaced by regional pricing, although all regions formerly part of the same zone were awarded the same tariff; hence the change was more cosmetic than structural. After 2009 almost all regional tariffs became different, fully eliminating the effect of geographical cross-subsidisation.
In 2000, two gas price increases were implemented. In February, average rises of 11% and 21% took effect for residential and industrial consumers, respectively. A further increase was approved, effective in May, allowing rises of 16% in residential tariffs and 27% for industrial consumers. In March 2001, discounted residential tariffs and FOREM wholesale discounts were discontinued. This change was introduced alongside further tariff increases of 24% for residential and 18% for industrial consumers. In 2002, a 20% tariff increase was granted, and became effective 15 February 2002. An increase of 15% was granted with effect from July and August 2002 for industrial and residential customers, respectively. The Federal Energy Commission (FEK) approved an increase of 20% in the tariffs charged to industry, with effect from January 2003. Residential tariffs were allowed to rise by a somewhat steeper 23.4%. In 2004, the government granted a 20% tariff hike, with effect from 1 January. With effect from 1 January 2005, the government granted a further 23% average tariff increase. This was 3% higher than previously indicated as met rates were increased to compensate for the abolition of VAT on CIS exports. The tariff changes, in effect, meant a rise in industrial prices of 21.7%, and in household tariffs of 36%, due to two stages of tariff adjustment. Gazprom was subsequently awarded an average tariff hike of 11% with effect from 1 January 2006. Industrial tariffs rose by 10.5% on average, while residential ones climbed by 13.8%. Both industrial and residential tariffs rose by a further 15% from 1 January 2007, and another 25% from 1 January 2008.
In November 2006, the Russian government approved a programme (confirmed by its subsequent Decree No. 333 on 28 May 2007) that should have gradually increased domestic gas prices towards market levels (i.e. netback parity with European prices) by 2011. The programme envisaged tariff hikes of 13% from 1 January 2009, 13% from 1 July 2009, 13% from 1 January 2010 and 12% from 1 July 2010.
In light of the economic and financial crisis, on 16 December 2008 the government decided to amend 2009 tariff growth rates (officially published on 29 December 2008): while the exit tariff for 2009 did not change, growth over the year was smoothed through four tariff increases (5% in 1Q, 7% in each of 2Q and 3Q, and 6.2% in 4Q), bringing the average growth rate for the year to 16.3%, but not changing any earlier decisions for 2010. More significantly, in July 2009 the government decided to reduce the pace of gas tariff growth to just 15% on 1 January 2010, as well as on the first day of the year in 2011 and in 2012 (corresponding with average growth rates of 26.3% in 2010, 15% in 2011, and 15% in 2012). It also delayed the promised liberalisation of the domestic gas market for an unspecified period (which turned out to be until 1 January 2015, according to the government’s 31 December 2010 decision). Although this spurred some negative newsflow, the decision simply solidified our view that the promised gas price liberalisation was unlikely in the foreseeable future.
After a string of tariff hikes…
…deregulation was promised, but never happened
119
vk.com/id446425943
Renaissance Capital 20 June 2019
Russian oil & gas
The 2010 tariff growth rates were reconfirmed by the FTS on 18 December 2009 (a 15% increase in the average industrial gas tariff on 1 January 2010; and two separate increases for households: a 5% hike on 1 January 2010 and another 15% increase on 1 April 2010).
The 2011 tariff growth rates were reconfirmed by the FTS on 29 November 2010 and 10 December 2009 (a 15% increase in the average industrial gas tariff on 1 January 2011; and two separate increases for households: a 5% hike on 1 January 2011, and another 9.5% increase on 1 April 2011).
On 9 December 2011, the FTS approved a 15% increase in household tariffs from 1 July 2012. A similar increase for industrial gas tariffs was approved by the FTS on 4 May 2012.
In April 2012, the government also approved tariff growth rates of 15% for of 2013 and 2014, while the 2015 target was set at 14.6-15%. These targets meant that the domestic gas price (for industrial customers – representing around 80% of demand) would reach around $144/mcm by 2015, above our estimated fair level for domestic gas prices (based on our estimates of marginal production costs and fuel parity). It was, therefore, not a surprise to us that in June 2013 President Vladimir Putin announced a decision to freeze gas tariffs for industrial users in real terms for a period of five years. In September 2013, the government decided to freeze tariff growth for Russian natural monopolies, including Gazprom, for 2014 to control inflation. Tariff growth from 1 July 2015 was 7.5%, which was equal to the inflation forecast for 2014 made by the Ministry of Economic Development and Trade (the actual number was 11.4%). At the time, tariff growth in 2016 was planned at 8.5%, but the FAS (which succeeded the FTS) proposed freezing industrial tariff growth (the decision was approved).
In 2013, the deregulation agenda was replaced with a five-year real tariff freeze
On 20 January 2017, the FAS confirmed a 3.9% tariff increase starting from 1 July 2017 for households, while a similar increase for industrial users was agreed on 22 June 2017. 2018 saw an increase of 3.4%, although wholesale gas prices (used for household supplies) were raised from 1 July 2018, while those supplied to industrial users were increased by the same amount on a later date (from 21 August 2018). According to the current proposal by FAS, wholesale prices for both household and industrial users will grow by 1.4% from 1 July 2019, which is in line with the Forecast of Russia’s Socioeconomic Development until 2024 drafted by the Ministry of Economic Development and Trade and approved by the government in October 2018. This document further assumes annual gas tariff increases for both household and industrial users of under 3% during 2020-2024. This schedule in effect represents an ‘inflation minus’ approach as the official inflation target is 4%.
We believe Gazprom’s regulated tariff achieved the economically justified level in 2013
(the average for the year was RUB3,268/mcm or $103/mcm at the then prevailing exchange rate) and should have been liberalised then. While we think the actual market price for gas may have declined as a result of such liberalisation (because of growing competition from independent gas producers), to the benefit of the Russian economy, the government has insisted on maintaining the regulation of Gazprom’s end-user tariffs, with no obvious end to this process in sight. Gazprom’s tariffs are set to increase only at meagre rates, as stated above, but the company’s inability (by law) to offer discounts allows independent gas producers to undercut Gazprom’s regulated tariff and cherry-pick the best and most profitable customers by offering them a discount to the regulated price. Unregulated gas producers started undercutting Gazprom’s tariffs from 2009, and we believe the average discount today remains between 5% and10%. On top of showing a greater level of operational efficiencies, non-Gazprom producers in addition benefit from a much lower gas MET rate, with an average discount of 46% in 2018, on our estimates, and an inherently lower cost base: they do not have the same public service obligations or investment commitments as Gazprom. Neither, in our view, do they properly reimburse
Gazprom for the economic costs of transporting their gas via Gazprom’s pipelines.
Current regulation is de facto tariff indexation
120

vk.com/id446425943
Renaissance Capital 20 June 2019
Russian oil & gas
Figure 123: Gas prices for industrial users, $/mcm
|
2004 |
2005 |
2006 |
2007 |
2008 |
2009 |
2010 |
2011 |
2012 |
2013 |
2014 |
2015 |
2016 |
2017 |
2018 |
|||
Austria |
241 |
258 |
345 |
411 |
|
na |
na |
na |
|
na |
483 |
485 |
472 |
355 |
311 |
316 |
323 |
|
Belgium |
228 |
221 |
292 |
318 |
428 |
383 |
339 |
421 |
457 |
536 |
421 |
321 |
277 |
259 |
263 |
|||
Bulgaria |
na |
na |
186 |
241 |
272 |
383 |
296 |
385 |
500 |
495 |
475 |
361 |
254 |
245 |
304 |
|||
Croatia |
na |
na |
na |
303 |
290 |
307 |
420 |
543 |
590 |
635 |
571 |
447 |
374 |
285 |
309 |
|||
Czech Republic |
182 |
215 |
304 |
303 |
407 |
394 |
366 |
404 |
447 |
450 |
423 |
332 |
291 |
267 |
301 |
|||
Denmark |
199 |
252 |
255 |
266 |
|
na |
324 |
296 |
456 |
493 |
480 |
379 |
327 |
232 |
280 |
339 |
||
Estonia |
na |
116 |
118 |
170 |
323 |
320 |
333 |
353 |
489 |
497 |
472 |
396 |
249 |
281 |
318 |
|||
France |
223 |
261 |
334 |
352 |
431 |
428 |
398 |
476 |
524 |
552 |
519 |
400 |
330 |
327 |
345 |
|||
Germany |
276 |
326 |
434 |
560 |
537 |
476 |
399 |
560 |
600 |
608 |
568 |
412 |
346 |
327 |
342 |
|||
Hungary |
234 |
244 |
329 |
437 |
447 |
440 |
385 |
399 |
685 |
548 |
535 |
406 |
347 |
281 |
279 |
|||
Ireland |
na |
na |
na |
na |
526 |
408 |
341 |
|
na |
486 |
541 |
523 |
421 |
334 |
352 |
377 |
||
Italy |
242 |
256 |
291 |
390 |
418 |
446 |
346 |
398 |
527 |
527 |
480 |
381 |
334 |
292 |
325 |
|||
Latvia |
na |
na |
168 |
244 |
376 |
476 |
318 |
392 |
495 |
497 |
463 |
383 |
290 |
301 |
353 |
|||
Lithuania |
na |
151 |
184 |
278 |
418 |
383 |
396 |
471 |
622 |
612 |
576 |
326 |
311 |
285 |
355 |
|||
Luxembourg |
257 |
292 |
373 |
454 |
497 |
486 |
450 |
560 |
697 |
703 |
587 |
448 |
396 |
376 |
389 |
|||
Netherlands |
na |
na |
337 |
387 |
387 |
396 |
325 |
362 |
398 |
420 |
406 |
317 |
262 |
250 |
271 |
|||
Poland |
184 |
223 |
280 |
348 |
398 |
339 |
373 |
440 |
466 |
504 |
515 |
428 |
307 |
315 |
367 |
|||
Portugal |
246 |
253 |
316 |
358 |
414 |
430 |
339 |
453 |
553 |
573 |
582 |
477 |
385 |
319 |
329 |
|||
Romania |
na |
154 |
258 |
338 |
297 |
224 |
183 |
204 |
263 |
288 |
296 |
240 |
224 |
302 |
319 |
|||
Russia |
30 |
38 |
41 |
53 |
68 |
61 |
81 |
88 |
92 |
111 |
98 |
65 |
62 |
72 |
69 |
|||
Slovakia |
na |
na |
317 |
369 |
425 |
488 |
388 |
446 |
528 |
494 |
496 |
388 |
338 |
317 |
341 |
|||
Slovenia |
173 |
214 |
297 |
338 |
444 |
497 |
483 |
541 |
737 |
620 |
533 |
373 |
341 |
305 |
338 |
|||
Spain |
190 |
197 |
300 |
326 |
364 |
383 |
342 |
391 |
500 |
533 |
512 |
400 |
319 |
315 |
352 |
|||
Sweden |
277 |
339 |
462 |
510 |
595 |
408 |
458 |
566 |
621 |
640 |
570 |
419 |
331 |
386 |
491 |
|||
UK |
219 |
292 |
391 |
487 |
347 |
350 |
250 |
313 |
411 |
468 |
493 |
394 |
319 |
279 |
306 |
|||
US |
237 |
249 |
383 |
269 |
338 |
181 |
195 |
178 |
154 |
166 |
201 |
140 |
125 |
146 |
150 |
|||
|
|
|
|
|
|
|
|
|
|
|
|
|
|
|
|
Source: Eurostat, IEA, EIA, Gazprom |
||
Figure 124: Gas prices for households, $/mcm |
|
|
|
|
|
|
|
|
|
|
|
|
|
|
|
|||
|
2004 |
2005 |
2006 |
2007 |
2008 |
2009 |
2010 |
2011 |
2012 |
2013 |
2014 |
2015 |
2016 |
2017 |
2018 |
|||
Austria |
395 |
374 |
444 |
506 |
|
566 |
576 |
557 |
|
687 |
777 |
793 |
770 |
626 |
|
586 |
606 |
603 |
Belgium |
363 |
372 |
445 |
476 |
619 |
594 |
522 |
680 |
757 |
727 |
713 |
555 |
481 |
487 |
522 |
|||
Bulgaria |
na |
na |
266 |
340 |
|
390 |
480 |
378 |
|
481 |
570 |
594 |
568 |
462 |
|
355 |
325 |
390 |
Croatia |
na |
na |
na |
296 |
281 |
319 |
384 |
410 |
427 |
517 |
516 |
439 |
397 |
339 |
363 |
|||
Czech Republic |
233 |
264 |
349 |
366 |
|
488 |
507 |
483 |
|
609 |
760 |
736 |
630 |
551 |
|
558 |
536 |
587 |
Denmark |
365 |
528 |
546 |
629 |
|
na |
544 |
649 |
796 |
752 |
613 |
507 |
482 |
399 |
469 |
473 |
||
Estonia |
na |
165 |
163 |
230 |
|
352 |
394 |
343 |
|
438 |
544 |
572 |
537 |
416 |
|
304 |
366 |
354 |
France |
374 |
378 |
448 |
527 |
585 |
571 |
544 |
649 |
732 |
785 |
808 |
651 |
582 |
565 |
595 |
|||
Germany |
393 |
427 |
507 |
644 |
|
634 |
591 |
513 |
|
584 |
659 |
689 |
710 |
591 |
|
575 |
536 |
558 |
Hungary |
179 |
186 |
190 |
275 |
446 |
489 |
575 |
602 |
608 |
473 |
400 |
323 |
314 |
327 |
348 |
|||
Ireland |
343 |
370 |
456 |
680 |
|
633 |
691 |
536 |
|
565 |
710 |
757 |
782 |
645 |
|
623 |
614 |
642 |
Italy |
384 |
377 |
432 |
544 |
573 |
622 |
464 |
592 |
707 |
784 |
740 |
585 |
549 |
530 |
567 |
|||
Latvia |
na |
na |
188 |
293 |
|
394 |
579 |
352 |
|
463 |
558 |
557 |
533 |
456 |
|
386 |
349 |
372 |
Lithuania |
na |
na |
219 |
275 |
369 |
438 |
383 |
482 |
583 |
692 |
643 |
406 |
395 |
356 |
352 |
|||
Luxembourg |
288 |
322 |
403 |
501 |
|
671 |
535 |
471 |
|
615 |
715 |
784 |
665 |
505 |
|
455 |
444 |
456 |
Netherlands |
353 |
405 |
459 |
567 |
572 |
633 |
497 |
559 |
644 |
640 |
631 |
490 |
434 |
420 |
467 |
|||
Poland |
225 |
260 |
321 |
404 |
|
451 |
388 |
430 |
|
506 |
527 |
531 |
553 |
473 |
|
369 |
399 |
424 |
Portugal |
496 |
493 |
573 |
610 |
787 |
688 |
698 |
761 |
814 |
913 |
992 |
875 |
808 |
668 |
700 |
|||
Romania |
na |
na |
na |
351 |
|
283 |
232 |
186 |
|
200 |
196 |
211 |
222 |
174 |
|
203 |
300 |
333 |
Russia |
20 |
27 |
31 |
40 |
52 |
47 |
65 |
76 |
87 |
72 |
79 |
54 |
51 |
60 |
58 |
|||
Slovakia |
na |
na |
378 |
445 |
|
457 |
473 |
452 |
|
521 |
594 |
577 |
588 |
480 |
|
444 |
414 |
440 |
Slovenia |
313 |
328 |
415 |
496 |
578 |
633 |
558 |
688 |
858 |
708 |
693 |
525 |
494 |
456 |
471 |
|||
Spain |
430 |
431 |
487 |
566 |
|
656 |
642 |
568 |
|
610 |
793 |
809 |
832 |
675 |
|
621 |
623 |
650 |
Sweden |
433 |
492 |
613 |
696 |
703 |
614 |
731 |
885 |
886 |
933 |
906 |
710 |
706 |
805 |
797 |
|||
UK |
304 |
347 |
344 |
357 |
|
419 |
551 |
477 |
|
543 |
688 |
702 |
794 |
687 |
|
596 |
515 |
522 |
US |
343 |
385 |
527 |
501 |
545 |
454 |
467 |
356 |
325 |
369 |
392 |
371 |
359 |
390 |
376 |
|||
Source: Eurostat, IEA, EIA, Gazprom
121

vk.com/id446425943
Spot gas trading
Gas trading at unregulated prices began in Russia in 1998, when the government excluded gas sales by independent producers from the list of regulated tariffs (Russian Government Decree No. 865, dated 30 July 1998).
In 2002, two electronic gas-trading systems were created – the first established by Gazprom (on the basis of its 100% subsidiary, Mezhregiongaz); the second by independent gas producers (including Itera, NOVATEK and Centrrusgas). On the back of the widely expected approval of a concept for gas-industry liberalisation, both trading systems were aimed at creating a market price signal for both gas producers and consumers.
However, this objective has never been realised, as Gazprom – providing about 80% of internal gas supplies – was not allowed to sell its production at unregulated prices until late 2006, despite strong lobbying on its part. At last, in September 2006 the government signed a decree introducing the so-called 5+5 exchange-trading scheme, which over 2006-2007, on an experimental basis, allowed Gazprom to sell up to 5bcm of gas (the same limit was set for the total exchange gas sales by independent producers) at unregulated prices via an electronic exchange.
Mezhregiongaz started trading unregulated gas under the experimental scheme in November 2006. In 2006-2007, Gazprom sold 4.4bcm of gas through the electronic exchange – 37% more than independent gas producers (2.8bcm), thereby breaking the volume parity requirement. When the experiment was extended into 2008, the parity requirement was replaced by Gazprom’s being prohibited from exceeding the independent producers’ trading volumes by more than 15%. Two other important amendments were also introduced. First, the scale of the experiment was increased, with Gazprom allowed to sell up to 7.5bcm of gas in 2008. Second, the gas supplies of Gazprom’s JVs with independent gas producers were excluded from Gazprom’s quota, proportional to the independent gas producers’ share in the joint venture. This allowed
Gazprom to effectively increase its unregulated gas trading quota, although officially reducing its average share in electronic trading volumes from 61% in 2006-2007 to 50% in 2008. In 2008, Gazprom sold 3.1bcm of gas through the electronic trading system, in line with the 2.98bcm supplied by independent producers.
The trading sessions were scheduled on a monthly basis for the first three months of the experiment and every 10 days thereafter. In June 2008, day-ahead trading started, and about 200mmcm of gas was sold under this trading regime. The average volume-weighted price exceeded the FTS tariff by 38% in both 2006-2007 and 2008, although the seasonality effect was relatively high: the unregulated price premium to the regulated levels widened to 44% (on average) in winter, and shrank to 33% (on average) in summer.
By December 2007, the government had instructed the Ministry of Industry and Energy, the Ministry of Economic Development and Trade and the FAS to prepare proposals for undertaking regular electronic gas trading by September 2008. However, no document has been issued, and electronic gas trading stopped in December 2008 pending a decision from the government. According to a Kommersant article at a time, the key reason for the delay was the FAS’s requirement to allow consumers that buy gas from
Gazprom under regulated long-term contracts to sell gas surpluses through the electronic trading system at free prices. This requirement was strongly opposed by Gazprom, as, given the demand contraction in crisis times, these volumes could flood the market and further depress prices. In the absence of any agreement, work on the document stalled. In subsequent months, the Ministry of Energy proposed a number of amendments to the trading rules, none of which were accepted by the government. President Medvedev’s order to have the spot trading rules in place by 1 June 2011 was not executed.
Renaissance Capital
20 June 2019
Russian oil & gas
The impact of spot trading on the Russian gas market should not be overestimated
122
vk.com/id446425943
Renaissance Capital 20 June 2019
Russian oil & gas
Finally, on 16 April 2012, then Prime Minister Putin signed a decree approving the reintroduction of spot trading in natural gas. The government decided that spot gas should be traded on an exchange, as opposed to an electronic trading platform. This was the option lobbied for by the FAS, as it would have no legal oversight rights over an electronic platform, and, in addition, it believed that exchange-traded contracts would result in better liquidity and more efficient pricing signals. According to the new rules, Gazprom was allowed to sell up to 15bcm of gas on such an exchange in 2012 and up to 17.5bcm in 2013, although it was stipulated that its volumes in each year should not exceed the total volume sold by non-Gazprom producers.
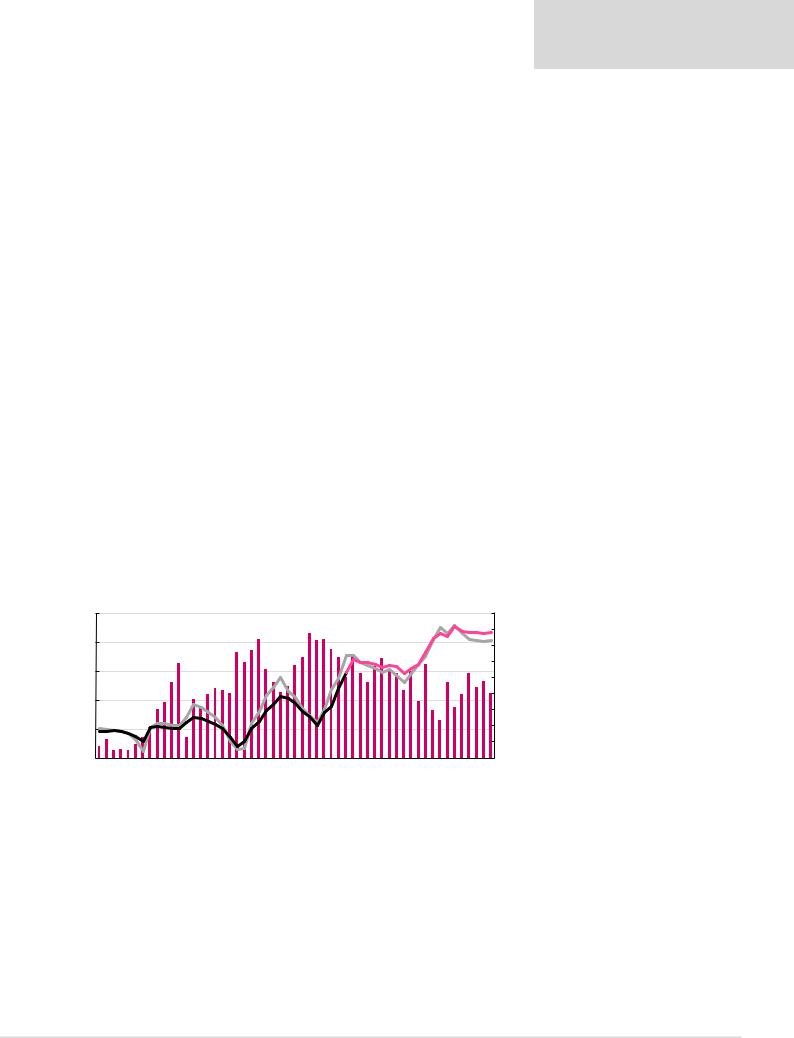
It took two more years for spot trading to restart when, in October 2014, gas trading was launched at the St Petersburg International Mercantile Exchange (SPIMEX). The trading volumes increased consistently during the first three years of trading, reaching the record level of 20.3bcm in 2017 (up from 16.8bcm in 2016, 7.65bcm in 2015 and just 0.53bcm in 2014). In 2018 total volume of gas traded slumped 26% to just 15.1bcm, which we associate with the lack of spare gas among the independent gas producers (mainly NOVATEK and Rosneft) and strong gas prices at European market, which redirected Gazprom’s sales to Europe. In 2019, SPIMEX volumes continued to demonstrate a negative dynamic, down 16% YoY in 5M19. The exchange trading volumes represent just below 2% of Russia’s total gas output today. During 2014-2017 we observed an encouraging trend that the exchange results did appear to send adequate volume and price signals throughout the seasons, although this effect was muted in 2018-2019 (Figure 125). We note that the 2018 average Nadym price of RUB2,725/mcm is 17% above our estimate of Gazprom’s domestic netback to the wellhead last year. While the official parity rule for Gazprom and non-Gazprom volumes is still in place, it is not being enforced by the FAS in an attempt to promote greater liquidity, with 89% of total 2018 SPIMEX gas sales attributed to Gazprom. According to press reports, the government plans to abolish the parity rule soon, simultaneously increasing Gazprom’s annual supply limit up to 25bcm.
Figure 125: SPIMEX natural gas trading volumes and prices (rhs, ex. VAT)
|
|
Trading volumes, mmcm |
|
Nadym price, RUB/mcm |
|
|
|||
|
|
Vyngapur price, RUB/mcm |
|
Lokosovo price, RUB/mcm |
|
|
|
2,500 |
|
|
|
|
|
|
|
|
|
|
|
|
|
|
|
|
|
|
|
|
|
|
|
|
|
|
3,000 |
|
|
|
|
|
|
|
|
|
|
|
|
|
|
|
|
|
|
|
|
|
|
|
|
|
|
|
2,900 |
2,000 |
|
|
|
|
|
|
|
|
|
|
|
|
|
|
|
|
|
|
|
|
|
|
|
|
|
|
2,800 |
|
|
|
|
|
|
|
|
|
|
|
|
|
|
|
|
|
|
|
|
|
|
|
|
|
|
|
|
1,500 |
|
|
|
|
|
|
|
|
|
|
|
|
|
|
|
|
|
|
|
|
|
|
|
|
|
|
2,700 |
|
|
|
|
|
|
|
|
|
|
|
|
|
|
|
|
|
|
|
|
|
|
|
|
|
|
2,600 |
|
|
|
|
|
|
|
|
|
|
|
|
|
|
|
|
|
|
|
|
|
|
|
|
|
|
|
|
|
1,000 |
|
|
|
|
|
|
|
|
|
|
|
|
|
|
|
|
|
|
|
|
|
|
|
|
|
|
2,500 |
|
|
|
|
|
|
|
|
|
|
|
|
|
|
|
|
|
|
|
|
|
|
|
|
|
|
2,400 |
|
|
|
|
|
|
|
|
|
|
|
|
|
|
|
|
|
|
|
|
|
|
|
|
|
|
|
|
|
500 |
|
|
|
|
|
|
|
|
|
|
|
|
|
|
|
|
|
|
|
|
|
|
|
|
|
|
2,300 |
|
|
|
|
|
|
|
|
|
|
|
|
|
|
|
|
|
|
|
|
|
|
|
|
|
|
|
|
|
|
|
|
|
|
|
|
|
|
|
|
|
|
|
|
|
|
|
|
|
|
|
|
|
|
|
2,200 |
- |
Jan15 |
Mar15 |
|
|
|
|
Jan16 |
Mar16 |
|
|
|
|
Jan17 |
Mar17 |
|
|
|
|
Jan18 |
Mar18 |
|
|
|
|
Jan19 |
Mar19 |
2,100 |
Nov14 |
May15 |
Jul15 |
Sep15 |
Nov15 |
May16 |
Jul16 |
Sep16 |
Nov16 |
May17 |
Jul17 |
Sep17 |
Nov17 |
May18 |
Jul18 |
Sep18 |
Nov18 |
May19 |
Source: SPIMEX
Following a solid start on SPIMEX, in 2018 the trade volumes has contracted on the back of the limited domestic supply
123