

vk.com/id446425943
Well productivity
Renaissance Capital
20 June 2019
Russian oil & gas
Well flow rates
We estimate that the average daily well flow rate for Russian VICs in 2018 was 64.1 b/d, down by 1.4% YoY compared with the previous year’s increase of 0.7%, which followed six consecutive years of declines (2016 – 1.0%, 2015 – 1.2%, 2014 – 2.0%, 2013 – 0.9%, 2012 – 0.8%, 2011 – 0.8%). The trend of declining flow rates started in 2006 after a period of sizeable gains (8.9% in 2004, 14.3% in 2003 and 8.6% in 2002), which has been characterised as the ‘brownfield miracle’.
Reporting inconsistencies make YoY comparisons on an individual company basis difficult. We use year-end producing well stock reported by Interfax, and adjust as necessary, although we are cautious about the accuracy of the detailed findings.
Gazprom Neft and Tatneft showed above average production rate decreases of 10.4% and 10.8%, respectively, in 2018. We associate the YoY reduction in Gazprom Neft’s productivity with the reduced flow rates at its Novoportovskoye field, while Tatneft’s dynamics can be attributed to the growing share of high viscous output, as well as the knock-on effect from a more aggressive production approach seen over 2016-2017. Other oil companies displayed mixed dynamics. Slavneft delivered the largest loss in productivity, losing 7.2%, followed by Bashneft and Surgutneftegaz, which decreased their estimated flow rates by 3.7% and 2.7% respectively, due to the continued productivity decline at its worked-out West Siberia fields. Russneft, LUKOIL and Rosneft demonstrated positive growth of 5.4%, 2.8% and 1.5%, respectively, in 2018.
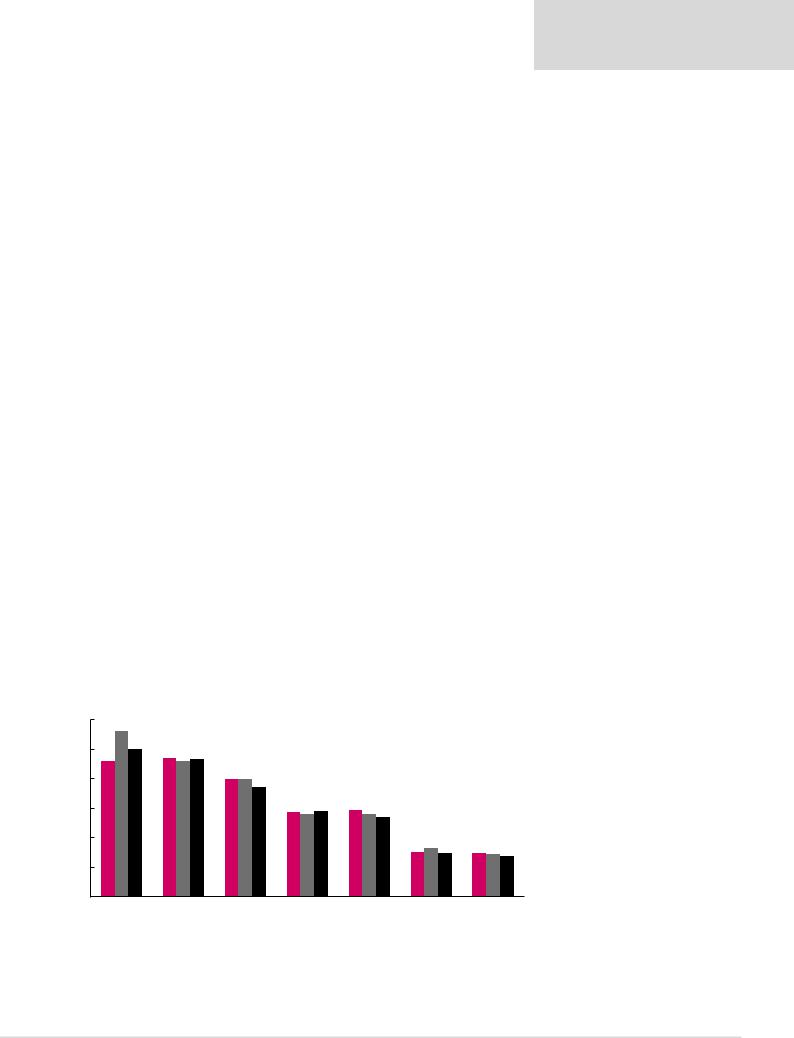
In absolute terms, Gazprom Neft (100 b/d) had the highest average well flow rates in 2018. Rosneft had the second-highest average rate (93 b/d). Slavneft was in third place (74 b/d), followed by Russneft (68 b/d). LUKOIL and Surgutneftegas share the fifth and sixth place with 58 b/d and 54 b/d, respectively. Finally, the producers in the mature Volga-Urals basin
– Tatneft (29 b/d) and Bashneft (28 b/d) – were a distant seventh and eight, respectively, among VICs. The 2016 trend, which saw tangible improvements in the flow rates of new wells even for some of the oldest Russian oil fields, reaping the benefits of significant improvements in technology, mostly stalled in 2017-2018 due to the oil companies having no further inventive to increase the production on its brownfields due to the OPEC+ restrictions. Nevertheless, some improvements can still be seen, such as average new flow rates for the Yuganskneftegas’ Priobskoye field (operated by Rosneft), which improved to 273 b/d in 2017 (from 247 b/d in 2016), while the same measure for LUKOIL West Siberia was 171 b/d in 2018 (up from 168 b/d in 2017 but below 182 b/d in 2016).
Figure 27: 2016-2018 average well flow rates, b/d |
|
|
|
|
|
|
|
120 |
|
|
2016 |
|
2017 |
|
2018 |
|
|
|
|
||||
|
|
|
|
||||
|
|
|
|
|
|
|
|
|
|
|
|
|
|
|
|
100 |
|
|
|
|
|
|
|
|
|
|
|
|
|
|
|
80 |
|
|
|
|
|
|
|
|
|
|
|
|
|
|
|
60 |
|
|
|
|
|
|
|
|
|
|
|
|
|
|
|
40 |
|
|
|
|
|
|
|
|
|
|
|
|
|
|
|
20 |
|
|
|
|
|
|
|
|
|
|
|
|
|
|
|
0
Gazprom Neft |
Rosneft |
Slavneft |
LUKOIL |
SurgutNG |
Tatneft |
Bashneft |
Source: Ministry of Energy, InfoTEK, Interfax, Renaissance Capital estimates
In 2018 the well flow rates declined following a brief reversal of the negative dynamics the previous year
Large gap between best and worst performers, partially explained by geography of producing assets
27

vk.com/id446425943
Renaissance Capital
20 June 2019
Russian oil & gas
In 4M19, the average crude oil flow rate in Russia increased by 2.5% YoY to 66.0 b/d per well. However, on the company level the dynamics was mixed. Rosneft (-1.1% to 94.1 b/d), Gazprom Neft (-8.9% to 99.8 b/d per well) and Surgutneftegas (-2.0% to 54.0 b/d) demonstrated the declines, while Slavneft (+44.1% to 110.3 b/d) and Tatneft (+12.0% to 33.1 b/d) improved. Other VICs showed gains of 1.8-3.7%. Rosneft uses greenfields to comply with its share of OPEC+ production restrictions, while Gazprom Neft sees the continuing impact of lower flow rates at Novoportovskoye field. LUKOIL and Tatneft both saw higher average flow rates which we attribute to a more mature production profile, with the OPEC+ compliance mainly achieved through the conservation of the more inefficient wells. Surgutneftegas is dealing with the consequences of natural declines at their West Siberian assets. We consider Slavneft’s impressive growth of 44% to be a result of a 27% YoY decline in the net production well stock, mainly brownfields, as well as the ramp-up of production at Kuyumbinskoye field.
In absolute terms, Slavneft showed the largest well flow rate in 4M19 of 110.3 b/d, followed by Gazprom Neft and Rosneft with 99.8 b/d and 94.1 b/d, respectively. Russneft, LUKOIL and Surgutneftegas were ranked in the middle, with average flow rates of 67.7 b/d, 58.9 b/d and 54.0 b/d per well, respectively. Tatneft and Bashneft traditionally rank at the bottom in terms of flow rates, as both companies operate in highly depleted shallow fields in the European part of Russia.
Figure 28: Average crude oil flow rates, 4M19, b/d per well
|
4M18 |
4M19 |
YoY |
Slavneft |
76.5 |
110.3 |
44.1% |
Gazprom Neft |
109.5 |
99.8 |
-8.9% |
Rosneft |
95.2 |
94.1 |
-1.1% |
Russneft |
66.4 |
67.7 |
2.0% |
LUKOIL |
56.8 |
58.9 |
3.7% |
SurgutNG |
55.1 |
54.0 |
-2.0% |
Tatneft |
29.5 |
33.1 |
12.0% |
Bashneft |
28.1 |
28.6 |
1.8% |
Oil companies |
64.4 |
66.0 |
2.5% |
Source: Ministry of Energy, InfoTEK, Interfax, Renaissance Capital
Russia’s flow rates are close to the worldwide average
|
Oil production, |
Producing |
Average well flow |
|
kb/d |
wells |
rate, b/d per well |
Africa |
8,109 |
11,531 |
703 |
Asia-Pacific |
7,500 |
92,708 |
81 |
EE and FSU |
13,483 |
143,944 |
94 |
of which Russia |
10,466 |
134,787 |
78 |
Middle East |
22,885 |
17,721 |
1,291 |
Western Europe |
2,778 |
6,327 |
439 |
Western Hemisphere |
20,187 |
713,650 |
28 |
of which US |
7,465 |
552,683 |
14 |
of which non-US |
12,722 |
160,967 |
79 |
Total world |
74,941 |
985,881 |
76 |
Total OPEC |
30,648 |
35,246 |
870 |
Total non-OPEC |
44,293 |
950,635 |
47 |
Source: The Oil & Gas Journal’s 2013 Worldwide Production Report, InfoTEK, Interfax, Renaissance Capital
28

vk.com/id446425943
Renaissance Capital
20 June 2019
Russian oil & gas
Organic decline rates
We use official well completion and oil flow statistics to calculate organic decline rates for crude producers in Russia, which we define as the estimated reduction in crude production in a reported year that would have been observed in the absence of crude output from new wells (including estimated full-year effects of new wells commissioned in the previous year). This analysis previously showed an improved Russian average decline of 12.6% for the last ‘clean’ year of 2016 (i.e. largely unaffected by OPEC+ constraints), while the statistics over the following two years show accelerating decline rates.
Analysis of 2017 and 2018 decline rates is complicated because of the increased number of idle wells, which have been temporarily decommissioned (or the commissioning of which has been delayed) to comply with OPEC+ quotas which were in effect between November 2016 and June 2018. During 2017 (when the whole year’s production was constrained by the OPEC+ deal) Russian oil producers continued drilling and commissioning new wells (Russian development drilling increased by 11% in 2017, leading to the commissioning of over 7,000 new oil-producing wells that year), while simultaneously increasing the number of idle wells (which increased by nearly 3,000 in 2017). There were two reasons that explained this behavior: some producers (notably Gazprom Neft) were taking advantage of higher-margin production growth at taxadvantaged fields (while constraining production at fully-taxed brownfields), while others (notably Rosneft), were delaying commissioning of new greenfields while getting them ready for post-OPEC+ growth.
We had to adjust for this effect in estimating organic decline rates, as many oil producers were not able to use their spare capacity (i.e. idle wells) in 2017. Based on this analysis, and as shown in Figure 30, we estimate that organic decline rates for crude production in Russia deteriorated to 16.0% in 2018 (vs 13.8% in 2017). Old wells contributed 1.6% more crude in 2018 than they did in 2017, with the contribution from new wells showing a 3.3% increase as the number of newly commissioned wells declined by 2% in 2018 (after a 5% increase 2017).
Figure 30: Organic decline rates, %
|
2007 |
2008 |
2009 |
2010 |
2011 |
2012 |
2013 |
2014 |
2015 |
2016 |
2017 |
2018 |
Gazprom Neft |
-26 |
-29 |
-29 |
-26 |
-21 |
-18 |
-17 |
-18 |
-18 |
-17 |
-16 |
-26 |
Rosneft |
-17 |
-17 |
-17 |
-16 |
-20 |
-18 |
-15 |
-14 |
-14 |
-16 |
-14 |
-17 |
Surgutneftegas |
-12 |
-16 |
-18 |
-18 |
-19 |
-14 |
-15 |
-13 |
-12 |
-12 |
-13 |
-14 |
LUKOIL |
-9 |
-14 |
-12 |
-12 |
-15 |
-11 |
-10 |
-12 |
-13 |
-12 |
-11 |
-14 |
Tatneft |
-2 |
-3 |
-4 |
-3 |
-3 |
-3 |
-3 |
-3 |
-1 |
1 |
-3 |
-7 |
TNK-BP |
-13 |
-13 |
-12 |
-15 |
-14 |
-13 |
- |
- |
- |
- |
|
|
Russia, average |
-12 |
-16 |
-16 |
-15 |
-16 |
-13 |
-14 |
-13 |
-13 |
-13 |
-14 |
-16 |
Source: Company data, Renaissance Capital
Company-specific data show diverging performances among various companies in the sector, with generally higher organic decline rates. The deterioration is led by Gazprom Neft, where we estimate the organic decline rate has reverted to pre-2011 levels. We attribute this effect to both slightly weaker brownfields, and more importantly, a growing share of contribution from the Novoportovkoye field (which accounted for 14% of
Gazprom Neft’s output in 2018, according to CDU-TEK). Although a greenfield, Novoportovskoye wells have above-average decline rates (we estimate 35% in 2018) owing to their complex design and very high initial flow rates (177 t/d vs the Russian average of 9 t/d). However, initial flow rates have declined materially at the Novoportovskoye field when compared to 481 t/d in 2016 and 213 t/d in 2017 (associated with the targeting of less productive NP-8 and Yu2-6 horizons from 2018), which should stem organic decline rates in coming years. We see a similar effect with LUKOIL’s Caspian output (where we estimate the organic decline rate was 37% in 2018), although
Organic decline rate deteriorated to 16.0% in 2018
29
vk.com/id446425943
Renaissance Capital
20 June 2019
Russian oil & gas
to a lesser extent owing to its smaller share of contribution to LUKOIL’s total crude output in Russia.
Rosneft also saw higher organic decline rates YoY, although these have merely returned to a historical average of 17%. We attribute YoY increases to our slightly higher YoY estimated organic decline rates at Rosneft’s two principal brownfields, Priobskoye and Samotlor, as well as rising greenfield output in 2H18. Surgutneftegas’s performance has hardly changed
YoY, as it operates mature fields with little greenfield growth. The most unusual performance comes from Tatneft, which saw its organic decline rate accelerate to 7%. While still substantially below the Russian average (attributed to the peculiar production profile of its super-giant Romashkinskoye field), we associate the YoY reduction to both a growing share of high viscous output (we estimate this has grown to 6.5% in 2018 from 2.9% in 2016) as well as the knock-on effect from a more aggressive production approach seen over 2016-2017. During those years, the average flow rate for old wells was managed upwards, reaching 4.5 t/d in 2017 (vs the historical average of 3.9 t/d), but this has now declined to an average of 4.2 t/d in 2018.
Is a higher organic decline rate in 2018 good or bad? With a long history of YoY fluctuations, this metric merely reflects the changing mix of producing assets, as well as a more aggressive approach to brownfield redevelopment. Such an approach increases near-term production growth and recovery rates. At the same time, we do not necessarily expect an increase in drilling volumes, as significantly higher flow rates from new wells (36.3 t/d in 2018, as compared to 8.9 t/d for old wells) go a long way to offsetting organic declines. We therefore estimate that Russia can continue to commission approximately 7,000 wells pa to maintain its current production rates into the near future.
30