

vk.com/id446425943
Domestic crude oil pricing
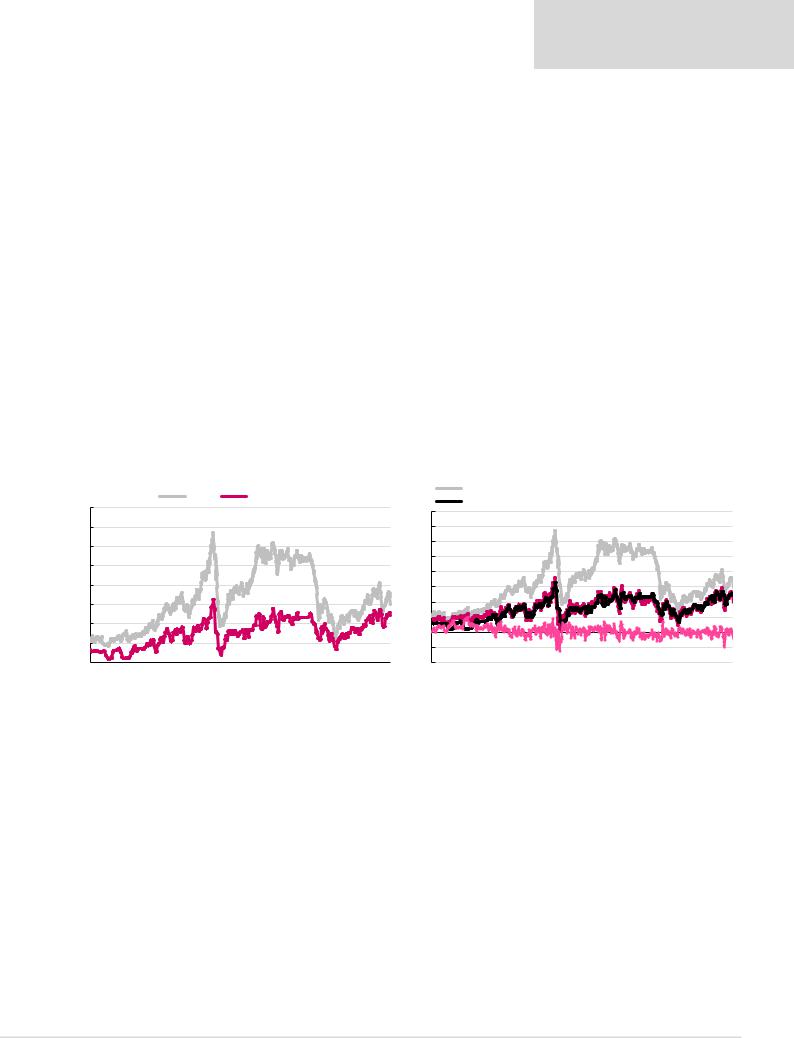
While headline domestic crude prices remain at significant discounts to international levels (as shown in Figure 116), export netback parity was essentially achieved in 2005, and has been broadly maintained since. Hence, export netbacks and domestic crude prices are much closer than first meets the eye, as we show in Figure 117.
In 2018, domestic crude sales at the free market (i.e. not internal transfer) wellhead price earned $47.22/bl (+33.8% YoY), 2.6% above the average export netback realisations of $46.0/bl (+32.5% YoY). Negative export margin (i.e. domestic price premium) was mostly driven by a significant divergence in prices during the period of Brent oil price decline over October-November 2018, as Russian domestic oil price is more sticky. We note that the domestic price premium has generally turned into a discount in 2019 and reached $0.7/bl (1.8%) in (last reported) 1Q19, compared with average premia of $1.2/bl in 2018 and $0.6/bl in 2017. With no structural barriers to exports (crude production is fairly predictable, and existing infrastructure is perfectly capable of dealing with the forecast level of output) a theoretical netback parity pricing on the domestic market can be expected. Still, some volatility is warranted for three reasons. First, export duties are set with a one-month lag, making Russian domestic prices react with a lag to international price movements. Second, the ongoing tax manoeuvre makes it less attractive to refine crude domestically, particularly by less sophisticated independent refineries, which are forced to buy crude on the domestic market, as they have no upstream capacity. Finally, the transformation of Bashneft, historically a crude-short refiner, was a factor through growing its own production and becoming less reliant on third-party purchases, particularly following its acquisition by Rosneft in October 2016.
Renaissance Capital
20 June 2019
Russian oil & gas
Netback parity was achieved in 2005 and has been essentially maintained since
During most of 2018 domestic prices were trading at a premium to export parity, although this has turned into a discount in early 2019
Figure 116: Domestic vs international crude prices, $/bl |
Figure 117: Domestic vs export netbacks, $/bl |
|
|
|
|
|
|
Urals |
|
|
Wellhead price |
|
|
|
|
|
160 |
|
|
|
|
|
|
|
|
|
|
|
|
|
160 |
|
|
|
|
|
|
|
|
|
|
|
|
|
|
|
140 |
|
|
|
|
|
|
|
|
|
|
|
|
|
140 |
120 |
|
|
|
|
|
|
|
|
|
|
|
|
|
120 |
|
|
|
|
|
|
|
|
|
|
|
|
|
|
|
100 |
|
|
|
|
|
|
|
|
|
|
|
|
|
100 |
|
|
|
|
|
|
|
|
|
|
|
|
|
80 |
|
|
|
|
|
|
|
|
|
|
|
|
|
|
|
|
80 |
|
|
|
|
|
|
|
|
|
|
|
|
|
60 |
60 |
|
|
|
|
|
|
|
|
|
|
|
|
|
40 |
40 |
|
|
|
|
|
|
|
|
|
|
|
|
|
20 |
|
|
|
|
|
|
|
|
|
|
|
|
|
0 |
|
|
|
|
|
|
|
|
|
|
|
|
|
|
|
|
20 |
|
|
|
|
|
|
|
|
|
|
|
|
|
-20 |
|
|
|
|
|
|
|
|
|
|
|
|
|
|
|
0 |
|
|
|
|
|
|
|
|
|
|
|
|
|
-40 |
Dec-00 |
Dec-01 |
Dec-02 |
Dec-03 |
Dec-04 |
Dec-05 |
Dec-06 Dec-07 |
Dec-08 |
Dec-09 |
Dec-10 Dec-11 Dec-12 Dec-13 |
Dec-14 |
Dec-15 |
Dec-16 |
Dec-17 |
Dec-18 |
Urals |
|
Netback to Nizhnevartovsk |
|
||
Wellhead price |
|
Export margin |
|
Dec-00 |
Dec-01 |
Dec-02 |
Dec-03 |
Dec-04 |
Dec-05 |
Dec-06 |
Dec-07 |
Dec-08 |
Dec-09 |
Dec-10 |
Dec-11 |
Dec-12 |
Dec-13 |
Dec-14 |
Dec-15 |
Dec-16 |
Dec-17 |
Dec-18 |
|
Note: Export refers to Nizhnevartovsk production shipped via Novorossiysk. |
Source: Argus, InfoTEK, Thomson Reuters, Renaissance Capital |
Source: Argus, InfoTEK, Thomson Reuters, Renaissance Capital |
114