

vk.com/id446425943
International gas pricing
Following substantial renegotiations of European gas supply contracts during 2010-2015, Gazprom’s current portfolio is dominated by hybrid contracts, where the selling price is, on the one hand, still determined by the oil price link (with an average sixto nine-month lag), but on the other hand needs to fall within a rather narrow band (such as +/-5% for example) set by the relevant spot hub. We estimate that spot prices account for c. 80% in
Gazprom’s total gas sales in Europe, either as a result of direct gas sales on the spot market, or having a spot price component in the long-term contract.
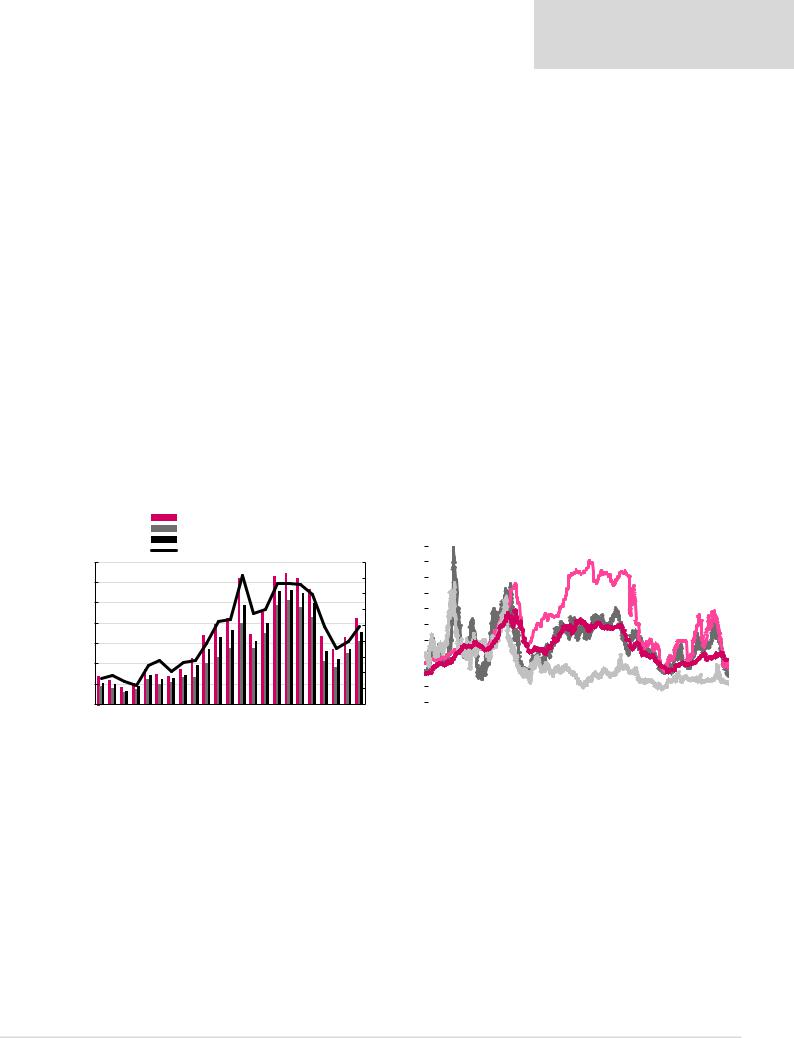
Figure 121 shows the historical relationship between the Brent price, Mediterranean quotes for heating oil (gas oil) and fuel oil, all with a lag of nine months, and the average non-FSU export price derived from Gazprom’s IFRS accounts. Figure 122 shows
Gazprom’s contract price (approximated by the German border price, BAFA) plotted against various spot market indicators. Both charts show a strong correlation – including in more recent years – suggesting that the overall correlation between the European spot natural gas price and the oil price has increased.
A stronger oil price and increased gas demand in 2018 lead to a 28% YoY increase in Asia LNG price to $9.8/mmbtu in 2018. UK’s NBP price grew 35% to $7.9/mmbtu, while Gazprom’s delivered price to the German border increased 17% YoY to $5.9/mmbtu. We note that prices have significantly deteriorated since the start of 2019, with the Asia LNG price down 50% YtD to $6.1/mmbtu on the back of increased LNG production globally. Warmer weather in Europe, combined with higher gas storage levels YoY, have caused a more sizable reduction in NPB price of 53% YtD to $5.4/mmbtu, while Gazprom’s delivered price to German border is down 10% to $5.8/mmbtu as of the date of this report.
Renaissance Capital
20 June 2019
Russian oil & gas
Hybrid contracts with spot price prevalent
Figure 121: Lagged oil and product prices ($/bl) vs the non-FSU gas export price Figure 122: European gas prices – Gazprom vs spot prices, $/mmbtu of Gazprom ($/mcm, rhs)
Heating Oil (LHS) |
|
|
Fuel Oil (LHS) |
|
|
Brent (LHS) |
20 |
|
Non-FSU Gas Export Price (RHS) |
||
|
140 |
450 |
18 |
|
120 |
400 |
16 |
|
|
|
||
100 |
350 |
14 |
|
300 |
12 |
||
|
|||
80 |
250 |
10 |
|
60 |
200 |
8 |
|
40 |
150 |
6 |
|
100 |
4 |
||
|
|||
20 |
50 |
2 |
|
|
|||
- |
- |
0 |
|
|
1996 1998 2000 2002 2004 2006 2008 2010 2012 2014 2016 2018 |
|
Source: Bloomberg, Gazprom, Renaissance Capital
|
|
NBP |
|
LNG Asia |
|
|
|
||
|
|
Henry Hub |
|
Germany BAFA import price |
|
|
|
||
|
|
|
|
|
|
|
|
|
|
|
|
|
|
|
|
|
|
|
|
|
|
|
|
|
|
|
|
|
|
|
|
|
|
|
|
|
|
|
|
|
|
|
|
|
|
|
|
|
|
|
|
|
|
|
2004 |
2005 |
2006 |
2007 |
2008 |
2009 |
2010 |
2011 |
2012 |
2013 |
2014 |
2015 |
2016 |
2017 |
2018 |
Source: Bloomberg, Renaissance Capital
117