

vk.com/id446425943
Light products yield
Light products yield measures the weight of light products (gasoline, jet fuel, diesel fuel) against total core product output, and is an important measure of the quality of outputs. Based on InfoTEK data, we estimate the average light products yield in Russia improved to 61.6% in 2018, from 60.7% in 2017, 59.0% in 2016 and 57.3% in 2015. In 4M19 light products yield slightly increased to 61.9%. The most notable change in 4M19 is a light products yield increase at Novoshakhtinsk refinery, from 26.4% in 2018 to 34.3% in 4M19, Yaisk from 61.2% in 2018 to 67.9% in 4M19 and TANECO from 83.2% in 2018 to 88.1% in 4M19.
These figures most likely underestimate the actual light products yield by around 1 ppt, as our calculations exclude lubricants and straight-run intermediate products produced during refining process.
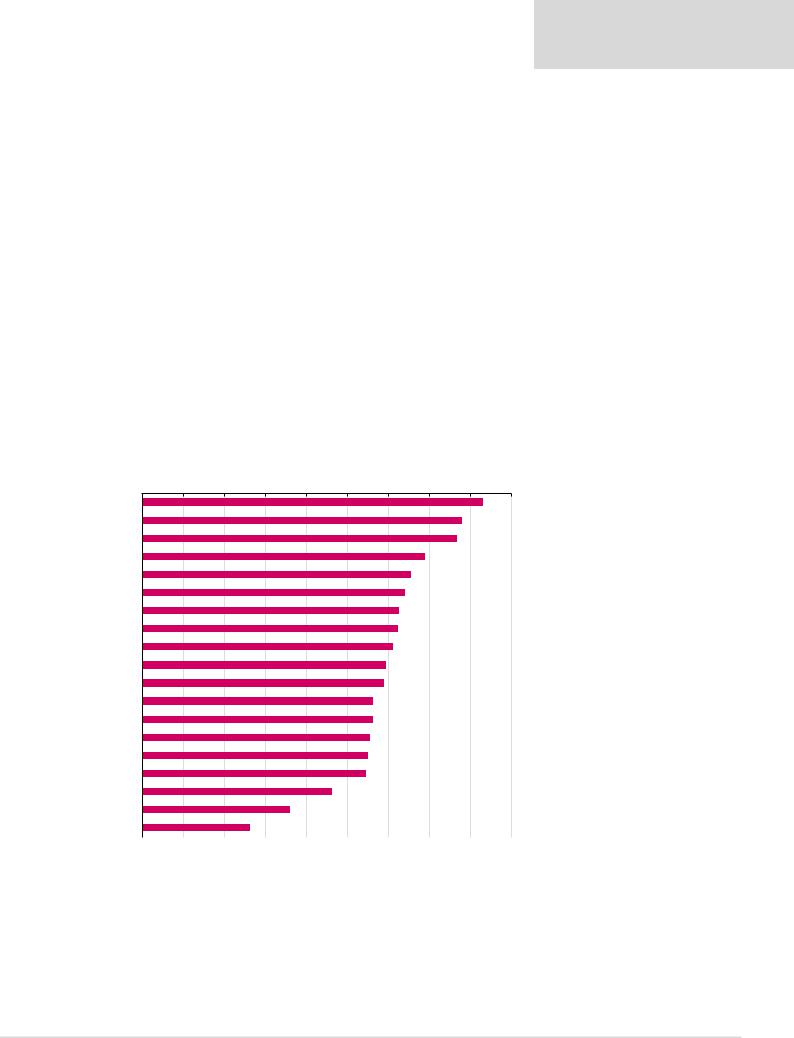
While the actual light products yields of Russian refineries may be a little higher than shown in Figure 64, the Russian average would still be below the European and US averages (85%-plus), which indicates the scope for potential conversion capacity improvements. Light products yield is a function of a refinery’s complexity; more sophisticated plants with secondary processes have higher light products yields. We can see from the ranking below that the leaders in light products yield are those that operate more complex refineries, with the exception of Gazprom’s and NOVATEK’s facilities, which use a large amount of gas condensate and other natural gas liquids (NGL) as feedstock, in addition to crude, which allows them to extract a larger share of light fractions.
Figure 64: Light products yield, 2018
0.0% |
10.0% |
20.0% |
30.0% |
40.0% |
50.0% |
60.0% |
70.0% |
80.0% |
90.0% |
TANECO
Gazprom
NOVATEK
LUKOIL
Gazprom Neft
TAIF
Bashneft
NNK
Yaisk
Orsk
Antipinsk
Rosneft
Krasnodar
SurgutNG
Afipsk
Slavneft
Mariysk
Ilsk
Novoshakhtinsk
Source: Argus, Company data, Renaissance Capital
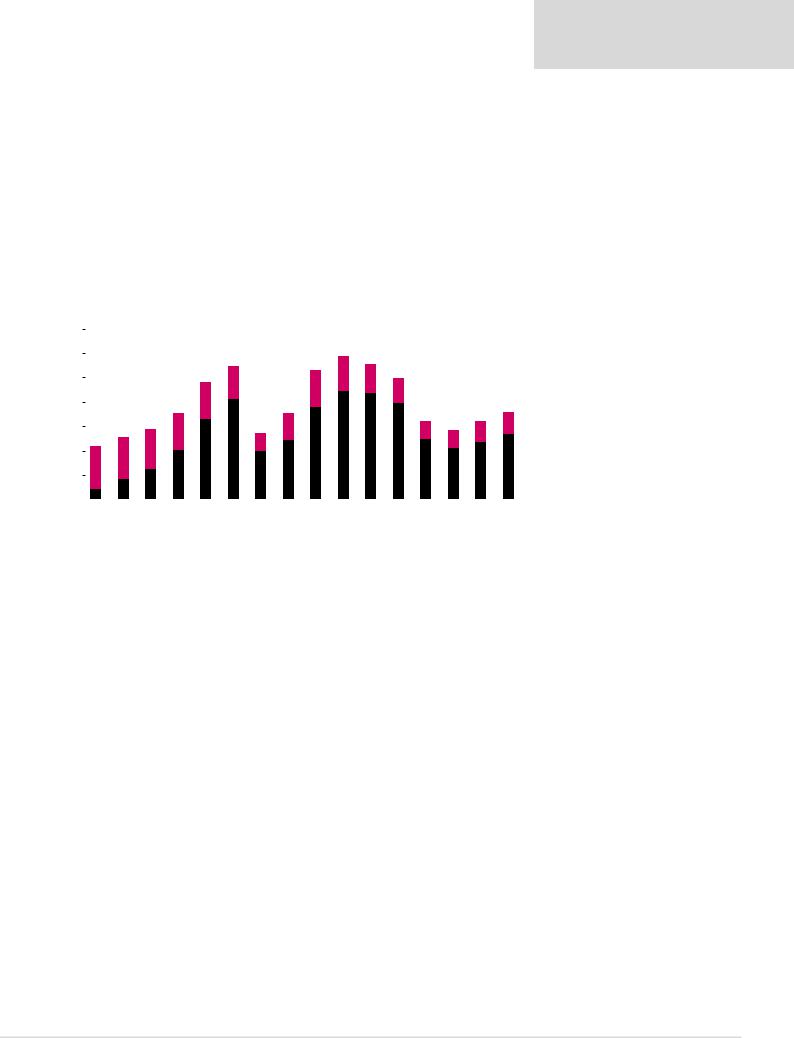
Over 2012-2018, Russia’s refining sector has undergone a major modernisation programme, which has resulted in an improvement in refining complexity and light product yields. As a result of these investments, the share of fuel oil in the output mix decreased from 34% in 2012 to 19% in 2018. The share of diesel fuel production increased to 40% (from 31% in 2012) and the share of naphtha to 11% (vs 8% in 2012), while the shares of gasoline and jet-kero were effectively unchanged at 16-17% and 5-6%, respectively. An
Renaissance Capital
20 June 2019
Russian oil & gas
Light products yield increased in 2018
A major modernisation exercise
59
vk.com/id446425943
increase in vacuum distillation capacity led to an increase in the share of VGO output to 8% in 2018 (vs 5% in 2012).
For 2012-2018, output of core refined products has increased by 17.8mn tpa (CAGR of 1.3%). HFO saw the largest decrease in total volumes (six-year CAGR of -7.7%), while VGO achieved the highest growth (six-year CAGR of 7.8%). Among light products, naphtha demonstrated the largest incremental growth (7.2%), followed by diesel (5.3%), jet-kero (4.8%) and gasoline (0.8%).
Figure 65: Light products yield by company, %
|
2014 |
2015 |
2016 |
2017 |
2018 |
2014-2018 |
4M19 |
|
average |
||||||
|
|
|
|
|
|
|
|
Tatneft |
34.0 |
68.6 |
67.3 |
80.8 |
83.2 |
66.8 |
88.1 |
Gazprom |
62.6 |
80.3 |
86.1 |
78.7 |
78.0 |
77.1 |
80.4 |
NOVATEK |
72.9 |
60.0 |
60.7 |
72.4 |
76.8 |
68.5 |
78.1 |
LUKOIL |
51.5 |
60.0 |
62.6 |
69.0 |
69.0 |
62.4 |
68.3 |
Gazprom Neft |
57.8 |
62.0 |
65.0 |
64.6 |
65.6 |
63.0 |
64.3 |
TAIF |
57.0 |
57.8 |
57.4 |
56.7 |
64.1 |
58.6 |
58.3 |
Bashneft |
58.4 |
66.3 |
65.1 |
62.6 |
62.8 |
63.0 |
64.8 |
NNK |
41.4 |
60.9 |
52.9 |
62.7 |
62.5 |
56.1 |
60.9 |
Yaisk |
54.4 |
60.9 |
60.1 |
62.7 |
61.2 |
59.8 |
67.9 |
Orsk |
46.9 |
50.2 |
52.5 |
57.5 |
59.5 |
53.3 |
64.2 |
Antipinsk |
37.0 |
50.8 |
54.5 |
62.6 |
58.9 |
52.8 |
55.9 |
Rosneft |
50.8 |
52.9 |
55.1 |
56.7 |
56.3 |
54.4 |
56.1 |
Krasnodar |
50.4 |
52.9 |
56.7 |
55.2 |
56.3 |
54.3 |
56.6 |
SurgutNG |
46.9 |
51.1 |
52.4 |
53.8 |
55.5 |
52.0 |
56.3 |
Afipsk |
53.5 |
54.4 |
54.8 |
54.3 |
55.3 |
54.5 |
56.9 |
Slavneft |
53.0 |
54.4 |
55.1 |
54.6 |
54.6 |
54.3 |
53.7 |
Mariysk |
29.3 |
32.8 |
44.5 |
45.3 |
46.4 |
39.7 |
48.2 |
Ilsk |
21.7 |
54.2 |
32.5 |
33.9 |
36.1 |
35.7 |
36.0 |
Novoshakhtinsk |
11.6 |
40.4 |
25.6 |
27.0 |
26.4 |
26.2 |
34.3 |
Russia |
51.3 |
57.3 |
59.0 |
60.7 |
61.6 |
58.0 |
61.9 |
Source: Argus, Company data, Renaissance Capital estimates
The reduction in fuel oil production in both absolute volumes and in the total product mix illustrates the effect of the modernisation programme, along with adjustments for the tax manoeuvre made by oil refiners. Since 2017, fuel oil export duty has been equal to 100% of crude oil export duty, while the coefficient was reduced to 30% for light products (except for naphtha, which is taxed 55% of crude) – effectively punishing refiners with a relatively high share of fuel oil in their total product mix. With the exception of Rosneft, which is lagging behind the other major refining companies in the modernisation of secondary refining capacity, the active phase of the modernisation programme can be considered to be finished. With Euro-6 standards out of the picture for now, we expect the share of fuel oil to be reduced in the short term but to remain stable in the medium term.
Figure 66: Russian refineries – output of core refined products, mnt |
|
|
|
|
|
|
||||||||||||
300 |
|
|
|
Gasoline |
|
Gas Oil |
|
Jet-Kero |
|
Fuel Oil |
|
VGO |
|
|
Naphtha |
|
|
|
|
|
|
|
|
|
|
|
|
|
|||||||||
|
|
|
|
|
|
|
|
|
|
|||||||||
|
|
|
|
|
|
|
|
|
|
|
|
|
|
|
|
|
|
|
|
|
|
|
|
|
|
|
|
|
|
|
|
|
|
|
|
|
|
250 |
|
|
|
|
|
|
|
|
|
|
|
|
|
|
|
|
|
|
|
|
|
|
|
|
|
|
22 |
|
25 |
|
|
26 |
26 |
27 |
|||
|
|
|
|
|
|
|
|
|
|
|
|
|||||||
|
|
|
|
|
18 |
19 |
|
10 |
|
|
||||||||
200 |
|
18 |
|
11 |
|
|
|
15 |
|
18 |
||||||||
15 |
|
12 |
11 |
|
|
|
|
16 |
||||||||||
10 |
|
|
|
|
|
|
||||||||||||
|
12 |
|
|
|
|
|
|
|
|
|
73 |
|
|
|
|
|
|
|
|
|
|
|
|
|
|
76 |
78 |
|
|
|
56 |
51 |
46 |
||||
150 |
|
73 |
|
74 |
|
|
|
|
|
|||||||||
|
|
|
|
|
|
|
|
|
|
|
|
|||||||
67 |
|
|
|
|
|
|
|
|
10 |
11 |
13 |
|||||||
|
|
|
|
|
|
|
|
|
|
|
|
|||||||
|
|
|
|
|
|
|
|
|
|
|
10 |
|
|
|||||
|
|
|
|
|
|
|
|
|
|
|
|
|
|
|||||
|
|
|
|
|
|
|
|
|
11 |
|
|
|
|
|
||||
|
9 |
9 |
|
10 |
11 |
|
|
|
|
|
|
|
|
|
||||
100 |
|
|
|
|
|
|
|
|
|
|
|
|||||||
|
|
|
|
|
|
|
|
|
|
|
|
|
|
|
|
|
||
|
71 |
|
70 |
72 |
76 |
|
87 |
|
|
89 |
92 |
95 |
||||||
|
|
|
|
|
|
|||||||||||||
|
68 |
|
|
|
|
|
|
|
|
|
|
|||||||
50 |
|
|
|
|
|
|
|
|
|
|
|
|
|
|
|
|
|
|
35 |
37 |
|
38 |
39 |
38 |
|
39 |
|
|
40 |
40 |
40 |
||||||
|
|
|
|
|
||||||||||||||
- |
|
|
|
|
|
|
|
|
|
|
|
|
|
|
|
|
|
|
2010 |
2011 |
2012 |
2013 |
2014 |
2015 |
|
2016 |
2017 |
2018 |
|||||||||
|
|
|||||||||||||||||
Source: Argus, Renaissance Capital
Renaissance Capital
20 June 2019
Russian oil & gas
Fuel oil production is down
60
vk.com/id446425943
Renaissance Capital 20 June 2019
Russian oil & gas
According to Autostat data (Figure 67), 2017-2018 saw a rebound of demand for new cars in Russia, with total car sales up 13% in 2018 YoY. However, this measure is still down 0.98mn vs peak sales volume in 2012 (CAGR of -8.3%). Over this period, imported car sales declined at a CAGR of -9.3%, a faster rate when compared to the average 4.9% annual decline in the sales of domestically produced cars.
The declining growth rates are part of the general weaker consumers demand trend, with the total number of vehicles sold in 2013-2018 of 11.7mn was 16% lower than in 2007-2012. Of the cumulative sales for the 5-years period, 77% were imports (vs a 72% share in 2007-2012) and 23% domestic (28% in 2007-2012). This suggests that the growth of demand for highend fuels have normalised, with the effect of Russia’s transition to Euro-5 fuel specification standards in 2016 masked by a decline in the consumers demand.
Figure 67: New passenger car sales, mn vehicles |
|
|
|
|
|
|
|
|
|
|
|||||||||
3.5 |
|
|
|
|
|
|
|
Imported cars |
|
Domestic brands |
|
|
|
|
|
||||
|
|
|
|
|
|
|
|
|
|
|
|
|
|||||||
|
|
|
|
|
|
|
|
|
|
|
|
|
|||||||
|
|
|
|
|
|
|
|
|
|
|
|
|
|
|
|
|
|
|
|
|
|
|
|
|
|
|
|
|
|
|
|
|
|
|
|
|
|
|
|
3.0 |
|
|
|
|
|
|
|
|
|
|
|
|
|
|
|
|
|
|
|
|
|
|
|
|
|
|
|
|
|
|
|
|
|
|
|
|
|
|
|
2.5 |
|
|
|
|
|
|
|
|
|
|
|
|
|
|
|
|
|
|
|
|
|
|
|
|
|
|
|
|
|
|
|
|
|
|
|
|
|
|
|
2.0 |
|
|
|
|
|
|
|
|
|
|
|
|
|
|
|
|
|
|
|
|
|
|
|
|
|
|
|
|
|
|
|
|
|
|
|
|
|
|
|
1.5 |
|
|
|
|
|
|
|
|
|
|
|
|
|
|
|
|
|
|
|
|
|
|
|
|
|
|
|
|
|
|
|
|
|
|
|
|
|
|
|
1.0 |
|
|
|
|
|
|
|
|
|
|
|
|
|
|
|
|
|
|
|
|
|
|
|
|
|
|
|
|
|
|
|
|
|
|
|
|
|
|
|
0.5 |
|
|
|
|
|
|
|
|
|
|
|
|
|
|
|
|
|
|
|
|
|
|
|
|
|
|
|
|
|
|
|
|
|
|
|
|
|
|
|
0.0 |
|
|
|
|
|
|
|
|
|
|
|
|
|
|
|
|
|
|
|
|
|
|
|
|
|
|
|
|
|
|
|
|
|
|
|
|
|
|
|
2003 |
2004 |
2005 |
2006 |
2007 |
2008 |
2009 |
2010 |
2011 |
2012 |
2013 |
2014 |
2015 |
2016 |
2017 |
2018 |
||||
Source: AEB
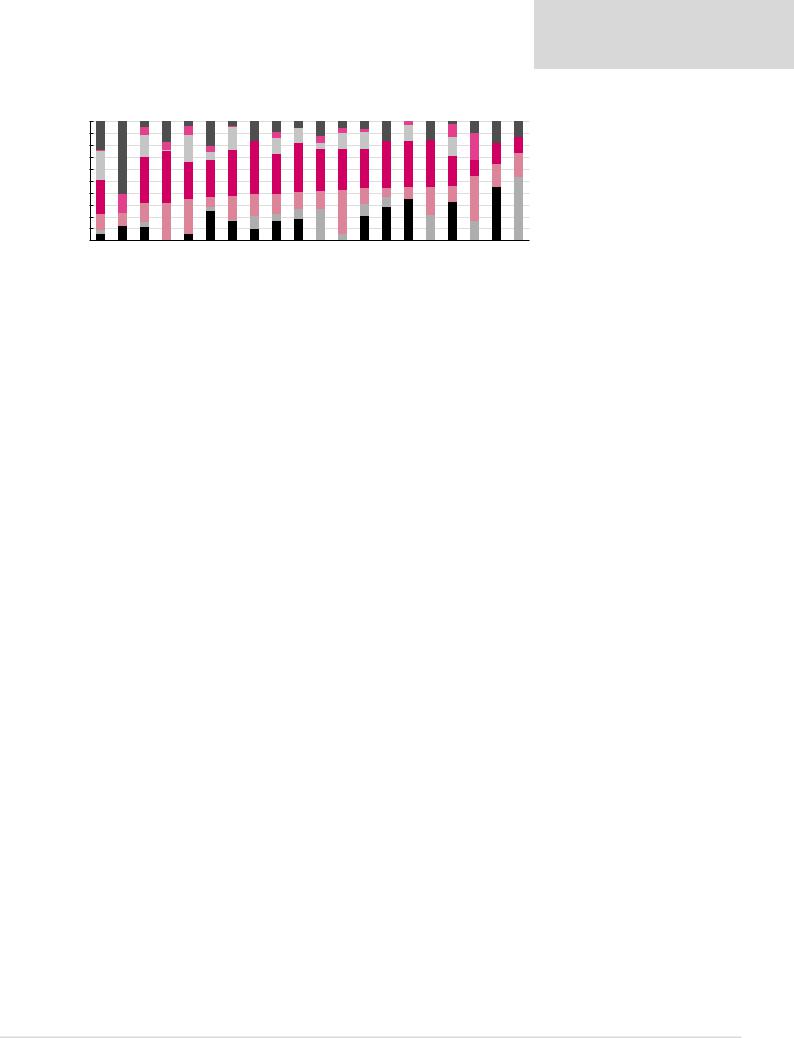
Figure 68 shows the refined product output structures for major Russian refiners, excluding mini-refineries, which mostly produce straight-run gasoline and HSFO. Gazprom Neft and Gazprom have the largest shares of gasoline in their production mix (23% and 24% respectively) and have the fifth and the first lowest levels of dark products yields, respectively. This is due to Gazprom using a lot of gas condensate and other NGLs as feedstock, which is also true for NOVATEK’s Ust-Luga complex, which has the secondlowest level of the dark fuels in the total output. Among other refiners, both Bashneft and LUKOIL have 19% of gasoline in their total refining mix respectively, followed by Slavneft (16%) and Rosneft (14%). Both Surgutneftegas and NNK have their share of gasoline in the total output in generally in line with the Russian average. TANECO had the lowest share in gasoline production among the VICs (1%) in 2018, below 14% average for Russia, but we expect this to reverse in 2019 with the launch of the high-octane gasolines production line at the end of 2018.
Among independent refineries, Orsk, TAIF and Antipinsk have the largest proportions of gasoline in their total production mix at 12%, 7% and 5%, respectively. Russian average share of jet-kero stood at 5% in 2018, with the maximum of 22% seen at Mariysk refinery, followed by NOVATEK (16%) and Slavneft (11%). The main naphtha producers are NOVATEK (61% of refining output), followed by Gazprom (24%) and TAIF (21%). In terms of dark products output, the independent Novoshakhtinsk (74%), Ilsk (64%) and Mariysk (54%) have a large share of fuel oil in their production mix. Among VICs, the companies with the largest share of dark products output in 2018 were Slavneft (45%), Surgutneftegas (44%), Rosneft (44%) and NNK (42%).
Demand for new cars is down, but fuel quality has improved
61
vk.com/id446425943
Renaissance Capital 20 June 2019
Russian oil & gas
Figure 68: Structure the refined product output by company, 2018
|
Fuel Oil |
|
VGO |
|
Other |
|
Gas Oil |
|
Gasoline |
|
Jet-Kero |
|
Naphtha |
|
|
|
|
|
|
|
|||||||
|
|
|
|
|
|
|
100%
90%
80%
70%
60%
50%
40%
30%
20%
10%
0%
Gazprom |
NOVATEK |
LUKOIL |
Tatneft |
Gazprom Neft |
TAIF |
Bashneft |
Yaisk |
Russian average |
Orsk |
Antipinsk |
NNK |
Rosneft |
Krasnodar |
SurgutNG |
Afipsk |
Slavneft |
Mariysk |
Ilsk |
Novoshakhtinsk |
Source: Argus, Renaissance Capital
Transition to Euro-5 completed in 2016
Russia’s transition to European fuel standards has been one of the key factors driving the modernisation of Russian oil refineries over the past few years. European emission standards regulate acceptable limits for exhaust emissions for vehicles sold in the EU. The regulated emissions include carbon monoxide (CO), hydrocarbons (HC), nitrogen oxide (NOx) and particulate matter (PM), which are considered harmful to human health and pose a threat to the environment. The standards also regulate the sulphur content of fuels. The transition to new motor fuel standards required the installation of sophisticated conversion and treatment equipment (secondary processing units) at Russian refineries (and, frequently, the modernisation of existing units), which entailed significant investments.
Russia’s decision to harmonise its fuel standards with the EU was reflected in several government decrees (Decree No. 118 of 27 February 2008, amended by Decree No. 1076 of 30 December 2008, followed by Decree No. 748 of 7 September 2011), which established the timetable for the transition to Euro-3/4/5 standards and associated motor fuel specifications. While now complete, the transition to new European specifications was progressing with significant delays. For instance, in the aftermath of the 2008 financial crisis, the government pushed back the introduction of Euro-3 standards from January 2009 to January 2011 (Decree No. 1076 of 30 December 2008). Accordingly, the inception of Euro-4 and Euro-5 was shifted to 2012 and 2015, respectively. Although the formal reason behind the delay was the financial crisis, in our opinion, this was merely a recognition of the fact that most Russian refineries were not prepared to move to Euro-3 in January 2009.
While Russia formally introduced the Euro-3 standard in January 2011, not all gasoline and diesel fuel output was compliant with the new fuel class. Furthermore, there remained apparent demand for Euro-2, given that the Russian car fleet was not advanced enough at the time (especially trucks and buses). This prompted the Russian government in September 2011 to retroactively push back the scheduled adoption of the Euro-3 standard by two more years, and, finally, as of 1 January 2013, Euro-2 distribution was forbidden in Russia. Accordingly, the inception of Euro-4 and Euro-5 was shifted to January 2015 and 2016, respectively. While the transition to Euro-4 was finally completed on 1 January 2015, the deadline for the transition to Euro-5 was pushed back for six months due to the companies being not ready for the full phase-out of Euro-4. However, the Euro-5 standard was officially introduced in Russia from July 2016.
Euro-5 standard was officially introduced in Russia from July 2016
62
vk.com/id446425943
Renaissance Capital 20 June 2019
Russian oil & gas
Figure 69: Introduction of European fuel specifications in Russia
|
|
Gasoline |
|
|
Diesel |
|
|
Euro-3 |
Euro-4 |
Euro-5 |
Euro-3 |
Euro-4 |
Euro-5 |
Sulphur content, mg per kg |
150 |
50 |
10 |
350 |
50 |
10 |
Carbon monoxide (CO), g per kg |
1.00 |
0.64 |
0.50 |
2.30 |
1.00 |
1.00 |
Hydrocarbons (HC), g per kg |
- |
- |
- |
0.20 |
0.10 |
0.10 |
Nitrogen oxide (NOx), g per kg |
0.50 |
0.25 |
0.18 |
0.15 |
0.08 |
0.06 |
Particulate matter (PM), g per kg |
0.10 |
0.05 |
0.025 |
- |
- |
0.005 |
Octane # by scientific method, min |
95 |
95 |
95 |
- |
- |
- |
Octane # by motor method, min |
85 |
85 |
85 |
- |
- |
- |
Cetane number |
- |
- |
- |
51 |
51 |
- |
Implementation date in Europe |
- |
- |
Sep 2009 |
- |
- |
Sep 2009 |
Old implementation date in Russia |
Jan 2009 |
Jan 2010 |
Jan 2013 |
Jan 2009 |
Jan 2010 |
Jan 2013 |
New implementation date in Russia |
Jan 2011 |
Jan 2015 |
Jul 2016 |
Jan 2011 |
Jan 2015 |
Jul 2016 |
Source: Government order on exhaust emission standards N 690, CERA, Renaissance Capital
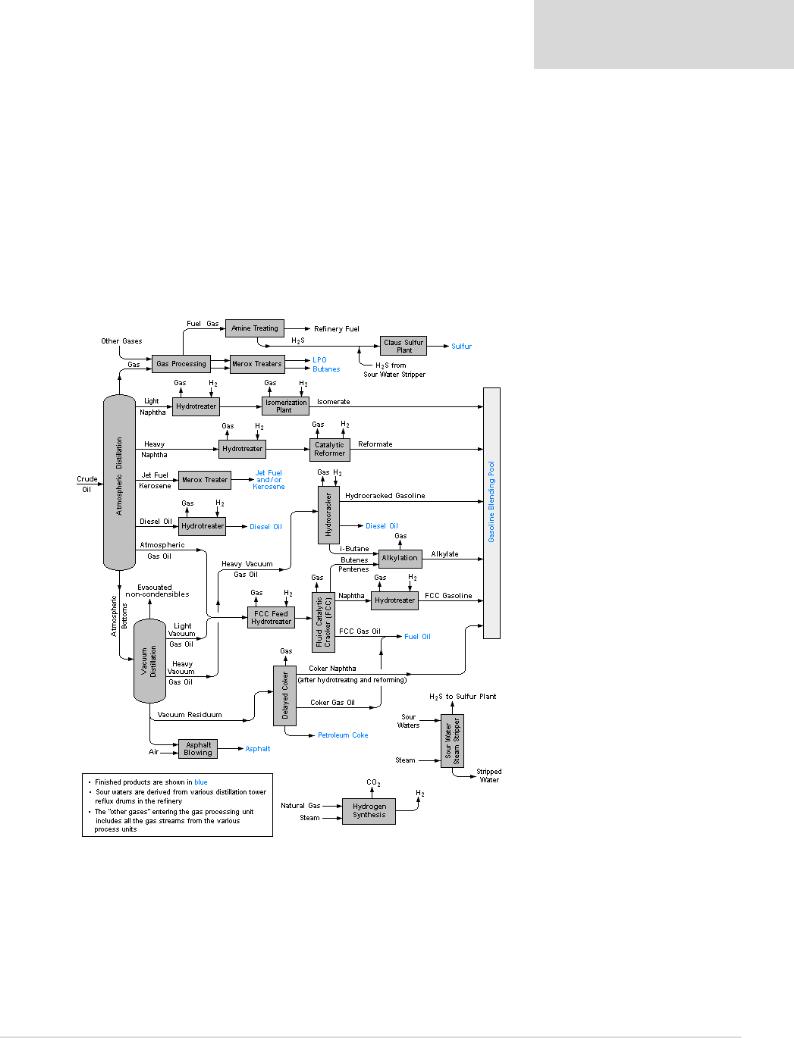
Figure 70: Schematic refinery flow diagram – secondary processes
Source: www.wikipedia.org
63