

- •THE BANK OF THE FUTURE
- •The ABCs of Digital Disruption in Finance
- •Contents
- •The Bank of the Future
- •A is for Artificial Intelligence and Automation
- •B Is for BigTech, Especially in Asia and Emerging Markets
- •C Is for Core Banking, Cloud, and Challengers
- •Where in the World?
- •Disruption by Product and Geography
- •Re-imaging versus Re-engineering Finance
- •Bank of the Future
- •Interview with Exponential View: Azeem Azhar
- •About Azeem Azhar
- •Evolution of AI – Why Now?
- •Industrialization of AI – Spending and Investing More
- •Banking & Securities Is the Largest Non-Tech Industry for AI
- •Interview with Citi Ventures: Ramneek Gupta
- •About Citi Ventures
- •About Ramneek Gupta
- •AI-driven Applications in Banking
- •Use Cases in Consumer Banking
- •Interview with Active.Ai: Ravi Shankar
- •About Active.AI
- •About Ravi Shankar
- •Use Cases in Commercial Banking
- •Use Cases in Capital Markets Banking
- •Interview with Behavox: Erkin Adylov
- •About Behavox
- •About Erkin Adylov
- •AI Enables FTE Reduction, Optimizes Distribution
- •Chinese BigTech and Financial Services
- •[A] Ant Financial Builds an Empire of Services
- •[B] Tencent's WeChat Is China's App for Everything
- •Interview with Kapronasia: Zennon Kapron
- •About Kapronasia
- •About Zennon Kapron
- •China and India on Different FinTech Paths
- •India on the Frontline of Digital Finance
- •India's Transformation Towards Digital
- •Google's m-wallet (Tez) Sees Early Success
- •New RBI Directive Could Threaten Digital Payments
- •About Aditya Menon
- •GAFAs at the Gate with PSD2; But Do Bank Clients Care?
- •What is PSD2?
- •The New Banking Model under PSD2
- •U.K.'s Open Banking Standard
- •Impact of PSD 2/Open Banking on Banks – Risk of Disintermediation?
- •Chapter C: Core Banking, Cloud and Challengers
- •Challenge of Legacy Core Banking Systems
- •Banks Face Multiple Pain Points
- •Do Banks Need To Update Core Systems?
- •IT Change: Incumbents, Neobanks and Vendors’ Views
- •[A] The Incumbent Banks’ View
- •[B] The Neobanks’ View
- •Case Study: Leveris Banking Core
- •Journey to the Cloud
- •Cloud Ecosystem – The Vision for Hardware, Applications and Data
- •There Are Many Different Ways to Move Applications to the Cloud…
- •Some Application Workloads Are Easier to Move to Cloud than Others
- •And Core Banking Applications Are the Hardest to Address
- •Interview with Ping An: Jonathan Larsen
- •About Jonathan Larsen
- •Chapter D: Digital Assets
- •Bitcoin, Blockchain and All Things Crypto
- •Internet vs. Blockchain Financial Value Capture
- •2017: The Year of Crypto
- •Who is Buying Bitcoins?
- •2018: The Year of Second-Layer Protocols?
- •About PwC – FinTech and RegTech Team
- •About Henri Arslanian
- •Blockchain Applications
- •A.] The Power of Smart Contracts
- •B.] KYC-Chain and Digital Identity
- •C.] Reg-Tech
- •D.] ICOs – A Risky New Paradigm?
- •Regulatory approach to ICOs differ significantly across countries
- •Regulatory Approaches to Bitcoin
- •About King & Wood Mallesons
- •About Urszula McCormack
- •What is Ripple? How is it Different?
- •Ripple XRP – The Cryptocurrency
- •Banks and the Ripple Protocol
- •How Are Central Bank Cryptocurrencies Different
- •What Are Central Bankers Saying on CBCCs?
- •Epilogue: Emerging Market BRATs beyond China and India
- •Introducing the BRATs
- •A.] Share Unique Banking Sector Characteristics
- •B.] Favorable Demographics
- •C.] Technology Enablers
- •FinTech Investments Trends
- •About Vostok Emerging Finance
- •About David Nangle
- •NOW / NEXT
- •Contents
- •Investment summary
- •Reporting schedule
- •Earnings revisions
- •Reporting trends: 2H18E vs 2H17
- •Reporting trends 2H18E vs 1H18
- •Results previews
- •Commodity price and exchange rate forecasts
- •Peer comp charts
- •African Rainbow Minerals
- •Alrosa
- •Anglo American
- •Assore
- •Exxaro
- •Glencore
- •Kumba Iron ore
- •NorNickel
- •Rio Tinto
- •Rusal
- •Vale
- •Gold Fields
- •Harmony
- •Polymetal
- •Anglo American Platinum
- •Lonmin
- •Northam
- •Royal Bafokeng Platinum
- •Acron
- •PhosAgro
- •Evraz
- •Disclosures appendix
vk.com/id446425943
PhosAgro – BUY
Renaissance Capital
6 February 2019
Metals & Mining
Figure 103: Phosagro, RUBmn (unless otherwise noted)
|
|
|
|
|
|
|
|
|
|
|
|
|
|
|
Phosagro |
|
|
PHOR:LI |
|
|
|
|
|
Target price, $: |
|
|
16.0 |
||
Market capitalisation, $mn: |
|
|
5,012 |
|
|
|
|
|
Share price, $: |
|
|
13.5 |
||
Enterprise value, $mn: |
|
|
6,848 |
|
|
|
|
|
Potential 12-month return: |
|
26.5% |
|||
|
|
|
|
|
|
|
|
|
|
|
|
|
|
|
Dec-YE |
|
2016 |
2017 |
2018E |
2019E |
2020E |
Dec-YE |
2016 |
2017 |
|
2018E |
2019E |
2020E |
|
Income statement |
|
|
|
|
|
|
|
Balance sheet |
|
|
|
|
|
|
Revenue |
|
187,742 |
181,351 |
237,431 |
271,427 |
280,521 |
|
Net operating assets |
190,254 |
217,875 |
|
235,569 |
248,585 |
253,555 |
EBITDA |
|
72,365 |
51,263 |
76,892 |
94,645 |
97,494 |
|
Investments, net of rehab provision |
3,282 |
352 |
|
341 |
341 |
341 |
EBIT |
|
61,598 |
35,979 |
54,983 |
71,712 |
73,479 |
|
Equity |
88,284 |
98,113 |
|
115,594 |
140,582 |
169,377 |
Equity accounted investments |
|
140 |
287 |
-565 |
359 |
367 |
|
Minority interest |
137 |
129 |
|
184 |
185 |
186 |
Net interest |
|
-3,773 |
-6,365 |
-5,344 |
-4,269 |
-3,729 |
|
Net debt |
105,115 |
119,985 |
|
120,131 |
108,159 |
84,333 |
Taxation |
|
-15,041 |
-8,711 |
-7,066 |
-13,560 |
-14,023 |
|
Balance sheet ratios |
|
|
|
|
|
|
Minority interest in profit |
|
-2 |
2 |
-56 |
-5 |
-6 |
|
|
|
|
|
|
|
|
Profit for the year |
|
59,884 |
25,333 |
28,734 |
54,236 |
56,088 |
|
Gearing (net debt/(net debt+equity)) |
54.4% |
55.0% |
|
51.0% |
43.5% |
33.2% |
Earnings per GDR, USc |
|
227 |
111 |
117 |
209 |
213 |
|
Net debt to EBITDA |
1.5x |
2.3x |
|
1.6x |
1.1x |
0.9x |
|
|
RoCE |
35.4% |
17.5% |
|
24.1% |
29.5% |
29.2% |
||||||
Thomson Reuters consensus |
|
|
|
156 |
217 |
226 |
|
RoIC (after tax) |
29.2% |
14.6% |
|
18.6% |
23.6% |
23.3% |
Dividend per GDR declared, USc |
|
95 |
55 |
81 |
105 |
105 |
|
RoE |
80.8% |
27.2% |
|
26.9% |
42.3% |
36.2% |
Thomson Reuters consensus |
|
|
|
95 |
103 |
106 |
|
Cash flow statement |
|
|
|
|
|
|
Income statement ratios |
|
|
|
|
|
|
|
|
|
|
|
|
|
|
|
|
|
|
|
|
|
Operating cash flow |
61,045 |
34,743 |
|
60,145 |
79,782 |
80,997 |
|
EBITDA margin |
|
39% |
28% |
32% |
35% |
35% |
|
Capex (net of disposals) |
-40,246 |
-35,918 |
-35,089 -35,500 |
-27,257 |
||
EBIT margin |
|
33% |
20% |
23% |
26% |
26% |
|
Other cash flows |
8,822 |
3,235 |
|
-7,339 |
359 |
367 |
EPS Growth |
|
64% |
-58% |
13% |
89% |
3% |
|
Free cash flow |
29,620 |
2,060 |
|
17,716 |
44,640 |
54,108 |
Dividend payout ratio |
|
42% |
49% |
70% |
50% |
49% |
|
Equity shareholders' cash |
28,024 |
-107 |
|
13,452 |
41,220 |
51,120 |
Input assumptions |
|
|
|
|
|
|
|
Dividends and share buy-backs |
-27,974 |
-14,763 |
|
-13,598 |
-29,248 |
-27,293 |
|
357 |
358 |
421 |
434 |
429 |
|
Surplus (deficit) cash |
50 |
-14,870 |
|
-146 |
11,972 |
23,827 |
|
DAP, $/t |
|
|
Cash flow ratios |
|
|
|
|
|
|
|||||
MAP, $/t |
|
344 |
352 |
415 |
434 |
434 |
|
|
|
|
|
|
|
|
NPK 16-16-16, $/t |
|
324 |
321 |
318 |
340 |
347 |
|
Working capital turnover, days |
52 |
75 |
|
64 |
56 |
57 |
Ammonia nitrate, $/t |
|
172 |
199 |
191 |
200 |
228 |
|
FCF yield |
6.6% |
0.5% |
|
4.1% |
10.2% |
13.1% |
Urea, $/t |
|
202 |
220 |
251 |
263 |
269 |
|
Equity shareholders' yield |
8.1% |
0.0% |
|
4.3% |
12.6% |
15.6% |
RUB/$ |
|
67.0 |
58.3 |
62.8 |
67.0 |
68.0 |
|
Capex/EBITDA |
55.6% |
70.1% |
|
45.6% |
37.5% |
28.0% |
Sales volumes, kt |
|
|
|
|
|
|
|
Cash conversion |
0.5x |
0.0x |
|
0.5x |
0.8x |
0.9x |
|
|
|
|
|
|
|
Valuation |
|
|
|
|
|
|
|
DAP/MAP |
|
2,696 |
2,964 |
2,972 |
3,210 |
3,210 |
|
|
|
|
|
|
$/GDR |
|
NPK |
|
2,044 |
2,499 |
2,671 |
2,780 |
2,780 |
|
DCF fair value and calculation of target price |
|
|
|
RUBmn |
||
NPS |
|
517 |
410 |
481 |
518 |
518 |
|
Operating value |
|
|
|
|
536,128 |
20.6 |
Other phosphates |
|
572 |
627 |
647 |
513 |
513 |
|
Financial instruments as at 31 December 2017 |
|
|
|
352 |
0.0 |
|
Ammonia nitrate |
|
376 |
476 |
541 |
533 |
533 |
|
Enterprise value |
|
|
|
|
536,480 |
20.6 |
Urea |
|
1,019 |
1,140 |
1,601 |
1,559 |
1,633 |
|
Net debt as at 31 December 2017 |
|
|
|
|
-119,985 |
-4.6 |
Phosphate rock |
|
2,448 |
2,732 |
2,884 |
2,867 |
2,867 |
|
Minority interest |
|
|
|
|
-129 |
-0.0 |
Total les lumes |
|
10,641 |
11,849 |
12,774 |
12,979 |
13,053 |
|
Cash used in share buy-backs during 2018E |
|
|
|
0 |
0.0 |
|
NPK equivalent sales |
|
8,011 |
9,018 |
9,732 |
10,035 |
10,092 |
|
Equity value |
|
|
|
|
416,366 |
16.0 |
Volume growth |
|
8.7% |
12.6% |
7.9% |
3.1% |
0.6% |
|
|
|
|
|
|
|
|
|
Rounded to |
|
|
|
|
|
16.0 |
|||||||
|
|
|
|
|
|
|
|
Share price on 1/2/2019 |
|
|
|
|
|
13.5 |
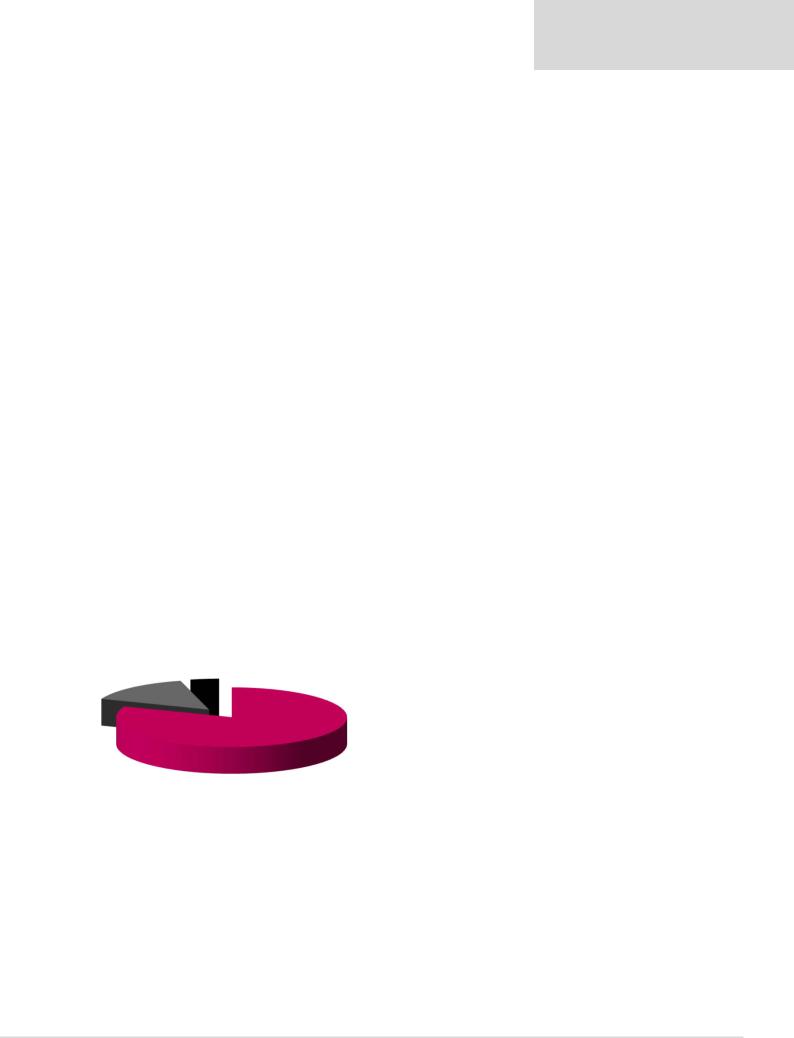
Contribution to FY18E revenue |
|
|
|
|
|
|
|
Expected share price return |
|
|
|
|
|
18.8% |
|
|
|
|
|
|
|
Plus: expected dividend yield |
|
|
|
|
|
7.7% |
|
|
|
|
|
|
|
|
|
Total implied one-year return |
|
|
|
|
|
26.5% |
|
|
|
|
|
|
|
|
Share price range, $: |
|
|
|
|
|
|
|
|
|
|
|
|
|
|
12-month high on 23-2-2018 |
16 |
12-month low on 13-8-2018 |
12 |
|||
|
Other |
|
|
|
|
|
Price move since high |
-18.0% Price move since low |
|
14.0% |
||||
Nitrogen |
4% |
|
|
|
|
|
Calculation of WACC |
|
|
|
|
|
|
|
15% |
|
|
|
|
|
|
|
|
|
|
|
|
|
|
|
|
|
|
|
|
|
WACC |
12.0% |
Cost of debt |
|
|
7.0% |
||
|
|
|
|
|
|
|
|
|
|
|||||
|
|
|
|
|
|
|
|
Risk-free rate |
7.0% |
Tax rate |
|
|
20% |
|
|
|
|
|
|
|
|
|
Equity risk premium |
6.0% After-tax cost of debt |
|
1.7% |
|||
|
|
|
|
|
|
|
|
Beta |
1.30 |
Debt weighting |
|
30% |
||
|
|
|
|
|
|
|
|
Cost of equity |
14.8% |
Terminal growth rate |
|
4.0% |
||
|
|
|
|
|
|
|
|
Valuation ratios |
|
|
|
|
|
|
|
|
|
|
|
|
|
|
Dec-YE, $mn |
2016 |
2017 |
|
2018E |
2019E |
2020E |
|
|
|
|
Phosphate |
|
|
P/E multiple |
5.8x |
12.4x |
|
11.0x |
6.0x |
5.8x |
|
|
|
|
|
|
|
Dividend yield |
7.2% |
4.0% |
|
6.4% |
8.3% |
8.5% |
||
|
|
|
|
|
81% |
|
|
|
||||||
|
|
|
|
|
|
|
EV/EBITDA |
6.2x |
8.5x |
|
5.7x |
4.6x |
4.2x |
|
|
|
|
|
|
|
|
|
|
||||||
|
|
|
|
|
|
|
|
P/B |
3.9x |
3.2x |
|
2.7x |
2.3x |
1.9x |
|
|
|
|
|
|
|
|
NAV per share, RUB |
682 |
758 |
|
893 |
1,086 |
1,308 |
|
|
|
|
|
|
|
|
NAV per GDR, $ |
3.4 |
4.3 |
|
4.7 |
5.4 |
6.4 |
|
|
|
|
|
|
|
|
|
|
|
|
|
|
|
Source: Bloomberg, Thomson Reuters, Renaissance Capital estimates
http://new.guap.ru/i04/contacts |
70 |
|

vk.com/id446425943
ArcelorMittal South Africa – HOLD
Figure 104: ArcelorMittal SA, ZARmn (unless otherwise noted) |
|
|
|
||
ArcelorMittal South Africa |
|
ACLJ.J |
|
|
|
Market capitalisation, ZARmn: |
|
3,944 |
|
|
|
Enterprise value, ZARmn: |
|
4,508 |
|
|
|
|
|
|
|
|
|
Dec-YE |
2016 |
2017 |
2018E |
2019E |
2020E |
Income statement |
|
|
|
|
|
Revenue |
32,737 |
39,022 |
44,259 |
40,138 |
40,110 |
EBITDA |
190 |
-315 |
3,178 |
1,358 |
1,682 |
EBIT |
-1,092 |
-1,220 |
2,463 |
567 |
869 |
Equity accounted income |
129 |
139 |
137 |
0 |
0 |
Net interest |
-700 |
-1,441 |
-1,748 |
-644 |
-477 |
Tax |
-19 |
-2 |
-223 |
22 |
-110 |
Profit (loss) for the period |
-4,706 |
-5,128 |
-1,028 |
-56 |
283 |
Headline profit (loss) |
-2,589 |
-2,671 |
628 |
-56 |
283 |
HEPS, ZAc |
-244 |
-205 |
57 |
-5 |
26 |
HEPS (Consensus), ZAc |
|
|
70 |
42 |
56 |
DPS declared, ZAc |
0 |
0 |
0 |
0 |
0 |
Income statement ratios |
|
|
|
|
|
EBITDA margin |
1% |
-1% |
7% |
3% |
4% |
EBIT margin |
-3% |
-3% |
6% |
1% |
2% |
HEPS growth |
82% |
16% |
128% |
-109% |
605% |
Dividend payout ratio |
0% |
0% |
0% |
0% |
0% |
Input assumptions (steel) |
|
|
|
|
|
Iron ore - (62% Fe, CIF China) $/t |
58 |
71 |
66 |
75 |
67 |
Hard coking coal, $/t |
144 |
188 |
206 |
178 |
161 |
Steel sales realisations, $/t |
523 |
665 |
704 |
582 |
577 |
EBITDA per tonne, $/t |
3 |
-6 |
52 |
21 |
26 |
Capex/tonne, $ |
33 |
23 |
20 |
19 |
25 |
FCF/tonne, $ |
-51 |
-35 |
67 |
-9 |
2 |
$/ZAR |
14.70 |
13.31 |
13.24 |
14.31 |
14.14 |
Sales volumes, kt |
|
|
|
|
|
Domestic sales |
3,275 |
3,302 |
3,483 |
3,523 |
3,559 |
Export sales |
812 |
955 |
1,098 |
1,009 |
1,061 |
Total sales |
4,087 |
4,257 |
4,581 |
4,531 |
4,620 |
Volume growth |
-1.1% |
4.2% |
7.6% |
-1.1% |
2.0% |
Utilisation rate |
78% |
81% |
84% |
85% |
85% |
Balance sheet |
|
|
|
|
|
Net operating assets |
15,131 |
12,680 |
9,128 |
10,100 |
10,576 |
Investments |
-1,104 |
-1,236 |
-1,273 |
-1,273 |
-1,273 |
Equity |
13,543 |
8,058 |
7,291 |
7,235 |
7,518 |
Minority interest |
0 |
0 |
0 |
0 |
0 |
Net debt (cash) |
484 |
3,386 |
564 |
1,592 |
1,786 |
Balance sheet ratios |
|
|
|
|
|
Gearing* |
3.5% |
29.6% |
7.2% |
18.0% |
19.2% |
Net debt to EBITDA |
2.5x |
- |
0.2x |
1.2x |
1.1x |
RoCE |
-5.9% |
-7.6% |
19.2% |
5.1% |
7.5% |
RoIC (after tax) |
-18.9% |
-14.3% |
8.6% |
-3.5% |
4.8% |
RoE |
-19.2% |
-24.7% |
8.2% |
-0.8% |
3.8% |
*Gearing defined as net debt/(net debt +equity)
**Working capital days is defined as (working capital/revenue)*365
Renaissance Capital
6 February 2019
Metals & Mining
|
Target Price, ZAR: |
|
|
4.00 |
||
|
Last Price, ZAR: |
|
|
3.45 |
||
|
Potential 12-month return: |
|
15.9% |
|||
|
|
|
|
|
|
|
Dec-YE |
2016 |
2017 |
|
2018E |
2019E |
2020E |
Cash flow statement |
|
|
|
|
|
|
Operating cash flow |
-1,052 |
-672 |
|
5,285 |
640 |
1,753 |
Growth capex |
-335 |
-322 |
|
-61 |
0 |
0 |
Maintenance capex |
-1,673 |
-1,002 |
|
-1,181 |
-1,204 |
-1,604 |
FCF |
-3,060 |
-1,996 |
|
4,044 |
-564 |
149 |
Equity shareholders' cash |
-1,863 |
-2,902 |
|
2,822 |
-1,028 |
-194 |
Dividends and share buy backs |
4,500 |
0 |
|
0 |
0 |
0 |
Movement in net debt |
2,637 |
-2,902 |
|
2,822 |
-1,028 |
-194 |
Cash flow ratios |
|
|
|
|
|
|
Capex/EBITDA |
1057% |
-420% |
|
39% |
89% |
95% |
FCF yield |
-31.7% |
-17.2% |
|
97.2% |
-10.5% |
2.7% |
Cash conversion ratio |
-0.7x |
-1.1x |
|
4.5x |
-18.4x |
-0.7x |
Equity shareholders' yield |
-47.2% |
-73.6% |
|
71.6% |
-26.1% |
-4.9% |
Working capital days** |
20 |
17 |
|
17 |
17 |
14 |
Valuation |
|
|
|
|
|
|
Calculation of target price (TP) |
|
|
|
|
ZARmn |
ZAR/share |
Steel |
|
|
|
|
3,049 |
2.79 |
Coke and chemicals |
|
|
|
|
3,449 |
3.15 |
Other |
|
|
|
|
2,565 |
2.35 |
Enterprise value |
|
|
|
|
9,063 |
8.29 |
Financial instruments as at 31 December 2017 |
|
|
|
-1,236 |
-1.16 |
|
Net debt as at 31 December 2017 |
|
|
|
|
-3,386 |
-3.10 |
Equity value |
|
|
|
|
4,441 |
4.03 |
Rounded to |
|
|
|
|
|
4.00 |
Share price on 1/2/2019 |
|
|
|
|
|
3.45 |
Expected share price return |
|
|
|
|
|
15.9% |
Plus: expected dividend yield |
|
|
|
|
|
0.0% |
Total implied one-year return |
|
|
|
|
|
15.9% |
Share price range, ZAR: |
|
|
|
|
|
|
12-month high on 28-5-2018 |
6.08 |
12-month low on 7-8-2018 |
1.86 |
|||
Price move since high |
-43.3% |
Price move since low |
|
85.5% |
||
Calculation of discount rate |
|
|
|
|
|
|
WACC |
14.4% |
Cost of debt |
|
|
10.0% |
|
Risk-free rate |
9.0% |
Tax rate |
|
|
28% |
|
Equity risk premium |
6.5% |
After-tax cost of debt |
|
7.2% |
||
Beta |
1.30 |
Debt weighting |
|
30% |
||
Cost of equity |
17.5% |
Terminal growth rate |
|
2.0% |
||
Valuation ratios |
|
|
|
|
|
|
Dec-YE, $mn |
2016 |
2017 |
|
2018E |
2019E |
2020E |
P/E multiple |
-3.6x |
-3.7x |
|
5.7x |
-67.5x |
13.4x |
Dividend yield |
0.0% |
0.0% |
|
0.0% |
0.0% |
0.0% |
EV/EBITDA |
50.8x |
-36.9x |
|
1.3x |
4.0x |
3.3x |
P/B |
0.7x |
1.0x |
|
0.5x |
0.5x |
0.5x |
NAV per share, ZAR |
12.4 |
7.4 |
|
6.7 |
6.6 |
6.9 |
|
|
|
|
|
|
|
Source: Bloomberg, Thomson Reuters, Renaissance Capital estimates
http://new.guap.ru/i04/contacts |
71 |
|