

- •THE BANK OF THE FUTURE
- •The ABCs of Digital Disruption in Finance
- •Contents
- •The Bank of the Future
- •A is for Artificial Intelligence and Automation
- •B Is for BigTech, Especially in Asia and Emerging Markets
- •C Is for Core Banking, Cloud, and Challengers
- •Where in the World?
- •Disruption by Product and Geography
- •Re-imaging versus Re-engineering Finance
- •Bank of the Future
- •Interview with Exponential View: Azeem Azhar
- •About Azeem Azhar
- •Evolution of AI – Why Now?
- •Industrialization of AI – Spending and Investing More
- •Banking & Securities Is the Largest Non-Tech Industry for AI
- •Interview with Citi Ventures: Ramneek Gupta
- •About Citi Ventures
- •About Ramneek Gupta
- •AI-driven Applications in Banking
- •Use Cases in Consumer Banking
- •Interview with Active.Ai: Ravi Shankar
- •About Active.AI
- •About Ravi Shankar
- •Use Cases in Commercial Banking
- •Use Cases in Capital Markets Banking
- •Interview with Behavox: Erkin Adylov
- •About Behavox
- •About Erkin Adylov
- •AI Enables FTE Reduction, Optimizes Distribution
- •Chinese BigTech and Financial Services
- •[A] Ant Financial Builds an Empire of Services
- •[B] Tencent's WeChat Is China's App for Everything
- •Interview with Kapronasia: Zennon Kapron
- •About Kapronasia
- •About Zennon Kapron
- •China and India on Different FinTech Paths
- •India on the Frontline of Digital Finance
- •India's Transformation Towards Digital
- •Google's m-wallet (Tez) Sees Early Success
- •New RBI Directive Could Threaten Digital Payments
- •About Aditya Menon
- •GAFAs at the Gate with PSD2; But Do Bank Clients Care?
- •What is PSD2?
- •The New Banking Model under PSD2
- •U.K.'s Open Banking Standard
- •Impact of PSD 2/Open Banking on Banks – Risk of Disintermediation?
- •Chapter C: Core Banking, Cloud and Challengers
- •Challenge of Legacy Core Banking Systems
- •Banks Face Multiple Pain Points
- •Do Banks Need To Update Core Systems?
- •IT Change: Incumbents, Neobanks and Vendors’ Views
- •[A] The Incumbent Banks’ View
- •[B] The Neobanks’ View
- •Case Study: Leveris Banking Core
- •Journey to the Cloud
- •Cloud Ecosystem – The Vision for Hardware, Applications and Data
- •There Are Many Different Ways to Move Applications to the Cloud…
- •Some Application Workloads Are Easier to Move to Cloud than Others
- •And Core Banking Applications Are the Hardest to Address
- •Interview with Ping An: Jonathan Larsen
- •About Jonathan Larsen
- •Chapter D: Digital Assets
- •Bitcoin, Blockchain and All Things Crypto
- •Internet vs. Blockchain Financial Value Capture
- •2017: The Year of Crypto
- •Who is Buying Bitcoins?
- •2018: The Year of Second-Layer Protocols?
- •About PwC – FinTech and RegTech Team
- •About Henri Arslanian
- •Blockchain Applications
- •A.] The Power of Smart Contracts
- •B.] KYC-Chain and Digital Identity
- •C.] Reg-Tech
- •D.] ICOs – A Risky New Paradigm?
- •Regulatory approach to ICOs differ significantly across countries
- •Regulatory Approaches to Bitcoin
- •About King & Wood Mallesons
- •About Urszula McCormack
- •What is Ripple? How is it Different?
- •Ripple XRP – The Cryptocurrency
- •Banks and the Ripple Protocol
- •How Are Central Bank Cryptocurrencies Different
- •What Are Central Bankers Saying on CBCCs?
- •Epilogue: Emerging Market BRATs beyond China and India
- •Introducing the BRATs
- •A.] Share Unique Banking Sector Characteristics
- •B.] Favorable Demographics
- •C.] Technology Enablers
- •FinTech Investments Trends
- •About Vostok Emerging Finance
- •About David Nangle
- •NOW / NEXT
- •Contents
- •Investment summary
- •Reporting schedule
- •Earnings revisions
- •Reporting trends: 2H18E vs 2H17
- •Reporting trends 2H18E vs 1H18
- •Results previews
- •Commodity price and exchange rate forecasts
- •Peer comp charts
- •African Rainbow Minerals
- •Alrosa
- •Anglo American
- •Assore
- •Exxaro
- •Glencore
- •Kumba Iron ore
- •NorNickel
- •Rio Tinto
- •Rusal
- •Vale
- •Gold Fields
- •Harmony
- •Polymetal
- •Anglo American Platinum
- •Lonmin
- •Northam
- •Royal Bafokeng Platinum
- •Acron
- •PhosAgro
- •Evraz
- •Disclosures appendix
vk.com/id446425943 |
|
123 |
March 2018 |
Citi GPS: Global Perspectives & Solutions |
NOW / NEXT
Key Insights regarding the future of Banking
|
INNOVATION |
Large incumbent banks lag digital natives and their technology stacks are struggling |
|
|
|
to compete in a world that is mobile first. / Banks are exploring AI uses in consumer |
|
|
|
|
|
|
|
and wholesale banking with the help of robotics (automation of routine tasks), |
|
|
|
analytics (big data mining), chat bots (digital dialogue with customers), and |
|
|
|
cognitive (changing rules and adapting). |
|
|
|
|
|
|
|
|
|
TECHNOLOGY |
Today’s global payment infrastructure moves money from one payment system to |
|
another through a series of internal transfers across institutions which makes the |
|
system slow, error prone, and costly. / The use of Blockchain will enable direct |
|
transfer of digital assets without the need for an intermediary or a centralized |
|
authority plus smart contracts/tokenization that can automate and execute pre- |
|
agreed conditions once they are met. |
|
|
|
|
|
|
|
SHIFTING WEALTH |
The old question was whether new entrants — FinTech startups — were going to |
|
|
|
|
|
nibble away at incumbent bank’s profit. / The new question is how to stop |
|
|
|
|
|
established tech giants — BigTech — leveraging their strong customer bases, vast |
|
|
|
|
|
user data pools, agile tech platforms, and deep funding pools to disrupt banks. |
|
|
|
|
|
|
|
|
|
|
|
|
|
© 2018 Citigroup
http://new.guap.ru/i04/contacts

vk.com/id446425943
Citi GPS: Global Perspectives & Solutions |
© 2018 Citigroup |
www.citi.com/citigps |
|
http://new.guap.ru/i04/contacts
vk.com/id446425943
Central Bank of Russia
Wait-and-see mode
Update
Economic Research
5 February 2019
Economics
Russia
Oleg Kouzmin
+7 (495) 258-7770 x 4506 OKouzmin@rencap.com
On Friday (8 February), we expect the Central Bank of Russia (CBR) to keep the key interest rate at 7.75%. We expect no more rate hikes if inflation peaks at <6% in March-April and geopolitical risks do not increase in 1Q19.
We expect the CBR to keep the rate at 7.75% on Friday
The policy statement is due to be published at 1:30pm Moscow time (10:30am London time) on 8 February. We believe the CBR will keep the key rate unchanged, in line with Bloomberg consensus. After the previous meeting on 14 December, the CBR noted that it will assess the need for future policy tightening depending on inflation and economic developments, and external risks. We believe the CBR will maintain rates at the upcoming meeting just to see how inflation dynamics and its forecasts are affected by the recent VAT increase. We see a rise in inflation expectations – which we believe is expected by the CBR and the market (Figure 2).
Figure 1: CPI and its components, % YoY
|
CPI |
|
|
Food |
|
|
Non-food |
|
Services |
||
24 |
|
|
|
|
|
21 |
|
|
|
|
|
18 |
|
|
|
|
|
15 |
|
|
|
|
|
12 |
|
|
|
|
|
9 |
|
|
|
|
|
6 |
|
|
|
|
|
3 |
|
|
|
|
|
0 |
|
|
|
|
|
2008 |
2010 |
2012 |
2014 |
2016 |
2018 |
Source: Rosstat, Renaissance Capital
No more hikes needed if CPI peaks at <6%
We believe future rate hikes could be avoided if headline inflation does not approach 6% in March-April (our forecast: it peaks at 5.6-5.7%). This could be a sign that inflation will only accelerate due to direct supply-side effects, while indirect effects (such as an acceleration of inflation due to worsening inflation expectations) remain muted meaning that future inflation trends remain under control (especially under cooling consumer demand growth).
Potential sanctions are a major unknown
If we are wrong about the inflation forecast, and then the CBR makes another 25-bpt rate hike in March, it will definitely mark the end of the rate-hiking cycle, in our view…unless new sanctions arrive. Possible sanctions remain a major unknown, especially after newly elected members join the US Congress in 1Q19 and ahead of the Ukrainian presidential elections due on 31 March 2019. As our scenario analysis shows (Figures 3 and 8), if sanctions hurt Russia and the oil price remains close to current levels ($65/bl), then the rate might range from 9.25% to 11.5% at end-2019.
Russian 2018 GDP growth surprised positively (2.3%)
On 4 February, Rosstat reported that in 2018 Russian GDP expanded at the fastest pace in six years (2.3%). From the demand-side, the print was supported by a further acceleration of exports (6.3%) and stronger net domestic consumption (excluding imports). The sector breakdown shows that Russian growth primarily benefited from revised data of construction activity (5%), as well as the mining sector (4%), higher commodity prices supporting the financial sector (6%) and the World Cup, with hotels/restaurants up by 6%. We forecast that this year’s growth should be softer
(1.2%), while 2020 growth accelerates to 2.4%. In contrast with some media reports, we would not question the quality of the 2018 print. First, while late and significant data revisions are inconvenient, we do not think that a 2.3% GDP print is unachievable considering the dynamics of the second-tier economic indicators. Second, we note that although a preliminary estimate of c. 1.5% growth in 9M18 looked at odds and weaker than other indicators suggested, this disparity to the weaker side did not raise an issue of data credibility among the public.
Figure 2: Inflation expectations (direct)
Observed inflation, % YoY
Inflation expected in the next 12 months, % YoY
28 |
|
|
|
|
|
|
|
|
26 |
|
|
|
|
|
|
|
|
24 |
|
|
|
|
|
|
|
|
22 |
|
|
|
|
|
|
|
|
20 |
|
|
|
|
|
|
|
|
18 |
|
|
|
|
|
|
|
|
16 |
|
|
|
|
|
|
|
|
14 |
|
|
|
|
|
|
|
|
12 |
|
|
|
|
|
|
|
|
10 |
|
|
|
|
|
|
|
|
8 |
|
|
|
|
|
|
|
|
6 |
|
|
|
|
|
|
|
|
Apr-10 |
Apr-11 |
Apr-12 |
Apr-13 |
Apr-14 |
Apr-15 |
Apr-16 |
Apr-17 |
Apr-18 |
Source: CBR, FOM
Figure 3: Scenarios for contagion effects of potential sanctions on Russian state debt
Brent oil, $/bl |
|
65 |
|
‘Soft’ |
‘Hard’ |
Real GDP growth |
0.5% |
-0.8% |
RUB/$, annual avg |
70.8 |
75.7 |
Inflation, annual avg |
6.3% |
8.2% |
Policy rate by year-end |
9.25% |
11.5% |
Brent oil, $/bl |
50 |
80 |
||
|
‘Soft’ |
‘Hard’ |
‘Soft’ |
‘Hard’ |
Real GDP growth |
0.1% |
-1.3% |
0.8% |
-0.4% |
RUB/$, annual avg |
76.6 |
84.0 |
66.4 |
70.2 |
Inflation, annual avg |
8.2% |
11.0% |
5.5% |
6.2% |
Policy rate by year-end |
11.5% 14.0% |
8.25% 9.0% |
||
Source: Renaissance Capital estimates
© 2019 Renaissance Securities (Cyprus) Limited. All rights reserved. Regulated by the Cyprus Securities and Exchange Commission (Licence No: KEPEY 053/04). Hyperlinks to important information accessible at www.rencap.com: Disclosures and Privacy Policy, Terms & Conditions, Disclaimer.
http://new.guap.ru/i04/contacts
vk.com/id446425943
Renaissance Capital
5 February 2019
Central Bank of Russia
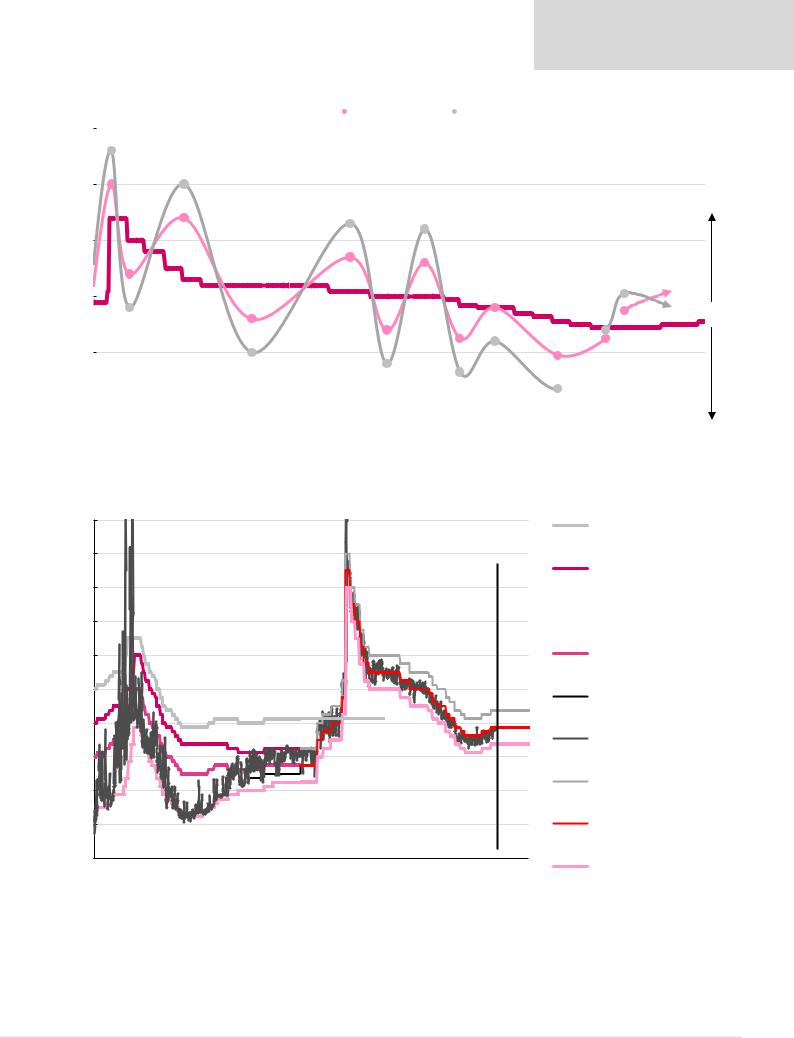
Figure 4: Cycles in the CBR’s policy stance (‘CBR mood’ in the chart, which we think tends to be exaggerated by market economists/analysts)
25 |
|
|
The CBR key rate |
|
|
'CBR mood' |
|
|
|
'Consensus interpretation' |
|
|
|
|
|
|
|
|
|
|
|
|
|||||
|
|
|
|
|
|
|
|
|
|
|
|
|
|
Dec 14: 'No rate |
|
|
|
|
|
|
|
|
|
|
|||
|
|
|
|
|
|
|
|
|
|
|
|||
|
cuts until June!' |
|
|
|
|
|
|
|
|
|
|
||
|
Mid-15: 'The CBR are cutting |
|
|
|
|
|
|
|
|
|
|
||
20 |
slowly - not many cuts this year!' |
Mid-16: 'Rate cuts would be |
Start-17: 'Budget rule puts |
|
|
||||||||
|
|
|
|
|
|
||||||||
|
|
|
|
limited - no budget |
pressures on the rouble |
|
|
|
|||||
|
|
|
|
consolidation strategy!' |
and reduces the scope for |
|
2H18: |
||||||
|
|
|
|
|
|
|
|
the rate cuts!' |
|
|
|||
15 |
|
|
|
|
|
|
|
|
|
another |
|||
|
|
|
|
|
|
|
|
|
|
|
|
||
|
|
|
|
|
|
|
|
|
|
|
Jun 18: |
sanctions |
|
|
|
|
|
|
|
|
|
|
|
|
|
||
|
|
|
|
|
|
|
|
|
|
Mid-17: inflation 'spikes' |
& two front |
||
|
|
|
|
|
|
|
|
|
|
announcement |
|||
|
|
|
|
|
|
|
|
|
|
to 4.4% due to delayed |
of VAT |
loaded |
|
|
|
|
|
|
|
|
|
|
|
harvest supplies |
rate hikes |
||
10 |
|
|
|
|
|
|
|
|
|
increase |
|||
|
|
|
|
|
|
|
|
|
|
|
|
||
|
|
|
|
|
|
|
|
|
|
|
|
|
|
|
Jan 15: 'This is too early to |
|
|
|
|
|
|
|
|
|
|
||
|
cut rates - the CBR gives up |
|
|
|
|
|
|
|
|
Apr 18: new |
|
||
5 |
inflation targeting!' |
|
|
End-16: 'Rate cuts |
|
Apr 17: 'The rouble |
|
sanctions |
|
||||
|
|
|
|
|
|
|
|
||||||
|
End-15: 'Inflation would be crushed very |
|
is strong and |
4Q17-1Q18: front- |
|
||||||||
|
will happen soon as |
inflation is nearly at |
|
||||||||||
|
soon, and we'll see a 400 bps rate cuts as |
loaded rate cuts with |
|
||||||||||
|
the CBR lifts an oil |
|
4% - more cuts |
|
|||||||||
|
the CBR targets a 3% real policy rate!' |
|
CPI at 2-3% |
|
|||||||||
|
price outlook!' |
|
happeing soon!' |
|
|||||||||
0 |
|
|
|
|
|
|
|
|
|
||||
|
|
|
|
|
|
|
|
|
|
|
|
|
|
Nov-14 Feb-15 May-15 Aug-15 Nov-15 Feb-16 May-16 |
|
Aug-16 Nov-16 Feb-17 |
May-17 Aug-17 Nov-17 Feb-18 |
May-18 Aug-18 |
Nov-18 |
||||||||
Too hawkish
Too dovish
Note: Consensus interpretation could be exaggerated in this chart; LHS shows CBR key rate in %; RHS is not a numerical axis.
Source: CBR, Renaissance Capital
Figure 5: CBR interest rate corridor and RUONIA rate, %
20 |
|
|
|
|
|
|
|
|
|
|
|
18 |
|
|
|
|
|
|
|
|
|
|
|
16 |
|
|
|
|
|
|
|
|
|
|
|
14 |
|
|
|
|
|
|
|
|
|
|
|
12 |
|
|
|
|
|
|
|
|
|
|
|
10 |
|
|
|
|
|
|
|
|
|
|
|
8 |
|
|
|
|
|
|
|
|
|
|
|
6 |
|
|
|
|
|
|
|
|
|
|
|
4 |
|
|
|
|
|
|
|
|
|
|
|
2 |
|
|
|
|
|
|
|
|
|
|
|
0 |
|
|
|
|
|
|
|
|
|
|
|
2008 |
2009 |
2010 |
2011 |
2012 |
2013 |
2014 |
2015 |
2016 |
2017 |
2018 |
2019 |
The CBR refinancing rate
The CBR stand-by REPO rate
 The CBR stand-by deposit rate
The CBR minimum REPO rate
The CBR maximum deposit auction rate
Interbank market O/N rate (RUONIA / MIACR)
The unified rate on o/n stand-by refinancing operations
The CBR key rate
The CBR stand-by deposit rate
Source: CBR, Renaissance Capital
http://new.guap.ru/i04/contacts |
2 |
|

vk.com/id446425943
Renaissance Capital
5 February 2019
Central Bank of Russia
Figure 6: Approaches to calculate a neutral policy rate
Real ‘neutral’ rate
Equilibrium foreign policy rate (average between US & eurozone)
0.5-1.0%
Russian risk premium (CDS / Eurobond spreads)
1.0-1.5%
RUB REER depreciation
0-0.5%
1.5-3.0% (real rate) |
|
|
|
|
|
|
|
1.5-3.0% (real rate) |
|
|
|
|
|
||||||||
+ |
|
|
|
|
|
|
|
|
|
|
|
+ |
|
|
|
|
|
|
|
|
|
4% inflation |
|
|
|
|
|
|
|
4%-plus inflation expectations |
|
|
|
|
|
||||||||
= |
|
|
|
|
|
|
|
|
|
|
|
= |
|
|
|
|
|
|
|
|
|
5.5-7.0% nominal rate |
|
|
|
|
|
5.5-7.0%-plus nominal rate |
|
|
|
|
|
||||||||||
|
|
|
|
|
|
|
|
|
|
|
|
|
|
|
|
|
Source: Renaissance Capital |
||||
Figure 7: Oil scenarios for Russia |
|
|
|
|
|
|
|
|
|
|
|
|
|
|
|
|
|
||||
Year |
|
2018E |
|
|
|
|
|
|
|
2019E |
|
|
|
|
|
|
|
|
2020E |
||
Brent oil, $/bl |
|
|
72 |
|
90 |
80 |
70 |
65 |
|
60 |
|
55 |
50 |
|
40 |
|
30 |
|
60 |
||
|
|
|
Base case |
|
|
|
|
||||||||||||||
|
|
|
|
|
|
|
|
|
|
|
|
|
|
|
|
|
|
|
|
||
Real GDP growth |
|
|
2.3% |
|
1.8% |
|
1.5% |
1.3% |
1.2% |
|
1.1% |
0.9% |
0.6% |
|
0.3% |
|
-1.4% |
2.4% |
|||
RUB/$, annual avg |
|
|
62.8 |
|
60.8 |
63.9 |
65.6 |
66.3 |
|
67.4 |
69.8 |
71.1 |
|
73.2 |
|
81.0 |
68.5 |
||||
Inflation, annual avg |
|
|
2.9% |
|
5.0% |
|
5.1% |
5.3% |
5.4% |
|
5.5% |
5.8% |
6.1% |
|
6.7% |
|
8.4% |
3.8% |
|||
Policy rate by year-end |
|
|
7.75% |
|
7.5% |
7.5% |
7.5% |
7.75% |
|
7.75% |
8.0% |
8.5% |
|
11.0% 13.0% |
7.25% |
||||||
|
|
|
|
|
|
|
|
|
|
|
|
|
|
|
|
|
|
|
|
|
|
Current account, % of GDP |
|
|
6.7% |
|
7.3% |
6.6% |
5.7% |
5.4% |
|
4.9% |
4.8% |
3.9% |
|
2.4% |
|
3.0% |
4.1% |
||||
Budget balance, % of GDP |
|
|
2.0% |
|
4.1% |
|
3.4% |
2.5% |
2.0% |
|
1.5% |
0.8% |
0.5% |
|
-0.6% |
-2.0% |
0.8% |
||||
GDP, $bn |
|
|
1,629 |
1,845 |
1,723 |
1,641 |
1,618 |
|
1,574 |
1,365 |
1,456 |
|
1,364 |
|
1,172 |
1,643 |
|||||
|
|
|
|
|
|
|
|
|
|
|
|
|
|
|
Source: Renaissance Capital estimates |
||||||
Figure 8: Potential impact of new sanctions on Russian macro |
|
|
|
|
|
|
|
|
|
|
|
||||||||||
Year |
|
|
|
|
|
|
|
|
|
2019E |
|
|
|
|
|
|
|
|
|
||
Brent oil, $/bl |
|
|
80 |
|
|
|
|
65 |
|
|
|
|
|
|
50 |
|
|
|
|
||
|
Base |
‘Soft’ |
|
‘Hard’ |
Base |
‘Soft’ |
|
‘Hard’ |
|
Base |
‘Soft’ |
‘Hard’ |
|||||||||
|
case Sanctions sanctions |
case Sanctions sanctions |
case |
Sanctions sanctions |
|||||||||||||||||
Real GDP growth |
1.5% |
0.8% |
|
-0.4% |
1.2% |
0.5% |
|
-0.8% |
|
0.6% |
|
0.1% |
|
-1.3% |
|||||||
RUB/$, annual avg |
63.9 |
66.4 |
|
|
|
70.2 |
66.3 |
70.8 |
|
75.7 |
|
71.1 |
|
76.6 |
|
84.0 |
|||||
Inflation, annual avg |
5.1% |
5.5% |
|
6.2% |
5.4% |
6.3% |
|
8.2% |
|
6.1% |
|
8.2% |
|
11.0% |
|||||||
Policy rate by year-end |
7.5% |
8.25% |
9.0% |
7.75% |
9.25% |
|
11.5% |
|
8.5% |
|
11.5% |
|
14.0% |
||||||||
|
|
|
|
|
|
|
|
|
|
|
|
|
|
|
|
|
|
|
|
||
Current account, $bn |
113 |
138 |
|
|
|
158 |
87 |
109 |
|
128 |
|
|
57 |
|
77 |
|
|
|
100 |
||
% of GDP |
6.6% |
10.1% |
|
8.3% |
5.4% |
7.1% |
|
8.9% |
|
3.9% |
|
5.6% |
|
7.9% |
|||||||
|
|
|
|
|
|
|
|
|
|
|
|
|
|
|
|
|
|
||||
External debt, $bn |
459 |
454 |
|
|
|
447 |
453 |
445 |
|
438 |
|
444 |
|
436 |
|
|
427 |
||||
% of GDP |
27% |
27% |
|
|
|
28% |
28% |
29% |
|
30% |
|
30% |
|
32% |
|
33% |
|||||
FX reserves, $bn |
572 |
564 |
|
|
|
550 |
544 |
531 |
|
522 |
|
514 |
|
507 |
|
|
502 |
||||
Months of imports cover |
25 |
26 |
|
|
|
26 |
26 |
27 |
|
27 |
|
|
27 |
|
28 |
|
|
|
30 |
||
|
|
|
|
|
|
|
|
|
|
|
|
|
|
|
|||||||
Budget balance, % of GDP |
3.4% |
3.7% |
4.2% |
2.0% |
2.4% |
|
3.0% |
|
0.5% |
|
1.0% |
|
1.6% |
||||||||
|
|
|
|
|
|
|
|
|
|
|
|
|
|
|
|||||||
GDP, RUBtrn |
110.1 |
110.1 |
110.3 |
107.3 |
108.1 |
|
109.2 |
|
103.5 |
|
105.3 |
|
107.1 |
||||||||
GDP, $bn |
1,723 |
1,659 |
|
1,572 |
1,618 |
1,526 |
|
1,443 |
|
1,456 |
|
1,375 |
|
1,274 |
|||||||
Source: Renaissance Capital estimates
http://new.guap.ru/i04/contacts |
3 |
|

vk.com/id446425943
Renaissance Capital
5 February 2019
Central Bank of Russia
Figure 9: Russia – key economic indicators
Ratings (M/S&P/F): Ba1/BBB-/BBB- |
EODB Rank: 31 (35) – Strong |
Corruption Rank: 135 (131) – Weak |
RenCap Legal score: 50 (56) – Middle |
|
|||||||||||||
|
2006 |
2007 |
2008 |
2009 |
2010 |
2011 |
2012 |
2013 |
2014 |
2015 |
2016 |
2017 |
2018E |
2019E |
2020E |
||
Activity |
|
|
|
|
|
|
|
|
|
|
|
|
|
|
|
|
|
Real GDP (% YoY) |
8.2 |
8.5 |
5.2 |
-7.8 |
4.5 |
4.3 |
3.5 |
1.3 |
0.7 |
-2.5 |
0.3 |
1.6 |
2.3 |
1.2 |
2.4 |
||
Private consumption (% YoY) |
|
12.2 |
14.3 |
10.6 |
-5.1 |
5.1 |
6.8 |
7.9 |
5.2 |
2.0 |
-9.4 |
-1.9 |
3.2 |
2.2 |
1.7 |
3.5 |
|
Government consumption (% YoY) |
2.3 |
2.7 |
3.4 |
-0.6 |
-1.5 |
1.4 |
2.6 |
0.9 |
-2.1 |
-3.1 |
1.4 |
2.5 |
0.9 |
0.4 |
0.4 |
||
Investment (% YoY) |
|
16.7 |
21.0 |
10.6 |
-14.4 |
5.9 |
9.1 |
5.0 |
1.3 |
-1.8 |
-11.2 |
0.7 |
5.5 |
2.3 |
1.5 |
3.6 |
|
Industrial production (% YoY) |
6.3 |
6.8 |
0.8 |
-9.2 |
8.3 |
4.8 |
2.5 |
0.3 |
1.7 |
-3.4 |
1.3 |
2.1 |
3.0 |
1.6 |
2.3 |
||
Unemployment rate (% YoY) |
|
7.2 |
6.1 |
6.3 |
8.4 |
7.5 |
6.6 |
5.5 |
5.6 |
5.3 |
5.9 |
5.3 |
5.1 |
4.9 |
4.8 |
4.9 |
|
Nominal GDP (RUBbn) |
26,917 |
33,248 |
41,277 |
38,807 |
46,309 60,283 68,164 73,134 79,200 |
83,101 |
86,010 |
92,089 102,245 107,303 112,552 |
|||||||||
Nominal GDP ($bn) |
|
990 |
1,299 |
1,658 |
1,224 |
1,523 |
2,050 |
2,199 |
2,293 |
2,052 |
1,353 |
1,285 |
1,579 |
1,628 |
1,618 |
1,643 |
|
Population (mn) |
142.8 |
142.8 |
142.7 |
142.9 |
142.9 |
143.0 |
143.3 |
143.3 |
143.7 |
146.8 |
147.1 |
147.4 |
147.7 |
147.9 |
148.1 |
||
GDP per capita ($) |
|
6,930 |
9,095 |
11,617 |
8,567 |
10,660 |
14,339 |
15,344 |
15,999 |
14,278 |
9,220 |
8,733 |
10,711 |
11,020 |
10,943 |
11,094 |
|
Gross domestic saving (% of GDP) |
29.0 |
29.3 |
28.8 |
19.4 |
24.4 |
29.2 |
27.8 |
24.6 |
25.0 |
26.8 |
25.9 |
26.5 |
27.3 |
27.8 |
27.3 |
||
Stock of bank credit to corp/ |
|
8,183 |
12,506 |
16,527 |
16,116 |
18,148 |
23,266 |
27,709 |
32,456 |
40,866 |
43,985 |
40,939 |
42,366 |
47,275 |
51,057 |
57,184 |
|
households (RUBbn) |
|
||||||||||||||||
|
|
|
|
|
|
|
|
|
|
|
|
|
|
|
|
||
Stock of bank credit to corp/ |
30.4 |
37.6 |
40.0 |
41.5 |
39.2 |
38.6 |
40.6 |
44.4 |
51.6 |
52.9 |
47.6 |
46.0 |
46.2 |
47.6 |
50.8 |
||
households (% of GDP) |
|||||||||||||||||
|
|
|
|
|
|
|
|
|
|
|
|
|
|
|
|
||
Deposits (RUBbn) |
|
8,340 |
11,890 |
14,749 |
17,131 |
21,081 |
26,082 |
30,120 |
34,931 |
43,814 |
51,907 |
50,003 |
53,703 |
60,147 |
65,561 |
72,117 |
|
Loan-to-deposit ratio |
98.1 |
105.2 |
112.1 |
94.1 |
86.1 |
89.2 |
92.0 |
92.9 |
93.3 |
84.7 |
81.9 |
78.9 |
78.6 |
77.9 |
79.3 |
||
|
|
|
|
|
|
|
|
|
|
|
|
|
|
|
|
|
|
Prices |
|
|
|
|
|
|
|
|
|
|
|
|
|
|
|
|
|
CPI (average % YoY) |
|
9.7 |
9.0 |
14.1 |
11.7 |
6.9 |
8.4 |
5.1 |
6.8 |
7.8 |
15.6 |
7.1 |
3.7 |
2.9 |
5.4 |
3.8 |
|
CPI (end-year % YoY) |
9.0 |
11.9 |
13.3 |
8.8 |
8.8 |
6.1 |
6.6 |
6.5 |
11.4 |
12.9 |
5.4 |
2.5 |
4.3 |
4.7 |
3.8 |
||
Nominal wages (monthly), RUB |
|
10,634 |
13,593 |
17,290 |
18,639 |
20,952 |
23,369 |
26,629 |
29,792 |
32,495 |
34,030 |
36,709 |
39,167 |
43,162 |
46,615 |
50,344 |
|
Wage rates (% YoY, nominal) |
24.3 |
27.8 |
27.2 |
7.8 |
12.4 |
11.5 |
14.0 |
11.9 |
9.1 |
4.7 |
7.9 |
6.7 |
10.2 |
8.0 |
8.0 |
||
|
|
|
|
|
|
|
|
|
|
|
|
|
|
|
|
|
|
Fiscal balance
Consolidated government balance (% of GDP)
Total public debt (% of GDP)
|
|
|
|
|
|
|
|
|
|
|
|
|
|
|
7.4 |
5.4 |
4.1 |
-5.9 |
-3.5 |
1.6 |
0.0 |
-0.8 |
-0.5 |
-2.6 |
-3.4 |
-1.4 |
2.0 |
2.0 |
0.8 |
|
|
|
|
|
|
|
|
|
|
|
|
|
|
|
11.1 |
9.1 |
7.8 |
11.1 |
11.7 |
11.0 |
9.9 |
13.0 |
14.8 |
15.7 |
16.5 |
15.5 |
14.2 |
15.2 |
16.1 |
|
|
|
|
|
|
|
|
|
|
|
|
|
|
|
|
|
|
|
|
|
|
|
|
|
|
|
|
|
|
|
|
External balance |
|
|
|
|
|
|
|
|
|
|
|
|
|
|
|
|
Exports ($bn) |
304.0 |
354.0 |
472.0 |
303.0 |
401.0 |
522.0 |
528.0 |
523.3 |
493.6 |
341.5 |
282.0 |
353.7 |
434.1 |
406.8 |
389.7 |
|
Imports ($bn) |
164.0 |
223.0 |
292.0 |
192.0 |
249.0 |
324.0 |
335.7 |
341.3 |
308.0 |
193.0 |
192.0 |
237.9 |
253.4 |
253.7 |
257.9 |
|
Trade balance ($bn) |
140.0 |
131.0 |
180.0 |
111.0 |
152.0 |
198.0 |
192.3 |
182.0 |
185.6 |
148.5 |
90.0 |
115.8 |
180.7 |
153.1 |
131.8 |
|
Trade balance (% of GDP) |
14.1 |
10.1 |
10.9 |
9.1 |
10.0 |
9.7 |
8.7 |
7.9 |
9.0 |
11.0 |
7.0 |
7.3 |
11.1 |
9.5 |
8.0 |
|
Current account balance ($bn) |
94.7 |
77.8 |
103.5 |
48.6 |
67.5 |
97.3 |
71.3 |
33.4 |
57.5 |
67.8 |
24.5 |
33.3 |
109.0 |
87.2 |
67.0 |
|
Current account balance (% of GDP) |
9.6 |
6.0 |
6.2 |
4.0 |
4.4 |
4.7 |
3.2 |
1.5 |
2.8 |
5.0 |
1.9 |
2.1 |
6.7 |
5.4 |
4.1 |
|
Gross FDI ($bn) |
37.6 |
55.9 |
74.8 |
36.6 |
43.2 |
55.1 |
50.6 |
69.2 |
22.0 |
6.9 |
32.5 |
28.6 |
15.0 |
12.0 |
12.0 |
|
Gross FDI (% of GDP) |
3.8 |
4.3 |
4.5 |
3.0 |
2.8 |
2.7 |
2.3 |
3.0 |
1.1 |
0.5 |
2.5 |
1.8 |
0.9 |
0.7 |
0.7 |
|
Current account balance plus FDI (% of |
13.4 |
10.3 |
10.8 |
7.0 |
7.3 |
7.4 |
5.5 |
4.5 |
3.9 |
5.5 |
4.4 |
3.9 |
7.6 |
6.1 |
4.8 |
|
GDP) |
||||||||||||||||
|
|
|
|
|
|
|
|
|
|
|
|
|
|
|
||
Exports (% YoY, value) |
24.6 |
16.4 |
33.3 |
-35.8 |
32.3 |
30.2 |
1.1 |
-0.9 |
-5.7 |
-30.8 |
-17.4 |
25.4 |
22.7 |
-6.3 |
-4.2 |
|
Imports (% YoY, value) |
31.2 |
36.0 |
30.9 |
-34.2 |
29.7 |
30.1 |
3.6 |
1.7 |
-9.8 |
-37.3 |
-0.5 |
23.9 |
6.5 |
0.1 |
1.7 |
|
Foreign exchange reserves ($bn) |
304 |
479 |
427 |
439 |
479 |
499 |
538 |
430 |
385 |
368 |
378 |
433 |
467 |
544 |
587 |
|
Import cover (months of merchandise imports) |
22.2 |
25.8 |
17.5 |
27.4 |
23.1 |
18.5 |
19.2 |
15.1 |
15.0 |
22.9 |
23.6 |
21.8 |
22.1 |
25.7 |
27.3 |
|
|
|
|
|
|
|
|
|
|
|
|
|
|
|
|
|
|
Debt indicators |
|
|
|
|
|
|
|
|
|
|
|
|
|
|
|
|
Gross external debt year-end ($bn) |
313 |
464 |
480 |
466 |
489 |
539 |
636 |
716 |
600 |
518 |
512 |
518 |
456 |
453 |
438 |
|
Gross external debt (% of GDP) |
32 |
36 |
29 |
38 |
32 |
26 |
29 |
31 |
29 |
38 |
40 |
33 |
28 |
28 |
27 |
|
Gross external debt (% of exports) |
103 |
131 |
102 |
154 |
122 |
103 |
121 |
137 |
122 |
152 |
181 |
146 |
105 |
111 |
112 |
|
Total debt service ($bn) |
109.1 |
171 |
167 |
154.4 |
158 |
177 |
205 |
230 |
179 |
128 |
134 |
137 |
140 |
135 |
131 |
|
Total debt service (% of GDP) |
11 |
13 |
10 |
13 |
10 |
9 |
9 |
10 |
9 |
9 |
10 |
9 |
9 |
8 |
8 |
|
Total debt service (% of exports) |
36 |
48 |
35 |
51 |
39 |
34 |
39 |
44 |
36 |
37 |
47 |
39 |
32 |
33 |
34 |
|
|
|
|
|
|
|
|
|
|
|
|
|
|
|
|
|
|
Interest & exchange rates |
|
|
|
|
|
|
|
|
|
|
|
|
|
|
|
|
Broad money supply (% YoY) |
48.7 |
43.5 |
0.8 |
17.7 |
31.1 |
22.3 |
11.9 |
14.6 |
2.2 |
11.4 |
9.2 |
9.5 |
10.5 |
8.5 |
11.0 |
|
Refinancing rate year-end (%) |
11.0 |
10.0 |
13.0 |
8.75 |
7.75 |
8.00 |
8.25 |
8.25 |
8.25 |
8.25 |
10.0 |
7.75 |
7.75 |
7.75 |
7.25 |
|
REPO rate year-end (%) |
6.5 |
6.5 |
9.5 |
6.0 |
5.0 |
5.25 |
5.50 |
5.50 |
17.0 |
11.0 |
10.0 |
7.75 |
7.75 |
7.75 |
7.25 |
|
Deposit rate year-end (%) |
2.3 |
2.8 |
7.25 |
4.0 |
3.0 |
4.00 |
4.25 |
4.50 |
16.0 |
10.0 |
9.0 |
6.75 |
6.75 |
6.75 |
6.25 |
|
3-month interest rate (MosPrime avg %) |
5.1 |
5.9 |
9.8 |
13.7 |
4.3 |
5.1 |
7.1 |
7.00 |
10.5 |
13.8 |
11.2 |
9.3 |
7.6 |
7.8 |
7.5 |
|
3-month rates minus $-LIBOR |
-0.1 |
0.6 |
6.8 |
13.0 |
4.0 |
4.8 |
6.7 |
6.8 |
10.3 |
13.5 |
10.4 |
8.0 |
5.3 |
4.8 |
4.4 |
|
Exchange rate (RUB/$) year-end |
26.3 |
24.5 |
29.4 |
30.2 |
30.5 |
32.1 |
30.5 |
32.7 |
56.2 |
72.9 |
61.5 |
57.7 |
69.4 |
68.0 |
70.0 |
|
Exchange rate (RUB/$) annual average |
27.2 |
25.6 |
24.9 |
31.7 |
30.4 |
29.4 |
31.0 |
31.9 |
38.6 |
61.4 |
67.0 |
58.3 |
62.8 |
66.3 |
68.5 |
|
Exchange rate (RUB/EUR) year-end |
34.7 |
35.9 |
42.7 |
43.3 |
40.8 |
41.7 |
40.3 |
44.9 |
68.4 |
79.6 |
64.7 |
69.3 |
79.5 |
81.6 |
86.8 |
|
Exchange rate (RUB/EUR) annual average |
34.1 |
35.0 |
36.5 |
44.1 |
40.3 |
40.9 |
39.9 |
42.4 |
50.9 |
68.1 |
74.1 |
65.9 |
74.0 |
78.2 |
83.6 |
Source: Rosstat, CBR, Finance Ministry, Federal Treasury, Bloomberg, IMF, World Bank, Renaissance Capital estimates
http://new.guap.ru/i04/contacts |
4 |
|

vk.com/id446425943
Davos edition 2019
Research
Institute
AI & The Future of Work
Thought leadership from Credit Suisse Research and the world's foremost experts
http://new.guap.ru/i04/contacts

vk.com/id446425943
Introduction
Big data and advances in computing power have triggered a technological revolution that have enormous bearing on the workplace and the labor market. Machines and robots are improving their capacities rapidly through artificial intelligence (AI) and innovations in design and structure. But how this digital revolution will affect firms, workers and their livelihoods is yet to be better understood.
Headline-grabbing assessments of the future of work predict polarizations and an increasing
number of individuals in good and bad jobs, while hollowing out the middle class. Trends since the
1970s confirm this specter of polarization in the USA and the UK, but so far not in continental European countries. However, while the future transformation will be profound, it may be relatively slow, leaving time for many workers
to adapt to the changes in the demand for labor.
There is an inherent difficulty for established companies to truly unleash the full potential of AI as their core strategy. It may now be time for management to think beyond the process of innovation, and also consider alternative budgeting approaches and capital structures to fuel the critical work surrounding AI.
Platforms that facilitate the exchange of goods and services are fostering an ever-growing gig economy, an employment concept in which people are paid for each specific short-term task. The most important challenge is to ensure that incomes are predictable and high enough to ensure a reasonable quality of life. However, too much regulation of freelance work could result in the curtailing or even demise of the gig economy.
While AI promises substantial advances in productivity, it should not threaten or violate human dignity. Accordingly, the legal and ethical challenges of free entrepreneurship and the need to gather vast amounts of data to develop AI are discussed in the final section of this report.
We hope that our findings will prove valuable and
I wish you a most insightful and enjoyable read.
Urs Rohner
Chairman of the Board of Directors
Credit Suisse Group AG
2
http://new.guap.ru/i04/contacts

vk.com/id446425943
02 Introduction
05
What technological change means for the future of work
Rafael Lalive
Daniel Oesch
11
How to make AI transformation more likely to succeed
Howard Yu
Jialu Shan
21
Economic security in the gig economy
Giuliano Bonoli
27
AI: Legal and ethical challenges
Bettina Hummer
31 References
34
About the authors
36
General disclaimer / important information
CREDIT SUISSE AG
Research Institute Paradeplatz 8 CH-8070 Zurich Switzerland
research.institute@credit-suisse.com credit-suisse.com/researchinstitute
http://new.guap.ru/i04/contacts |
AI & The Future of Work |
3 |
|
|

vk.com/id446425943
4
http://new.guap.ru/i04/contacts

vk.com/id446425943What technological change means for the future of work
Rafael Lalive and Daniel Oesch
University of Lausanne
Big data and advances in computing power have triggered a technological revolution that may have enormous bearing on the workplace and the labor market. Machines and robots are improving their capacities rapidly through artificial intelligence (AI) and innovations in design and structure. Digital assistants organize schedules, plan trips, and provide answers
to many questions people have. Autonomous cars drive around on our streets and can bring customers from the pick-up point to any place they desire.
These developments in technology are exciting, and bring enormous improvements, especially for consumers and entrepreneurs, but they also fuel fears that expanding artificial intelligence and machine capabilities may make humans obsolete in the production process. Our objective is to discuss how and why these fears come about, whether they were true in the recent past, and to what extent they will apply in the near future. Specifically, we first sketch a framework that allows us to discuss the effects of machines on employment. This framework is an abstraction of the real world, but is useful to assess how machines affect employment.
Second, we review how technology has affected employment in the recent past. Third, we discuss what the future of work could look like.
Analytical framework
We adopt a framework developed by Acemoglu and Autor (2011) on task allocation to discuss how technology affects employment. The framework starts with the premise that firms employ workers to fulfill tasks. A task is a unit of work that is directly needed in production. Tasks differ in terms of complexity. Workers supply effort to perform tasks and differ in terms of their skills, where “skill” refers to the capability to perform tasks. Simple tasks can be performed easily by skilled and unskilled workers, but complex tasks
http://new.guap.ru/i04/contacts
can only be performed easily by skilled workers. Workers earn wages that are in line with their skills. In this context, firms will allocate tasks in a very intuitive fashion. The low-skilled workers perform the least complex tasks because their comparative advantage, the ratio of output to cost, is highest in these tasks. The high-skilled workers will perform the most complex tasks, and intermediate-skilled workers perform the skills of intermediate complexity. Workers perform the tasks that correspond to their level of skill.
Technology in the form of machines, robots or digital assistants competes with humans for tasks. Machines in factories and computers in workplaces have taken on the repetitive, but cognitively demanding work of, for instance, office clerks (automatic teller machines). Fewer workers with intermediate skills are needed to execute tasks of intermediate complexity, and these workers then compete with both lowskilled and high-skilled workers for lowand high-complexity tasks. Intermediate-level jobs will fare less well, with lower employment and lower wages. According to this line of reasoning, technology has led to a hollowing out of the middle class, a phenomenon called polarization. However, technology may also have been used to replace workers of low complexity. In this case, employment in highly-paid jobs grows
AI & The Future of Work |
5 |
vk.com/id446425943
strongest, and lower-paid jobs disappear, a phenomenon called educational upgrading. The framework identifies the primary drivers of the employment effects of technology, but only empirical analysis can tell which of the two scenarios, polarization or upgrading, is more relevant.
Machines and employment in the recent past
The view that the labor markets are polarizing has become widely accepted in economics
(Autor and Dorn 2013, Goos et al. 2014). So far, the empirical evidence for job polarization is largely limited to the USA and the UK (Wright and Dwyer 2003, Goos and Manning 2007, Autor and Dorn 2013). In contrast, most studies for Western Europe point toward the upgrading of the occupational structure (Fernandez-Macias 2012, Oesch 2013, Fernandez-Macias and Hurley 2016), which is particularly true for Switzerland (Murphy and Oesch 2018).
We assess whether polarization or upgrading is relevant for four large European economies,
Germany, Spain, Sweden and the UK. Changes in the employment structure can be empirically
analyzed by adopting the analytical strategy of job-quality quintiles (Wright and Dwyer 2003).
Its building blocks are occupations that are rankordered on the basis of their median earnings. These rank-ordered occupations are then grouped into five job-quality quintiles, with quintile 1 comprising the least-paid – and thus least-skilled – occupations and quintile 5 comprising the best-paid – and thus most advantageous – occupations. Each quintile comprised 20% of total employment at the beginning of the period under study, i.e. the early 1990s.
This allows us to calculate occupational change up to 2015 by tracing employment changes in each of the five quintiles.
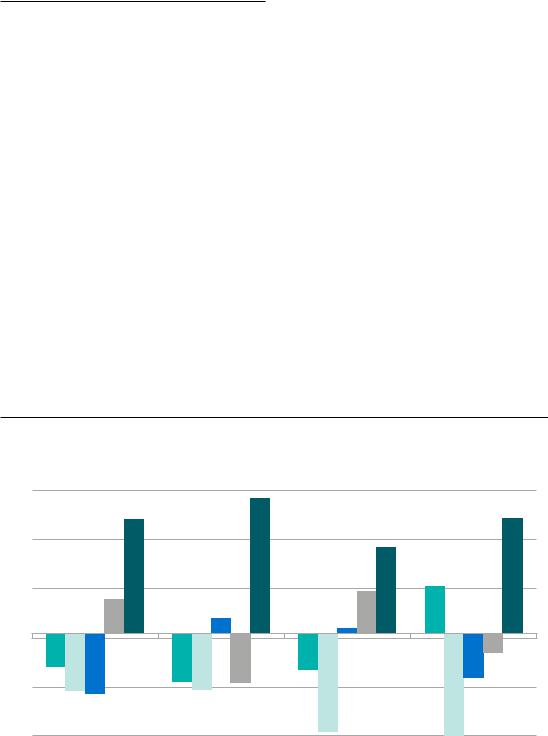
Figure 1 shows the pattern of occupational change for Germany, Spain, Sweden and the
UK over the last two decades. In each one of these four European countries, employment expanded most strongly in the top quintile and either fell or stagnated in the three lowest
job-quality quintiles. The pattern of occupational upgrading is clear-cut in Germany, Sweden and Spain, whereas it has a polarizing thrust in the UK, where employment also increased in the least-paid occupations.
Figure 1: Relative change in employment across job-quality quintiles 1992–2015
In percentage points
15
10
5
0
-5
-10
|
Germany |
|
|
Spain |
|
|
Sweden |
UK |
|||
|
Quintile 1 (bottom) |
|
Q2 |
|
|
Q3 |
|
Q4 |
|
Quintile 5 (top) |
|
|
|
|
|
|
|
||||||
|
|
|
|
|
|
||||||
Data: EU-LFS (Labor Force Survey) 1992–2015 for Germany, Spain and the UK, 1997–2015 for Sweden.
Reading example: in Germany 1992–2015, the share of total employment set in the lowest-paid occupations of quintile 1 fell by 3.3 percentage points, whereas it increased by 11.7 percentage points in the highest-paid occupations of quintile 5.
Source: Oesch and Piccitto (forthcoming).
6
http://new.guap.ru/i04/contacts
vk.com/id446425943
Over the last three decades, European economies have been most successful in the automation and offshoring of low-paid, low-skilled and low-status occupations such as farm workers and plant operators, data-entry clerks and sales assistants. In parallel, job expansion was most vigorous among higher-paid and better-skilled positions in management and the professions (Oesch 2013).
As a result, labor-market opportunities expanded for the salaried (upper) middle class, whereas the core of the traditional working class and subordinate white-collar employees lost ground.
For the polarization thesis to hold, we should also have observed job growth in low-skilled services among interpersonal service workers. However, this mostly female class did not substantially increase its employment share in Western Europe
(Oesch and Piccitto, forthcoming).
While the doom scenario of polarization and middle-class erosion may make newspaper headlines, it is not in line with the secular trends in Western Europe’s employment structure. Given the extent of educational expansion over the last few decades, this is good news. As technical colleges and universities were sending out highly educated workers in greater numbers, the economy was also creating more jobs in occupations requiring higher education. However, it is an altogether different question whether upgrading trends from the past translate into the future.
Disruption versus continuous change
Adopting the framework we sketched out earlier, Frey and Osborne (2017) questioned a group of machine learning experts and examined job descriptions to identify computerization bottleneck tasks that would preclude an occupation from being computerized. They estimated the share of jobs that are exposed to automation to account for 47% of total employment in the USA.
However, other scholars present very different assessments of how technology will affect the labor market of the future. Two recent OECD studies expect that 9%–14% of all jobs could be easily automated in the near future (Arntz et al. 2016, Nedelkovska and Quintini 2018). Since the OECD studies focus on individual tasks rather than entire occupations, the estimates therefore diverge widely and are very sensitive to assumptions. They point to two very distinct future scenarios: a first scenario predicts a deep break with sudden and disruptive changes, while a second scenario holds continuous and progressive change as more likely.
Automation and employment: The scenario of disruptive change
According to the scenario of disruptive change, the next wave of automation should replace employment in a wide range of activities, including agriculture, industrial production and logistics (through robotization), ground transportation (through unmanned machinery), secretarial and administrative support (through new software and Big Data), sales (through self-checkout), cleaning (through robots) and even construction (through prefabrication).
Most studies suggest that the degree of automation is negatively correlated with the level of training in a given profession. Low-skilled occupations would therefore be more exposed to technological change than occupations requiring a high level of training. More specifically for Switzerland, a recent analysis suggests that vocational education and training (VET) graduates are more threatened by automation than university graduates. While 65% of the jobs held by the former would be threatened, this is only the case for 25% of the jobs held by academics.
The disruption scenario predicts de-industrial- ization and therefore a decreasing demand for production workers employed in manufacturing.
Through its impact on the secretariat, payment management, IT maintenance and e-com- merce, digitalization would also jeopardize the jobs of commercial employees, sales assistants and retail managers. More generally, structural changes in the labor market should mainly affect the weakest areas – both in terms of educational level and geographical setting, with the peripheral regions of countries being more affected than the service centers of large cities.
Automation and employment:
The scenario of continuous change
The second scenario predicts a much more gradual change. Widespread automation will not take years, but decades in the second scenario – and will depend on various factors such as the feasibility and costs of new technological solutions as well as their legal, social and political acceptance.
The technical feasibility of automating a process does not necessarily mean that an activity will be automated and employment will disappear any time soon. Moreover, workers continuously adapt to technological change and the multiple tasks that make up an occupation will constantly evolve over time.
Some tasks appear difficult to automate, especially if they involve social skills (negotiating, coordinating, teaching or care-giving) or creative skills (inventing new products and services, creating art and culture). Therefore, automation does not seem to threaten the bulk of employment in areas such as management,
http://new.guap.ru/i04/contacts |
AI & The Future of Work |
7 |
|
|

vk.com/id446425943
engineering, science, education, medicine, culture or the police. New product innovation will create new tasks, and new tasks are typically given to workers who explore and develop them before they are encoded and entrusted to a machine.
New technologies will certainly lead to a decrease in jobs in some occupations and industries. Yet, at the same time, they will also generate many new jobs. By way of illustration, it can be noted that, despite strong technological progress, more than 860,000 net jobs have been created in
Switzerland over the last two decades. The
Federal Council (2017) therefore expects the adoption of digital technology, as with previous technological innovations, to contribute to job growth in Switzerland. While studies are abundant on jobs that are lost through automation, it is very difficult to estimate the number of new jobs that will be created as a result of the digital shift.
Overall, this second scenario is therefore much more optimistic. However, it does not deny that there is a need to continually adapt the population’s skills.
Which jobs in the future?
Using the second step-by-step scenario as a starting point, the employment evolution can be projected for different occupational groups using two sources. The US Bureau of Labor Statistics provides projections for employment trends between 2016 and 2026. These projections do not share the alarmism of the disruptive scenario.
On the contrary, it forecasts an increase in total employment of 7% between 2016 and 2026.
For five occupational groups, growth is expected to be much higher. The most spectacular surge is predicted for workers in health care (+24%) and personal services (+15%), particularly among home helpers, care givers and medical assistants. Two other major groups that are also expected to grow strongly are health specialists, including therapists and nurses (+15%) and computer and mathematical experts (+15%).
The largest decline is projected in the USA for production occupations (–4%), particularly among metal and mechanical engineering
workers. Employment is expected to stagnate in the agricultural trades as well as in administrative support jobs, commonly associated with the back office (0%). A third intermediate group includes occupations that are expected to grow at the same rate as the overall labor market, such as jobs in construction, catering, management and education.
A plausibility test consists of comparing these projections with the indicators that assess the current employment demand for skilled labor in
Switzerland (shortage indicators). As structural
changes in the labor market are slow, these indicators should provide us with information on the evolution of the labor market in the coming years. Shortage indicators also suggest that labor demand will remain particularly vigorous in health, where many jobs have been created over the last fifteen years (State Secretariat for Economic Affairs [SECO] 2016). It is likely that demographic aging will continue to stimulate demand for manpower in an area where the potential for automation seems limited. In
Switzerland, however, it is mainly the highly qualified professions – such as doctors or pharmacists – that are showing signs of shortage, while this is less the case for, say, dental assistants or pharmacy assistants. Switzerland also has a shortage in the so-called “MINT” professions (mathematics/information technology/natural sciences/technology) among engineers and computer scientists, as well as among specialists in management, law and education. Finally, there are no visible shortages in agriculture, the food industry, textiles, catering, commercial and administrative professions or cleaning. In
general, occupations showing the most signs of shortages have training requirements that are significantly higher than average, while the opposite is true for occupations with no shortages
(SECO 2016).
New technologies will certainly lead to a decrease in jobs in
some occupations and industries. Yet, at the same time, they will also generate many new jobs.
Technology will affect how firms recruit workers. In many markets, many workers want the same job, and many employers want the same worker.
This situation generates the problem of congested labor markets. All workers apply to the same firm, all employers invite the same candidate, and both workers and firms need to wait until the market clears. Digital platforms can use information about the preferences of workers and firms, a bit like the online dating app Tinder does
8
http://new.guap.ru/i04/contacts

vk.com/id446425943
in the context of matching partners. Additional information will help speed up the matching process, especially if the market provides workers and firms with information on the feasibility of matches. More information can also lead to more inequality because information helps workers and firms pair up exactly, while currently luck is an important element of forming an employment relationship.
Conclusion
Are we heading toward a future where computers, robots and AI replace human labor and lead to mass unemployment? Warnings about a future of widespread technological unemployment are as old as the industrial revolution. They have been periodically voiced, most prominently by Jeremy Rifkin in 1992 with his book “The End of Work.” When Rifkin made his prophecy of a jobless future, the USA had a civilian labor force of 118 million people. In
2018, civilian employment increased to 155 million people – a figure that becomes truly astounding when compared to the 29 million gainfully employed workers in 1900 – among whom 40% were still employed in agriculture. Despite the huge labor-saving potential of combustion engines, assembly lines, nuclear power and micro-chips, many more people are working today in the USA than 120 years ago
– and the USA is not alone. Between 1950 and 2015, the total volume of work performed in Switzerland grew from 5.5 billion to 7.8 billion working hours (Siegenthaler 2017).
How can labor-saving technology be introduced without leading to the end of work? Computers and robots will only be used where they lead to productivity gains and, consequently, additional income. These productivity gains can benefit three groups of stakeholders: (1) the workforce whose productivity has increased in the form of wage increases; (2) business owners who benefit from an increase in their profits; or
(3) consumers who benefit from lower prices. In practice, productivity gains tend to benefit all three groups to some extent. These three groups will then use their increased income to acquire more goods and services, which should in turn lead to employment growth.
Hence our argument would be that there is no shortage of work to be done in contemporary economies. Rather, there is a lack of financial means to pay for all the work that would be socially desirable. It suffices to think of the development and maintenance of public infrastructure (public transport), healthcare (care of the elderly) or education (affordable quality pre-schools).
Rather than a jobless economy, the two great challenges in the labor market may then be massive dislocation on the one hand and the distribution of productivity gains on the other. While technological change will not lead to the end of work, it will certainly displace people from occupations and sectors. In this context, broad access to initial and further education will become increasingly important for people’s life chances. Likewise, popular support for technological progress may grow weak and weaker if the resulting productivity gains continue to be pocketed by a small elite of winners – rather than be shared widely across the workforce as was the case during the post-war decades.
Western societies benefited in the post-war decades from an institutional framework that responded well to the technological challenge created by Fordist mass production: the Keynesian class compromised with full-employment policies, strong unions and the development of the welfare state. The
democratic challenge of the next decades will be to develop a new institutional framework that allows modern societies to fully harness – and broadly share – the potential of the digital revolution.
http://new.guap.ru/i04/contacts |
AI & The Future of Work |
9 |
|
|

vk.com/id446425943
10
http://new.guap.ru/i04/contacts

vk.com/id446425943How to make AI transformation more likely to succeed
Howard Yu and Jialu Shan
IMD
To get the most out of artificial intelligence (AI), companies need more than just data, infrastructure, and off the-shelf analytics; they need to redesign their investment processes. In this chapter, we examine the inherent difficulty for established companies to truly unleash the full potential of AI as their core strategy. We conclude that senior executives must think beyond the process of innovation as well as consider an alternative budgeting approach and capital structure to fuel the critical work surrounding AI.
What are we learning about artificial intelligence in financial services?” asked Ms. Lael Brainard, one of the seven members of the Board of Governors of the US Federal Reserve. “My focus today is the branch of artificial intelligence known as machine learning, which is the basis of many recent advances and commercial applications,” the governor told her audience in Philadelphia,
Pennsylvania. “Due to an early commitment to open-source principles, AI algorithms from some of the largest companies are available to even nascent start-ups... So it is no surprise that many financial services firms are devoting so much money, attention, and time to developing and using AI approaches.”
JPMorgan Chase is reportedly devoting some USD 10.8 billion to its tech budget in 2018.
Europe’s largest bank, HSBC, is spending USD
15 billion on new technology. And the biggest spender of all, Bank of America, has set an annual global budget of nearly USD 16 billion for technology and operations. That figure is at least USD 3 billion more than Intel, Microsoft or Apple spent on research and development in
2018. As Andrew S. Grove, the long-time chief executive and chairman of Intel Corporation, told a Stanford researcher in 1991, “Don’t ask managers, ‘What is your strategy?’ Look at what they do!
Because people will pretend.” Whether they are pretending or not, the resource allocation patterns suggest that banks are now effectively IT companies.
What Grove saw as the actual strategy of a firm is the cumulative effect of day-to-day prioritizations or decisions made by middle managers, engineers, salespeople, and financial staff – decisions that are made despite, or in the absence of, intentions. And that
is where the problem lies. Money for new investments accounted for only 27% of bank spending on information technology in 2017.
According to Celent, a research and consulting company based in Boston, the rest – close to 73% of spending – was allocated to system maintenance. Of the nearly USD 10 billion JPMorgan Chase spent on IT in 2016, only USD 600 million was in fact devoted to fintech solutions and projects for mobile or online banking, although CEO Jamie Dimon warned shareholders in his letter that “Silicon
Valley is coming.”
This knowing-doing gap is no simple pretension by senior leadership. Financial institutes we have spoken with have (1) all organized employee seminars inviting motivational speakers to talk about innovation; (2) established corporate venture funds to invest in innovative startups;
http://new.guap.ru/i04/contacts |
AI & The Future of Work |
11 |
|
|

vk.com/id446425943
(3) practiced open innovation, posted challenges online, and run tournaments with external inventors; (4) organized “design thinking” workshops for employees to re-think customer solutions outside the mainstream; and (5) installed Lean Startup methodologies that allow employees to fail fast
in order to succeed early. So widespread is the innovation process, and yet, managers continue to face unyielding organizations whose core business is being encroached on by Google and
Amazon, if not Tencent or Alibaba or some other digital upstarts. “Tell me one thing that I should do but haven’t done,” hissed an executive the moment we mentioned Google Venture. It seems that no matter how hard these in-house innovation experts try, their companies simply will not budge.
The ships are not just big; they cannot turn. Why?
Seizing a window of opportunity is not necessarily about being the first, but
about getting it right first.
Too many innovation experts are focusing solely on the nuts and bolts of everyday implementation: gathering data, tweaking formulas, iterating algorithms in experiments and different combinations, prototyping products, and experimenting with business models. They often forget that the underlying technologies – AI in this case – never stay constant. Seizing a window of opportunity is not necessarily about being the first, but about getting it right first. In this instance, that means getting it right for banking clients. Doing so takes courage and determination, as well as vast resources and deep talent. But the banking industry is not where
Silicon Valley comes first – the auto industry is.
How likely is it that your industry will be disrupted by the Valley?
No automaker today would speak to investors without mentioning “future mobility.” BMW is “a supplier of individual premium mobility with
innovative mobility services.” General Motors aims to “deliver on its vision of an all-electric, emis- sions-free future.” Toyota possesses the “passion to lead the way to the future of mobility and an enhanced, integrated lifestyle.” And Daimler,
maker of Mercedes, sees the future as “connected, autonomous, and smart.” In contrast to the personally owned, gasoline-powered, human-driven vehicles that dominated the last century, automakers know they are transitioning to mobility services based on driverless electric vehicles paid for by the trip, by the mile, by monthly subscription, or a combination of all three. In the past, mobility was created by individual cars automakers sold; in the future, mobility will be produced by service companies operating various kinds of self-driving vehicles in fleets over time. At the
BMW Museum, anyone can witness the gravity of this vision first-hand, articulated by its chairman of the board.
Walking up the spiral ramp of a rotunda inside the BMW Museum, one sees flashes of pictures about BMW history that display in variable sequences, slipping in and out of view like mirages. At the very top of the museum is a “themed area” of about 30 stations demon-
strating an emissions-free, autonomously driven future. These are not only a vision, but a real project, begun in earnest in the autumn of 2007 by then-CEO Norbert Reithofer and his chief strategist Friedrich Eichiner. The two men tasked engineer Ulrich Kranz, who had revived the Mini brand in 2001, to “rethink mobility.”
The task force soon grew to 30 members and moved into a garage-like factory hall inside BMW’s main complex.
“I had the freedom to assemble a team the way I wanted. The project was not tied to one of the company’s brands, so it could tackle any problem,” Kranz said in an interview with Automotive News Europe in 2013. “The job was to position
BMW for the future—and that was in all fields: from materials to production, from technologies to new vehicle architectures.” And so Kranz and his team decided to explore uncharted territory that included “the development of sustainable mobility concepts, new sales channels, and marketing concepts, along with acquiring new customers.” The starting point for “Project i” was, in other words, a blank sheet of paper.
“We traveled to a total of 20 megacities, including Los Angeles, Mexico City, London, Tokyo, and Shanghai. We met people who live in metropolises and who indicated that they had a sustainable lifestyle. We lived with them, traveled with them to work, and asked questions,” Kranz recalled. “We wanted to know the products that they would like from a car manufacturer, how their commute to work could be improved, and how they imagined their mobility in the future. As a second step, we asked the mayors and city planners in each metropolis about their infrastructure problems, the regulations for internal combustion engines, and the advantages of electric vehicles.”
12
http://new.guap.ru/i04/contacts

vk.com/id446425943
Once the findings came back, Kranz expanded his team by seeking out “the right employees both internally and externally.” The result was BMW’s gas-electric i8 sports coupe and all-electric i3 people mover, which shimmered under white lights at BMW World, where
the company’s top automotive offerings are showcased. The i3 had almost no hood, and the front grille was framed by plastic slits that looked like a pair of Ray-Bans. It came in a fun-looking burnt orange. The front seats were so vertically poised, with the dashboard stretching out, that they exuded a “loft on wheels” vibe. Like the interior, made of recycled carbon fiber and faux-wood paneling, the electric motor of the i3 was geared to urban dwellers in megacities who yearned for a calm, relaxing drive.
What made BMW all the more remarkable was its timing. Almost two years before Tesla’s
Model S was introduced, BMW had presented the battery-powered car as a revolutionary product, and committed to build it and deliver it to showrooms by 2013. When the BMW i3 went on sale, Tesla’s Model S had spent just over a year on the US market. The 2014 i3 went on to win a World Green Car award, as did the 2015 model, the i8. In short, BMW was fast and early.
Then something terrible happened – or really nothing happened.
The i3 is now five years old, and the i8 is four.
The BMW i brand includes the services Drive-
Now and ReachNow (car sharing), ParkNow (to find available parking), and ChargeNow (to find charging stations). But, besides being featured in occasional press releases, Project i has given way to other BMW sports cars in prime-time TV advertising spots. There is no news from Project i, except that project members are reportedly leaving. Ulrich Kranz, the former manager, joined former BMW CFO Stefan Krause at Faraday
Future, and after a short stay, they started Evelozcity in California, where they recruited another i-model designer, Karl-Thomas Neuman. And Kranz is not alone. Carsten Breitfeld, former i8 development manager, is now CEO of Byton, where he also enlisted a marketing expert and a designer from the BMW team.
How much Project i has cost BMW, we will never know. But if, according to BMW figures, the carbon-fiber production and the autobody works for the i3 set the company back some half a billion euros, the entire project could easily have cost two to three billion – a sum that would have been enough for the development of two to three series of a conventional VW Golf or Mercedes
S-Class. Two to three billion euros is also more than fifteen times the USD 150 million Apple spent to develop the first iPhone, which launched
in 2007. With so much bleeding, the new CEO Harald Krüger talked of Project i 2.0, a plan to integrate the BMW i sub-brand back into the parent company, and refocus distribution efforts on “classic” products.
In 2018, BMW USA reported just 7% of its sales were cars with a plug, which included all its hybrid offerings. Meanwhile, Tesla reported booming sales of its Model 3, which has become one of the USA’s top 20 most-sold vehicles
in the third quarter of 2018. Tesla was ranked fourth in luxury car sales during the same quarter.
At the time of writing, Tesla has surpassed BMW and Daimler to become the world’s second most valuable automaker in terms of market capitalization, trailing only Toyota.
Then something terrible happened
– or really nothing happened.
Did Tesla and other start-up companies steal
BMW’s idea and run with it? No, it is what is called the Zeitgeist, a German word meaning “spirit of the time.” When the time is ripe, the ideas are “in the air.” Competition invariably emerges, and companies have to improve their ideas to stay ahead. They need to come up with demonstrations that excite potential customers, potential investors and, more importantly, potential distributors.
BMW’s shift in its distribution of the i sub-brand echoes what Kodak did. Kodak built the first digital camera back in 1975 and was the first to put out a competent product, but then ended up folding its consumer digital and professional divisions back into the legacy consumer film divisions in 2003. Meanwhile, Nikon, Sony, and Canon kept innovating in the subsequent decades, with features like face detection, smile detection, and in-camera red-eye fixes. We all know what eventually happened to Kodak.
How to become future-ready
BMW is by no means a laggard in innovation.
At IMD business school in Switzerland, we track how likely a firm is to successfully leap toward a new form of knowledge. For automakers, it is the shift from mechanical engineering, with
http://new.guap.ru/i04/contacts |
AI & The Future of Work |
13 |
|
|
vk.com/id446425943
combustion-engine experts, to electric and |
Table 1: Top 55 automakers and component suppliers |
|
|
||||
programming experts of the same kind as those |
Company |
|
Score |
Rank |
|||
who build computers, mobile games, and hand- |
|
||||||
held devices. For consumer banking, it is the |
|
|
|
|
|
|
|
Tesla Inc. |
|
100 |
|
|
1 |
|
|
shift from operating a traditional retail branch |
|
|
|
|
|||
General Motors Company |
98.357 |
|
2 |
||||
with knowledgeable staff who provide investment |
|
|
|
||||
advice to running data analytics and interacting |
Volkswagen A.G. |
|
93.221 |
|
|
3 |
|
with consumers the same way an e-commerce |
Ford Motor Co. |
|
82.265 |
|
|
4 |
|
retailer would. The pace of change may differ |
Toyota Motor Corporation |
|
82.235 |
|
|
5 |
|
between industries, but the directional shift is |
Nissan Motor Co., Ltd. |
|
81.442 |
|
|
6 |
|
undeniable. |
Bayerische Motoren Werke A.G. |
|
71.473 |
|
|
7 |
|
|
Daimler A.G. |
|
69.570 |
|
|
8 |
|
|
|
|
|
|
|
|
|
The IMD ranking measures companies in each |
Peugeot S.A. |
|
63.488 |
|
|
9 |
|
industry sector using hard market data that is pub- |
Visteon Corporation |
|
59.146 |
|
|
10 |
|
licly available and has objective rules, rather than |
Honda Motor |
|
56.223 |
|
|
11 |
|
relying on soft data such as polls or subjective |
AB Volvo |
|
53.885 |
|
|
12 |
|
judgments by raters. Polls suffer from the tyranny |
Renault |
|
47.907 |
|
|
13 |
|
of hype. Names that get early recognition get |
Ferrari N.V. |
|
47.710 |
|
|
14 |
|
greater visibility in the press, which accentuates |
Robert Bosch Gmbh |
|
47.094 |
|
|
15 |
|
their popularity, leading to a positive cascade in |
Fiat Chrysler Automobiles N.V. |
|
43.215 |
|
|
16 |
|
their favor. Rankings based on polls also overlook |
Brilliance China Auto Holdings |
|
42.935 |
|
|
17 |
|
fundamental drivers that fuel innovation, such as |
Audi A.G. |
|
42.428 |
|
|
18 |
|
the health of a company’s current business, the |
Continental A.G. |
|
41.911 |
|
|
19 |
|
diversity of its workforce, the governance struc- |
Valeo S.A. |
|
41.208 |
|
|
20 |
|
ture of the firm, the amount it invests in outdoing |
Denso Corporation |
|
38.351 |
|
|
21 |
|
competitors, the speed of product launches, and |
Cooper-Standard Holdings Inc. |
|
36.989 |
|
|
22 |
|
so on. According to an objective composite index |
Baic Motor Corporation Ltd. |
|
35.015 |
|
|
23 |
|
like this one, BMW is among the best. Table 1 |
Skoda Auto, A.S. |
|
34.876 |
|
|
24 |
|
shows the ranking of the top 55 automakers and |
Guangzhou Automobile Group |
|
33.444 |
|
|
25 |
|
component suppliers. The methodology of the |
Yamaha Motor Co., Ltd |
|
32.383 |
|
|
26 |
|
ranking is described in the appendix. |
Fuyao Glass Group Industries |
|
31.058 |
|
|
27 |
|
|
Hyundai Motor Co., Ltd. |
29.133 |
|
|
28 |
|
|
|
|
|
|
|
|
|
|
But the index also points to the general conser- |
Jaguar Land Rover Ltd. |
|
28.849 |
|
|
29 |
|
vatism of large companies. Most radical ideas |
Aptiv Plc. |
|
28.638 |
|
|
30 |
|
fail, and large companies cannot tolerate failure. |
Suzuki Motor Corporation |
|
27.926 |
|
|
31 |
|
It does not matter whether you call BMW’s strat- |
Byd Company Ltd. |
|
27.702 |
|
|
32 |
|
egy “throw everything at the wall and see what |
Geely Automobile Holdings Ltd. |
|
27.568 |
|
|
33 |
|
sticks” or a groundbreaking, iterative approach |
Magna International Inc. |
|
27.077 |
|
|
34 |
|
to mobility; if the only way to innovate is “to put |
Mitsubishi Motors Corporation |
|
24.689 |
|
|
35 |
|
a few bright people in a dark room, pour in some |
Chaowei Power Holdings Ltd. |
|
24.134 |
|
|
36 |
|
money, and hope that something wonderful will |
Mazda Motor Corporation |
|
22.551 |
|
|
37 |
|
happen,” Gary Hamel once wrote, “the value |
Subaru Corporation |
|
22.213 |
|
|
38 |
|
added by top management is low indeed.” |
Tata Motors Ltd. |
|
21.093 |
|
|
39 |
|
|
Beiqi Foton Motor Co., Ltd. |
20.672 |
|
|
40 |
|
|
|
|
|
|
|
|
|
|
But it is not just about cars. The dilemma |
Kia Motors Corporation |
|
17.535 |
|
|
41 |
|
experienced by German automakers is strikingly |
Isuzu Motors Ltd. |
|
17.462 |
|
|
42 |
|
similar to the ones facing executives in banking |
TS Tech Co., Ltd. |
|
17.074 |
|
|
43 |
|
and a host of other industries these days. Just |
Haima Automobile Group Co. |
|
13.603 |
|
|
44 |
|
as Detroit is confronted by Silicon Valley, Wall |
Paccar Inc |
|
11.671 |
|
|
45 |
|
Street can see the future of banking every- |
Aisin Seiki Co., Ltd. |
|
11.655 |
|
|
46 |
|
where it looks. Turning to China, it sees Alibaba, |
Saic Motor Corporation Limited |
|
10.135 |
|
|
47 |
|
whose AliPay has become synonymous with |
Mahindra & Mahindra Limited |
|
8.539 |
|
|
48 |
|
mobile payment, and Ant Financial, Alibaba’s |
Harley-Davidson, Inc. |
|
7.375 |
|
|
49 |
|
finance subsidiary, which is now worth USD 150 |
China Faw Group Co., Ltd. |
|
6.358 |
|
|
50 |
|
billion – more than Goldman Sachs. Looking |
Anhui Jianghuai Auto Group |
|
5.043 |
|
|
51 |
|
homeward, it sees that start-ups like Wealth- |
Jiangling Motors Corporation |
|
4.127 |
|
|
52 |
|
front, Personal Capital, and Betterment have all |
Dongfeng Motor Group Co., Ltd. |
|
2.925 |
|
|
53 |
|
launched robo-advisors as industry disruptors. In |
Chongqing Changan Auto Co. |
0.181 |
|
|
54 |
|
|
retail checkout lanes, it sees Square or Clover or |
Great Wall Motor Co., Ltd. |
|
0 |
|
|
55 |
|
Paypal Here taking in credit card payments on |
Source: see Appendix |
|
|
|
|
|
|
behalf of millions of small-time merchants. It sees that the future of banking is not only
about Big Data analytics, but also about calling
14
http://new.guap.ru/i04/contacts

vk.com/id446425943
on and bundling a group of financial services that happen in real time and with little human interaction. A smart infrastructure that automatically interacts with customers, continuing to improve its algorithm and adjust its response without human supervision as it handles data gushing in from all around the world at millions of bytes per minute, is tantamount to one giant leap forward for every banking incumbent.
Deep-learning-based programs can already decipher human speech, translate documents, recognize images, predict consumer behavior, identify fraud, and help robots “see.” Most computer experts would agree that the most direct application of this sort of machine intelligence is in areas like insurance and consumer lending, where relevant data about borrowers – credit score, income, credit card history – is abundant, and goals such as minimizing default rates can be narrowly defined. This explains why, today, no human eyes are needed to process any credit request below
USD 50,000. For these businesses, the question of where and how to deploy AI is easy to answer: find out where a lot of routine decisions are made, and substitute algorithms for humans.
But data can be expensive to acquire, and investment conventionally involves a trade-off between the benefit of more data and the cost of acquiring it. For many traditional banking incumbents, the path to AI is anything but straightforward. Managers are often tasked with considering how many different types of data are needed. How many different sensors are required to collect data for training? How frequently does the data need to be collected?
More types, more sensors, and more frequent collection mean higher costs along with the potentially higher benefit. In thinking through this decision, managers are asked to carefully determine what they want to predict, guided by the belief that this particular prediction exercise will tell them what they need to know. This thinking process is similar to the “re-engineering” movement of the 1990s, in which managers were told to step back from their processes and outline the objective they wanted to achieve before re-engineering began. It is a logical process, but it is the wrong one.
Consider the process of shopping at Amazon. Amazon’s AI is already predicting your next purchase under “Inspired by your browsing history.” Experts estimate the AI’s success rate at about 5%, which is no small feat considering the millions of items on offer. Now imagine if the accuracy of Amazon’s AI were to improve in the coming years. At some point, the prediction would be enough to justify Amazon pre-shipping items to your home, and you would simply return the things you did not want. That is, Amazon would move from a shopping-then-shipping
model to shipping then shopping, sending items to customers in anticipation of their wants.
The complication lies in when Amazon should introduce this AI-driven fulfillment service. With the underlying technology improving, Amazon might choose to launch such a service just a year ahead of the competition, when the AI prediction is not yet perfect, and suffer a hit on returns and a dip in profitability. Why? Because launching the service slightly sooner will give Amazon’s AI more data sooner than the competition, which will mean its performance will improve slightly faster than that of others. Those slightly better predictions will in turn attract more shoppers, and more shoppers will generate more data to train the AI faster still, leading to a sort of virtuous cycle.1
In fact, this data intelligence is the only first-mover advantage that matters. It grows from a positive feedback loop. The more data that is used, the more valuable the business becomes, since getting relevant data in quantity is always difficult and expensive. This is why Google Maps becomes more accurate as more people use it: the underlying algorithms have more data to work with, so the apps become even more accurate. Google has made two decades’ worth of investments to digitalize
all aspects of its workflow, but not because it has a clear notion of what it wants to predict. It had done so before a clear notion of AI fully emerged. This is the groundwork that must be laid before a well-defined strategy for effective AI can be established, which means the conventional budget allocation will not work for banking incumbents seeking to scale their footprints in the age of AI. They have no choice but to follow a disruptive playbook, but with a twist.
How understanding disruption helps strategists
In the early 1990s, Professor Clayton
Christensen of the Harvard Business School noticed an interesting pattern among companies facing the emergence of a new technology.
When technological progress was incremental, even if the increments appeared in rapid succession, powerful incumbents always triumphed. Companies that were endowed with vast resources, extensive networks of suppliers, and a loyal customer base were able to command great advantages over their rivals, as would be expected. This is what made IBM a formidable player in the computing industry and General Motors a bellwether organization in the automotive industry.
1. For an excellent analysis of this thought experiment, please refer to Prediction Machines: The Simple Economics of Artificial Intelligence by Ajay Agrawal, Joshua Gans, and Avi Goldfarb. https://www.amazon.com/dp/B075GXJPFS.
http://new.guap.ru/i04/contacts |
AI & The Future of Work |
15 |
|
|
vk.com/id446425943
And yet, there is a class of technological changes in which the new entrant – despite far fewer resources and no track record – almost always topples existing industry giants. This special class of technological changes, Christensen noted, does not have to be sophisticated or even radical.
Take transistor television as an example. When
RCA first discovered transistor technology, the company was already the market leader in color televisions produced with vacuum tubes. It naturally saw little use for transistors beyond novelty, and decided to license the technology to a little-known Japanese firm called Sony.
Sony, of course, could not build a TV out of transistors, but it did manage to produce the first transistor radio. The sound quality was awful, but the radio was affordable for teenagers who were delighted by the freedom to listen to rock music away from the complaints of their parents.
Transistor radios took off. Still, the profit margins were so low that RCA had no reason to invest further. It was busy making serious money and investing every R&D dollar on improving vacuum tube color TV.
Sony, meanwhile, was looking for the next big thing. It launched a portable, low-end, black- and-white TV at a rock-bottom price, targeting low-income individuals. Called the “Tummy
Television,” it was tiny enough to perch on one’s stomach – the antithesis of RCA’s centerpiece of middle-class living rooms. Why would RCA invest in transistors to make an inferior television for a less-attractive market? It did not.
The real trouble began when Sony finally pushed the transistor’s performance to produce color TVs based entirely on the new technology. Overnight, RCA found itself trying to catch up on a technology that it had ignored for the past three decades, which it had ironically pioneered and licensed out. Christensen called this type of technology – inferior at first but immensely useful later – disruptive, a term that has since been immortalized in the business lexicon of executives, consultants, and academics.
What we see today in the financial industry are new entrants leveraging digital interfaces and AI decision-making processes that involve minimal manual work to target an underserved market segment. Their technologies cannot satisfy highend banking customers yet. But like the desktops that displaced minicomputers, or the angioplasty that displaced open-heart surgery, AI and digital automation will inevitably improve and, one day, these new solutions will be able to meet a substantial part of the need among big clients. The implication is that there will always be space for manual-intensive, human-centric operations, but that space will shrink substantially in the future.
One logical solution is for banking incumbents to create a separate unit and launch “speed boats” that adhere strictly to the playbook of digital disruptors. These will target an underserved market, and provide security services on a digital platform, with minimal human intervention. Initiatives like this are meant to develop a new set of capabilities – advanced analytics, dynamic product deployment, linking to third parties to fill a sudden surge in market demand – initially targeting a new segment that does not interfere with the mainstream business of the current banking operation.
Over time, such new businesses will develop crucial capabilities that will mature enough to be transplanted back into the mainstream.
This approach prevents the often-heard refrain of IT large-scale transformation: overtime, overbudget, and with underwhelming market results. In a way, it is RCA launching Sony’s transistor radio, but keeping ownership of it to get future technologies ready.
And here is one last twist. Scaling up a disruptive business will always be costly. The company will suffer financial loss for years, if not decades, and in the foreseeable future, will be unlikely
to achieve the level of profitability of the core business. BMW has been profitable for a very long time; Tesla is still operating at a loss today, as is Uber.
From Amazon to Square to Ant Financial, profitability is not the most important metric for managers; user base and market share are. This is why banking incumbents need to consider an alternate investment structure, allowing third parties, venture capitalists, and even competitors to take an equity stake.
Such a structure seems controversial, but is not unprecedented. Alibaba does not own all of Ant Financial. After exiting China, Uber now owns a minority share of its Chinese rival Didi. This is also the new strategy of GM’s CEO
Mary Barra, and it paid off handsomely in May
2018 when SoftBank announced a USD 2.25 billion investment in Cruise Automation – the self-driving unit of General Motors, headquartered in San Francisco. The investment pushed Cruise, originally purchased by GM for USD 581 million, to USD 11.5 billion. It takes more than just vision, belief, passion and experimentation in AI to transform a company. It takes a pocket so deep that it requires other people’s money to act on that aspiration. It is an unconventional approach taken during an unconventional time.
16
http://new.guap.ru/i04/contacts
vk.com/id446425943
One last flashback…
Adjacent to the Mercedes-Benz museum in
Stuttgart, Germany is one of the largest Mercedes dealerships in the world, which we also visited during the autumn of 2018. Its cavernous main hall is preceded by a restaurant, a café, and a shop hawking Mercedes-Benz merchandise. We saw a vertical banner stretching from the ceiling to the floor along the glass panels on one wall.
“Ready to change,” the banner cheered. “Electric intelligence by Mercedes Benz.” It referred to
Concept EQ, a brand of electric plug-in models first unveiled in Stockholm on 4 September 2018. There were three EQs on display next to an exhibition kiosk that did not work, but instead displayed an error alert and tangled cables spilling from the back that had come unglued.
Then, on the top floor, visitors were gawking at a Mercedes-AMG, known for its “pure performance and sublime sportiness.” Here was a vision of a forward-looking sports car with all its driving pleasure fully realized. The risers and the wrap-around LCD walls only accentuated the carbon-fiber composite of the chassis, gleaming in matte black. But we also noticed that the CO2 emissions rating of this
Mercedes AMG GT 63 S, with its 630 horsepower, was an F.
http://new.guap.ru/i04/contacts |
AI & The Future of Work |
17 |
|
|

vk.com/id446425943
Appendix
This appendix presents a short description of the calculation behind the “Leap readiness index” for the automotive industry in 2018. This index includes the top 55 automakers and component suppliers by revenue by the end of 2017.
The ranking measures four factors: (1) financial performance, (2) employee diversity, (3) research and development, and (4) early results of innovation efforts. These four main factors are tracked by 17 separate indicators that carry the same weight in the overall consolidated result.
All of our 17 indicators are hard data, i.e. they are publicly available from company websites, annual reports, press releases, news stories, or corporate responsibility reports. In order to calculate the “Leap readiness index,” we first manually collected historical data for each individual company. We then performed calculations for each indicator (e.g. 3-year compound annual growth rate) before we normalized criteria data by scaling it between 0 and 1.
For “early results of innovation,” we identified five key trending topics in the automobile industry. These were autonomous vehicles, electric vehicles (EVs), shared mobility, connected cars, and corporate venturing. We consulted Factiva – a global news database that covers all premium sources – and counted the number of press releases on each trending topic over the past three years (2016–18).
We then conducted the same normalization for these five indicators. Finally, we aggregated indicators to build the overall ranking. For the purpose of comparison, we have ranked each company from 1 (best) to 55 (worst) on a scale of 0 to 100.
Financial performance |
Employee diversity |
Research and development |
Early results of innovation |
|
|
|
|
% of international sales last year |
% of women employees |
3Y CAGR |
Press count on |
3Y CAGR turnover |
% of women management |
R&D intensity |
“autonomous vehicles” |
3Y CAGR mkt cap |
board members |
3Y average R&D intensity |
Press count on “EVs” |
3Y average profit change |
CEO demography |
3Y CAGR |
Press count on “connected cars” |
P/E ratio last year |
Headquarter competitiveness |
R&D expenses |
Press count on “sharing mobility” |
|
|
|
Press count on “corporate venturing” |
18
http://new.guap.ru/i04/contacts

vk.com/id446425943
http://new.guap.ru/i04/contacts |
AI & The Future of Work |
19 |
|
|

vk.com/id446425943
20
http://new.guap.ru/i04/contacts

vk.com/id446425943Economic security in
the gig economy
Giuliano Bonoli
University of Lausanne
One of the most disruptive ways in which technology is changing
the world of work is without doubt the so-called “gig” economy, where unlike the traditional firm-based model, work is not performed by employees, but by freelancers (or “giggers”) who are hired only for the time it takes to perform specific tasks (De Stefano 2016; Sutherland and Jarrahi 2018).
Thanks to internet-based platforms, gig economy companies connect sellers and buyers of almost any service. Uber was among the first companies to develop this model and is still the best-known gig economy giant. This business model has spread rapidly – first to other low-skill services such as domestic chores (TaskRabbit) or care needs (Care.com), and now to higher-skill jobs. Anyone can hire computer programmers, designers, ghostwriters or even business consultants on general web-based platforms such as upwork.com or dedicated platforms like 99designs.com for designers or 10eqs.com for business consultants. Since these jobs do not necessarily have to be performed locally, the high-skill segment of the market for freelancers is clearly international. In the gig economy, talent can be traded on a global scale.
What exactly do we mean by gig economy?
There are, at least, two different types of gig work. The best-known type is on-demand work, facilitated by internet-based apps and platforms that connect service sellers and buyers in local markets (e.g. Uber, TaskRabbit, Handy.com, Care.com and so forth). But there is also crowdwork, which can be performed by workers based anywhere in the world as long as they have access to a computer. They execute simple tasks for which they are paid usually small amounts, typically a few cents per task. One of the best-known crowdwork platforms is Amazon’s Mechanical Turk.
The sort of tasks performed by crowdworkers are called “human intelligence tasks” and cannot be outsourced to machines, e.g. filling in psychology questionnaires or training machine learning algorithms in face recognition.1
How big is the gig economy now? This apparently simple question is in reality extremely complex
(Abraham et al 2018). First, of course, there is the definitional issue. What precisely counts as a gig economy firm? The same applies to workers. Is it enough to drive for Uber once a month to qualify as a gig economy worker? Academic work has tended to use a definition implying that gigging is the main or sole source of income.
Estimates using this definition give relatively low numbers, ranging from 0.5% to 3% of the workforce for the USA and Western Europe (e.g. see
Katz and Krueger 2016; Huws and Joyce 2016;
Eichhorst et al 2016). Broader definitions to include workers who supplement other sources of income are in the region of 10%–15%. The gig economy is still marginal, but is widely recognized for its enormous potential. It is easy to envision a
1. Face recognition software must be calibrated so that it identifies individual persons in pictures taken from different angles, lighting conditions, etc.. In order to do this, the software needs to be “trained” i.e. exposed to thousands of pictures of people and informed when recognition is successful.
In this way, the software “learns” what precisely to look for to improve its face recognition performance. Taskers are simply asked to say if two pictures are of the same person or not.
http://new.guap.ru/i04/contacts |
AI & The Future of Work |
21 |
|
|

vk.com/id446425943
future in which many firms will consist of a core of essential staff who buy talent when and where it is needed.
The gig economy as a gate to employment and income for everybody?
What are the consequences of such disruptive technological change for workers? The debate on the gig economy provides us with various scenarios. The true digital optimists believe that not only consumers, but also workers will benefit from the increased flexibility and empowerment that come with being selfemployed, such as having greater control over work schedules, clients, jobs and projects. In fact, this vision is very far from reality for most gig workers. Take Uber drivers, for example, who in theory could benefit from all this. In reality, if they want to obtain a reasonable income, they have to drive around for several hours every day, often just waiting for a client to call. Things may of course be different for high-skill gig workers, such as business consultants or artificial intelligence specialists.
The true digital optimists believe that not only consumers, but also workers
will benefit from the increased flexibility and empowerment that come with being self-employed.
Socially minded gig economy gurus and executives, above all in America, propagate the optimistic view of the gig economy. The narrative is often one of new forms of work providing a kind of last resort safety net for poor people – a safety net that the state is no longer capable or willing to guarantee. The internet is full of quotes from new economy big names who argue this. David Plouffe, who ran the 2008 presidential campaign for Barack Obama and is a now a strategic advisor to Uber, says: “we’re discovering that platforms like Uber are boosting the incomes of millions of American fami-
lies. They’re helping people who are struggling to pay the bills, earn a little extra spending money, or transitioning between jobs.”2 Stacy Brown-Philipot, the CEO of TaskRabbit who grew up in a disadvantaged Detroit neighborhood, sees the gig economy as an opportunity to “create everyday work for everyday people.”3 Could the gig economy really be replacing the fading welfare state?
Then there are the pessimists who see the kind of work provided by internet-based platforms as insecure and alienating. In their eyes, gig work represents the ultimate stage in the casualization of work and the destruction of workers’ rights, where even the most basic rights such as health and safety may be at risk (Graben 2017). From this perspective, gig economy workers are like employees without workers’ rights. As a result, most of them should in fact be considered
as employees and be entitled to the standard package of employee rights such as minimum hourly wages (where they exist), holidays, sick pay, unemployment insurance, and old age pensions. Moreover, gig economy workers do not benefit from the traditional instruments that democracies have developed to make sure that workers’ rights are respected, such as collective bargaining and trade union representation
(Johnston and Land-Kazlauskas 2018).
As always, reality is in the middle. Platforms like
Uber or TaskRabbit do provide access to income streams to people who would find it extremely difficult to compete in the regular labor market.
This is above all the case for unskilled workers.
Today, in most advanced economies, there is a huge surplus of unskilled labor. Companies are looking for talented employees with technical and people skills, and those people without specialist skills or training are having a hard time. The gig economy can help them in two ways.
First, access to an income is relatively easy. Second, the services provided by gig economy freelancers are cheaper than those provided by traditional firms. Lower prices mean higher demand and hence more work to be shared by the large pool of unskilled workers.
But having access to an income stream is not enough. Freelancing of the kind that takes place through internet-based platforms has two main shortcomings. One is the lack of short-term income security. Revenues for giggers can be unpredictable. For those who perform simple tasks, revenues also tend to be low, so that it is
2.https://www.uber.com/newsroom/1776/
3.https://www.marketplace.org/2017/03/16/business/ corner-office/taskrabbit-demand-chore-company-dou- bles-number-cities-it-operates
22
http://new.guap.ru/i04/contacts

vk.com/id446425943
difficult for them to finance even short periods of inactivity with the income they generate while working. Hence, in order to keep afloat, giggers need to provide more than full-time availability to make sure that they do not miss earning opportunities. Uber drivers, for instance, complain that to earn a decent income they need to stay idle while waiting for clients to show up (Dudley 2017). Things may be easier for workers at the high end of the gig economy, where higher hourly earnings allow them to compensate for idle periods.
Some level of short-term economic security is essential to be able to lead a “normal” life, which by most definitions would include having a family, renting or buying accommodation, and planning for the future. It is doubtful that gigging alone can provide this.
Some level of shortterm economic security is essential to be able to lead a “normal” life.
On top of the uncertainty regarding demand for services, there are obviously also issues with availability. Few people can be available all the time. Parents of small children must organize their time around the care needs of their offspring. In addition, people are sometimes ill, and the pressure to work when feeling unwell can be very strong. In the UK, there was an outcry when a delivery driver who suffered from diabetes passed away after he missed appointments at the hospital for fear of being penalized.4 This is obviously an extreme and rare event, but clearly the situation of having to provide constant availability is incompatible with any notion of quality of life.
The second problem is income security in the long term, which is often problematic – not only for gig economy workers, but for the self-em- ployed in general (Spasova et al 2017). For employees, this security is provided by social insurance. When working, employees and their employers pay social contributions that entitle workers to an income stream if they are unable to work due to social risks such as unemployment, disability or old age. Again, to some
4. https://www.bbc.com/news/uk-england-dor- set-42946855
extent, access to long-term income security is a matter of earnings. High-skilled, high-earn- ing freelancers can buy insurance cover on the market for all the social risks mentioned above.
However, to be able to afford this, they need to be relatively successful. Given current trends in life expectancy, financing one’s own retirement alone is a difficult task and requires the capacity to set aside a sizable proportion of income with a certain level of regularity.
Hence it is difficult for high-skilled professionals to buy insurance against social risks and virtually impossible for low-skilled workers. Drivers, taskers or carers who barely manage to earn a reasonable living now are unlikely to be able to save for their retirement or to insure themselves against risks such as illness or disability.
Of course, some of them might transition to standard jobs. But this may not be the case for the majority, especially since the trend seems to be toward more gig work.
The gig economy, like most disruptive technological innovations, is both an opportunity and a threat for social cohesion and stability. It is an opportunity because it is inclusive by nature. There are very few obstacles for motivated indi-
viduals who want to participate in it. It is a threat because the rewards it offers for participation are very far away from what we consider as a socially acceptable way of living in advanced economies.
Society, governments and firms still need to find a balance between flexibility and security around this disruptive but very efficient solution to create markets for talent.
What can be done?
Unsurprisingly, there is little consensus on how to provide a reasonable level of economic security to people working in the gig economy. Some argue that enforcing existing legislation would be enough, and giggers should simply be considered as employees and receive employee rights. This solution is often favored by the trade unions and governments. However, it is not applicable everywhere. First, some giggers are true freelancers who chose to be self-employed and who work for several clients, so that there is no legitimate reason for governments to reclassify them as employees. Second, forcing standard employee status on gig economy workers may destroy the business model, which is based on low-cost and low-priced services. This would mean denying access to work and income to those who are profiting from the opportunities provided by the gig economy.
Some argue in favor of adapting existing systems to the emergence of new forms of work. In the specialized literature, one can find several ideas such as creating new legal statuses
http://new.guap.ru/i04/contacts |
AI & The Future of Work |
23 |
|
|

vk.com/id446425943
(e.g. independent workers) or expanding the definition of employee to encompass the new forms of work (e.g. see Stewart and Stanford 2017). It may be the case that the traditional social insurance-based solutions are unsuitable to the very nature of the gig economy. What
is certain is that current legal regulations are finding it hard to accommodate new forms of work such as gigging, as shown in Chapter 4 on legal and ethical challenges.
We may need more innovative solutions. In its recent report on the changing nature of work the World Bank argues that “traditional provisions of social protection based on steady wage employment, clear definitions of employers and employees, and a fixed point of
retirement are becoming increasingly obsolete”
(World Bank 2019: 14). Let us not forget that the social insurance systems in place today are a legacy of the early days of industrialization.
Social insurance was invented in 19th century Germany by Otto von Bismarck and it is at least questionable whether this model is suitable to today’s working world. Without a doubt, social insurance is still needed for the majority of workers who continue to fit in the standard pattern. But it needs to be complemented or supplemented by other forms of social protection.
The idea that social protection needs to be adapted to the changing nature of work is now firmly embedded in public debates.
The idea that social protection needs to be adapted to the changing nature of work is now firmly embedded in public debates. The most striking proof of this is the impressive return on the scene of an old idea: universal basic income
(UBI) paid unconditionally to every citizen. The idea has gained renewed popularity precisely in relation to fears of robots taking over more and more jobs, and work becoming ever more precarious. Interest for UBI is strong in Finland, where an experiment has been set up to study how people’s behavior changes if they receive
money from the state with no conditions attached.5 It is also strong in Switzerland, where proponents of basic income were able to benefit from this country’s direct democratic institutions and to organize a referendum. The vote, which took place in 2016, saw a clear victory of the “No” camp (77% voted against the idea of a basic income6). Rather surprisingly, the World
Bank also seems interested in basic income programs as a possible strategy to adapt social protection to changes in the way people work
(World Bank 2019: 109–112).
Basic income is a very attractive proposition because of its simplicity and its capacity to solve several problems that plague current societies and social policy interventions (Van Parijs 1992). Since it is universal, people are not penalized
if they work, which is what happens with most existing social welfare schemes where extra income results in benefit reductions. It provides help to everybody, so that there is no risk of leaving anyone behind. However, it has two downsides. First, there is nearly total uncertainty with regard to its economic impact and more precisely its impact on the labor market. There have been a few experiments, but it is very difficult to generalize the findings of
time-limited experiments based on experimental samples to determine what will happen in the long run if a universal basic income were to be introduced. Potentially, such a program could radically reduce labor supply in ways that could affect the prosperity of modern economies and ultimately their ability to finance a basic income.
The second problem is political feasibility. As shown by the Swiss vote of 2016, it is difficult to gather a majority around the idea of providing an unconditional income to people without any form of reciprocity.
In the end, a universal basic income may not be the panacea for today’s problems, but the welfare state still needs to be adapted. Less ambitious programs such as in-work benefits or universal child allowances seem promising and considerably more feasible. In-work benefits are similar to a negative tax and are paid to workers
(employees and self-employed) with earnings below a given threshold (OECD 2003). The benefit is generally calculated so that an extra unit of income reduces the benefit by a smaller amount, typically around 50%–60% of the increase in earnings. The result is that there is always an incentive to work more for those who
5.See: https://www.kela.fi/web/en/basic-income-experi- ment-2017-2018
6.See: https://www.swissinfo.ch/eng/directdemocra- cy/vote-june-6_basic-income-plan-awaits-voters-ver- dict/42200378
24
http://new.guap.ru/i04/contacts

vk.com/id446425943
receive this form of help. In-work benefits exist in most countries, but tend not to react to rapid income fluctuations. In today’s hyper-connected world, it is not so difficult to imagine a system of income supplements that are adapted in real time to the changing income of gig economy workers. The welfare state should also exploit the advantages that new technologies can offer.
In-work benefits exist and are a promising way to top up the incomes of workers with insecure earnings. They need to be adapted to today’s working world in a way that preserves incentives to work.
The challenge before us is to preserve the high levels of social cohesion and economic security achieved in the past.
Another alternative would be to improve the financial support given to households with children. In fact, the uncertainty due to income fluctuations is especially a problem for families.
Adult-only households are much more able to cope and adapt. Many OECD (Organisation for Economic Co-operation and Development) countries provide child allowances, i.e. benefits that are paid to households with dependent children. These could be strengthened and connected to the debate on basic income. Some have argued in favor of a “child basic income” (Atkinson and Marlier 2010). Relative to the general basic income, this option would be more affordable and at the same time more likely to provide support where it is most needed. A child basic income, independent from earnings, would also be favorable to work incentives.
These debates show that the disruptive technological change and the transformation of work are generating new ideas with regard to the reform of the social protection systems that we have inherited from the industrial economies of the postwar years. The challenge before us is to preserve the high levels of social cohesion and economic security achieved in the past in this newly emerging economic and technological world.
Obviously, the implications of this challenge go beyond the narrow field of social policy.
Preserving some form of social cohesion is essential in modern democracies. Otherwise, those who feel left behind tend to turn to anti-system political parties with unpredictable consequences for the preservation of our prosperity and way of life. As shown in Chapter 1 on technical change, the occupational structure is changing and society needs to understand that, given the surplus of low-skilled labor in all advanced economies, a substantial effort will have to be made to support the living standards of those who cannot participate in mainstream wealth creation processes. This has to be done intelligently, i.e. in a way that preserves work incentives while at the same time protecting the weakest members of the workforce from poverty and exclusion. The technological transformations that we have witnessed in recent years have the potential
to produce enormous gains in terms of quality of life. The dark side is polarization and a very real risk of exclusion for some workers. Public policy must make sure that society as a whole will profit from this tremendous opportunity and that it will do so in an inclusive way.
http://new.guap.ru/i04/contacts |
AI & The Future of Work |
25 |
|
|

vk.com/id446425943
26
http://new.guap.ru/i04/contacts
vk.com/id446425943AI: Legal and ethical challenges
Bettina Hummer
University of Lausanne
As the preceding chapters have shown, artificial intelligence (AI) is modifying our society deeply. Sophisticated technologies diversify human activity, the internet encourages new forms of work, and businesses that would like to further develop artificial intelligence are facing serious innate challenges. Accordingly, labor markets are likely to undergo significant changes, along with employment laws, social welfare and public policy. How can we ensure that computer technology and artificial intelligence will improve the working world and benefit people in the end?
Some ethical and constitutional fundamentals
Modern data processing technologies enable us to define solutions that are based solely on numbers, mechanics and electronic equipment, without a human brain as a middleman. Hence, the use of these technologies may endanger an individual’s rights if ethical, cultural or social values are left behind. Values are what humanity is all about and should protect us from scenarios where machines decide people’s futures. They radiate into the field of work where employees, employers and other contracting partners must treat each other with fairness. The European Union’s General Data
Protection Regulation (GDPR) puts it in a nutshell by saying that “e-recruiting practices without any human intervention” cannot be conducted without the consent of the person affected. But e-recruit- ing is by far not the only technology that springs to mind when we talk about mutual respect in the working world. What if the computer evaluation of employees (e-rating or e-profiling) were to automatically lead to the exclusion or dismissal of employees without the employers’ involvement, i.e. leaving machines to perform the unpleasant tasks in contractual relationships? These are just some examples of how important it is to consider measures protecting people against potentially life-changing automated decisions and their consequences.
Human dignity is a philosophical concept that is now anchored in many international treaties and national constitutions. In the workplace dignity requires human intervention. Putting a person’s decision or a “wall” (Sève 2011) between the machine and the data subject becomes all the more important as computers might develop concepts they are not directly programmed for. The problem is not new; as Serge Gutwirth observed more than 20 years ago – technology “can program life up to a point by excluding certain behavioral alternatives” and promote “the use of statistic projection in the decision-making process” (Gutwirth 1997, p. 75). There is no doubt that data gathered by computers is an enormous resource and, if used properly, can have far-reaching benefits for the labor market. But, like any other methods or techniques, the use of information technology and AI needs to follow some basic ethical and legal guidelines.
Framing the use of AI
First, persons or employees affected by data processing must be able to respond and freely voice their opinions in surveys and other automated procedures, and choose whether to participate in e-managed programs and applications or not. For example, the EU’s GDPR defines personality profiling as “evaluating the personal
http://new.guap.ru/i04/contacts |
AI & The Future of Work |
27 |
|
|

vk.com/id446425943
aspects relating to a natural person, in particular to analyze or predict aspects concerning the data subject’s performance at work” and individuals “should have the right not to be subject to a decision … which is based solely on automated processing” (recital 71 GDPR). Moreover, the related provision requires explicit consent from the data subject (Art. 21 GDPR).1
But even in countries where the GDPR is not directly applicable, such as Switzerland or countries outside the EU and the European Economic Area, the employee’s veto right may derive from the right to data-related self-determination in contractual relationships. Article 8 of the European Convention on Human Rights (ECHR) includes the right of respect for privacy, including correspondence (e.g. letters, telephone calls and emails) and thus has a bearing on the interpretation of national labor law (Pärli 2015, p. 17). In many European
countries, the employee’s right to privacy cannot be readily waived by the labor contract2 and violation of this right may have significant consequences. In the 2017 “Keylogger” case in Germany, for example, the court ruled that the employer could not use computer-based evidence to justify the dismissal of a worker who frequently carried out private activities during working hours.
There is no doubt that data gathered by computers is an enormous resource and, if used properly, can have far-reaching benefits for the labor market.
Besides the data-related right of self-determi- nation, equality of treatment also plays a key role in preventing unfair decisions in the working
1.In the same manner, Art. 24 of Regulation (EU) 2018/1725 grants the right not to be subject to a decision based solely on automated processing when EU institutions or EU bodies are involved.
2.See or example Art. 328b CO and for further details Fanti
2017, p. 230 et seq.
world. Similar to data protection, equality is a fundamental right that protects workers from being subject to automated decision-making that would apply only to certain groups such as women, disabled persons or migrants. Scientific research, for example, has shown that intelligent software is able to perform facial recognition of persons and put them in categories according to their gender, age, or color of their skin (Wagner 2016). Such possibilities can lead to inequitable and discriminatory decisions if there is no human wall to prevent them. That said, societies must also recognize the tremendous potential offered by smart technologies, or, in the words of Andrus Ansip, Vice-President and Commissioner at the Digital Single Market at European Commission, “From better healthcare to safer transportation, the benefits of AI are many and Europe should grab them” (EU Commission June 2018).
Using AI for the benefit of coming generations
While research and free entrepreneurship are fundamental principles of open democratic systems and must be considered when regulating the commercial use of new technologies, national constitutions and international agreements are starting to impose obligations on states and organizations with respect to the next generations. Sustainability or the concept of intergenerational justice looks to the future, particularly by protecting the environment, but also by using new technologies in a mindful way and ensuring prosperity. A field where we can also find constitutional rules that are binding legislators is education and continued learning.
In many countries, access to education is, if not an individual right, at least another constitutional aim that must be observed when preparing the society for new forms of work.
In Switzerland, for instance, the Confederation and the cantons must jointly ensure the high quality and accessibility of the “Swiss Education Area” (Art.
61a Swiss Federal Constitution) and the Confederation should “promote scientific research and innovation” (Art. 64 Swiss Federal Constitution). To make the digitalized world function successfully, societies will indeed have to invest money in education as well as research. In September 2018, the Council of the European Union created the European High Performance Computing Joint
Undertaking (EuroHPC JU) public-private partnership to “pool European resources to develop top-of-the range exascale supercomputers
for processing big data, based on competitive
European technology.”3
3. The EU-Commission and its priorities: https://ec.europa. eu/digital-single-market/en/eurohpc-joint-undertaking.
28
http://new.guap.ru/i04/contacts

vk.com/id446425943
The Council Regulation governing the EuroHPC
JU expressly mentions artificial intelligence as a phenomenon that can underpin “personalized medicine, connected and automated driving or other lead markets,” with the aim of promoting
Europe’s “wider competitiveness goals” and to leverage private investments and help tackle societal challenges.4
Besides financial input, the EU Commission is currently debating whether European legislation should not be more flexible in terms of data re-use and data sharing because “data is the raw material for most AI technologies” (EU-Commission April 2018). At the national level, Scandinavian countries are already on the way to reconciling artificial intelligence with the Nordic Welfare System. According to Asa Zetterberg, the Swedish government’s Chief Digital Officer, for example, Sweden sees massive potential in using artificial intelligence for “competitiveness, jobs, welfare and sustainable development.”5
But, like any other methods or techniques, the use of information technology and AI needs to follow some basic ethical and legal guidelines.
The opportunities of enhancing economic growth by using and developing artificial intelligence are indeed many. Researchers predict a shift to more skilled work that will affect many professions along with momentary shortages in workforce because artificial intelligence needs a tremendous amount of know-how (Schieferdecker 2017, p. 67, Worbel 2017). Even industries that are not directly involved in computer technology, such as
4.see https://eur-lex.europa.eu/legal-content/EN/TX- T/?uri=CELEX:32018R1488
5.https://www.government.se/articles/2018/03/artifi- cial-intelligence-will-strengthen-swedens-welfare-and-com- petitiveness/ 2018
healthcare, retailing, manufacturing, construction and insurance (Brulhart 2018, p. 51), to name a few, should see their business potential increase. In short, one does not need to be a programmer, an engineer or a mechanic to find work in the digitalized world. People with language proficiency, medical and biological knowledge, as well as business acumen and many other professional skills will be necessary to develop, support and commercialize artificial intelligence in all branches of the economy and businesses of all sizes.
Shaping work relations and social welfare on the threshold of the Digital Revolution
Today’s working world is ruled by social standards such as employment law, social security and welfare. With the age of digitalization, these rules are being challenged in many ways, ranging from computers and robots threatening job security (Wildhaber 2018) to sufficiently providing for independent contractors and “gig” workers (Witzig 2016). How do we adapt social protection to the digitalized working world?
With respect to AI, employers and employees need to know what happens when a computer does something it was not supposed to do, i.e. comes up with automated solutions it had not been programmed for. This could happen by mistake, e.g. because data the computer has been fed with was fallible, or as a result
of the intelligent data processing that makes the computer learn and infer things by itself. Torts caused by automated machines and self-driving cars might be the first cases that spring to mind (Werro and Lubian 2018, p. 69). Although workers’ compensation schemes, like mandatory accident insurances and pensions, will often absorb damages, the conditions of liability must be clearly defined.
AI is a technology that may involve unpredictable consequences and should trigger liability based on risk that is independent from fault
(like liability for motor vehicles, aircrafts or animals). Besides tort law, contracts must fit to new working conditions. What if the e-re- cruiting system used by a company makes a release that could be considered as discriminatory, towards a female applicant for example. According to existing laws, such statements can be directly imputable to the person controlling the system, the hiring company for instance.6 In order to protect workers and candidates efficiently, contract law should ensure compensation in case of violation. It should also state that chatbots or other communication devices may generate legal consequences for the person behind the machine. For the working world,
6. For more details see Grapentin 2018.
http://new.guap.ru/i04/contacts |
AI & The Future of Work |
29 |
|
|

vk.com/id446425943
it might therefore be wise to start introducing laws to govern these issues possibly along the following lines:
ȹȹ |
The person controlling an automated |
|
computerized system is liable for damage |
|
caused by the system unless he/she proves |
|
that he/she took all due care to avoid |
|
damage or that damage would have occurred |
|
even if all due care had been taken. Liability |
|
also extends to infringements of personality |
|
rights. |
ȹȹ |
Statements that such systems address |
|
to third parties are binding for the person |
|
controlling the system. |
A contribution-based pension scheme for retirement or occupational disability and unemployment regardless of formal employment status could be an effective way to collect social contributions and inject them into the various social protection schemes (old age, healthcare, work accidents, unemployment and so on).
It would require adjustments to the traditional social security systems that still rely on the idea of a continuous full-time employment relationship between workers and their employers. In addition, our focus should not be restricted to the national job markets and social security systems because digitalization goes hand in hand with globalization. Crowdworking is a good example since it connects people from all over the world via the internet to carry out some gainful activity
(European Parliament 2016, p. 1). Therefore, at least European countries should aim at finding a pan-European solution such as specifying a common contribution rate levied on gains earned through crowdworking and crowdsourcing. These contributions would flow into the national social security systems to help absorb undesirable consequences of transitions in the job markets
(Kahil-Wolff Hummer 2018).
It should be noted, however, that information technology, and artificial intelligence in particular, can also be used to enhance social protection and should not be reduced to the
“we will all lose our jobs” factor. In the past, repetitive and dangerous jobs have been known to result in costs and personal hardships that intelligent technology may help to avoid. Safety is an integral part of IT engineering with the idea that robotics do not create new risks for workers and citizens. Artificial intelligence may also foster professional activities suited to persons with health issues or disabilities that help working parents reconcile family with work, or that protect workplaces from hacking and other types of criminality. And, finally, artificial intelligence may help accelerate social security administration, which has often challenged the effectiveness of social security schemes and
can put individual rights at risk. The European Union has now initiated the use of electronic data exchange in all EU member states, the
European economic area and in Switzerland – the so-called EESSI (Electronic Exchange of
Social Security Information7) system, which replaces traditional paper forms, allows crossborder data exchange and – notwithstanding European data protection rules – may become part of IT-assisted public management in the field of social security. There will nevertheless be a need to set up a framework of rules that balance the amount of data required by AI-managed administration and the protection of sensitive personal information.8
Conclusion
While inventions have always pushed human activity toward new eras, mankind is not just
“pushed.” We make decisions – democratically legitimate decisions that organize life and work in order to grant freedom, security and welfare to society. How can we ensure that modern computer technology will improve the working world and ultimately benefit people future generations? Legislators must be aware of the complexities surrounding information technology and artificial intelligence and try to gauge their very “nature” in order to define the aims that regulation should pursue.
7.For more details see Spiegel 2017.
8.The Swiss legislator is about to introduce a rule that allows using smart navigation systems in order to watch insured persons.
30
http://new.guap.ru/i04/contacts

vk.com/id446425943
References
What technological change means for the future of work
Acemoglu, D. and Autor, D.H. 2011. Skills, tasks and technologies: implications for employment and earnings. In: Handbook of Labor
Economics, vol. 4B, pp. 1043–1171.
Arntz, M., T. Gregory and U. Zierahn 2016. The
Risk of Automation for Jobs in OECD Countries: A Comparative Analysis, OECD Social, Employment and Migration Working Papers, No. 189, OECD Publishing, Paris. http://dx.doi. org/10.1787/5jlz9h56dvq7-en.
Autor, D. and Dorn, D. 2013. The growth of low-skill service jobs and the polarization of the
US labor market. American Economic Review, 103(5), 1553–97.
Federal Council 2017. Conséquences de la numérisation sur l’emploi et les conditions de travail : opportunités et risques. Rapport du Conseil fédéral donnant suite aux postulats 15.3854
Reynard du 16 septembre 2015 et 17.3222 Derder du 17 mars 2017.
Fernández-Macías, E. 2012. Job Polarization in
Europe? Changes in the EmploymentStructure and Job Quality, 1995-2007. Work and Occupations 39(2), 157–182.
Fernández-Macías E. and Hurley J. 2017. Rou- tine-biased technical change and job polarization in
Europe. Socio-Economic Review 15(3), 563–585.
Frey, C. B. et Osborne, M. A. 2017. The Future of Employment: How Susceptible Are Jobs to Computerisation? Technological Forecasting and Social Change 114: 254–80.
Goos, M. and Manning, A. (2007) Lousy and
Lovely Jobs: The Rising Polarization of Work in Britain. Review of Economics and Statistics, 89(1), 118–133.
Murphy, E. et Oesch, D. 2018. Is employment polarisation inevitable? Occupational change in Ireland and Switzerland, 19702010, Work, Employment and Society, DOI: 10.1177/0950017017738944.
Nedelkoska, L. and G. Quintini 2018. Automation, skills use and training, OECD Social, Employment and Migration Working Papers, No. 202, OECD Publishing, Paris. http://dx.doi. org/10.1787/2e2f4eea-en
OECD 2017. Employment Outlook, Chapter 3,
OECD Publishing, Paris.
Oesch, D. 2013. Occupational Change in Europe. How Technology and Education transform the Job Structure. Oxford: Oxford University Press.
Oesch, D. and Piccitto, G. 2019. Upgrading, not job polarization. Occupational change in Germany, Spain, Sweden and the UK, 1992–2015.
Work and Occupations, forthcoming.
SECO 2016. Pénurie de main-d’œuvre qualifiée en Suisse. Système d’indicateurs pour évaluer la demande en personnel qualifié.
Siegenthaler, M. 2017. Vom Nachkriegsboom zum Jobwunder – der starke Rückgang der Arbeitszeit in der Schweiz seit 1950. Social
Change in Switzerland No 7. DOI: 10.22019/
SC-2017-00004
Wright, E. O. and Dwyer, R. 2003. The patterns of job expansions in the USA: a comparison of the 1960s and 1990s, Socio-Economic Review 1(1), 289–325.
Economic security in the gig economy
Abraham, K., Haltiwanger, J., Sandusky, K., & Spletzer, J. (2018). Measuring the gig economy: current knowledge and open issues. Cambridge, MA: NBER, Working Paper No. 24850.
http://new.guap.ru/i04/contacts |
AI & The Future of Work |
31 |
|
|
vk.com/id446425943
Atkinson, A. B., & Marlier, E. (2010). Income and living conditions in Europe. Luxembourg: Eurostat.
De Stefano, V. (2016). The rise of the «just-in- time workforce»: On-demand work, crowdwork and labour protection in the «gig-economy» (Vol. Conditions of Work and Employment Series No. 71). Geneva: ILO.
Dudley, G., Bannister, D., & Schwanen, T. (2017). The Rise of Uber and Regulating the Disruptive Innovator. The Political Quarterly, 88(3), 492-499.
Eichhorst, W., Hinte, H., Rinne, U., & Tobsch, V. (2016). How Big is the Gig? Assessing the
Preliminary Evidence on the Effects of Digitalization on the Labor Market. Bonn: IZA, Policy Paper No. 117.
Garben, S. (2017). Protecting Workers in the
Online Platform Economy: An overview of regulatory and policy developments in the EU. Bilbao: European Agency for Safety and Health at Work.
Huws, U., & Joyce, S. (2016). Size of UK’s “Gig Economy” revealed for the first time: University of Hertfordshire.
Johnston, H., & Land-Kazlauskas, C. (2018). Organizing on-demand: Representation, voice, and collective bargaining in the gig economy.
Geneva: International Labour Organisation.
Katz, L., & Kruger, A. (2016). The Rise and Nature of Alternative Work Arrangements in the United States , 1995-2015. Cambridge MA: NBER Working Paper No. 22667.
OECD. (2003). Making Work Pay - Making
Work Possible. OECD Employment Outlook
2003, 113-170.
Spasova, S., Bouget, D., Ghailani, D., & Vanhercke, B. (2017). Access to social protection for people working on non-standard contracts and as self-employed in Europe. Brussles: European
Commission, European Social Protection Network (ESPN).
Stewart, A., & Stanford, J. (2017). Regulating work in the gig economy: What are the options?
The Economic and Labour Relations Review, 28(3), 420-437.
Sutherland, W., & Jarrahi, M. H. (2018). The sharing economy and digital platforms: A review and research agenda. International Journal of
Information Management, 43, 328-341.
Van Parijs, P. (Ed.). (1992). Arguing for Basic
Income. Ethical Foundations for a Radical Reform. London: Verso Books.
World Bank, W. (2019). World development re-
port: The Changing Nature of Work. Washington
D.C.: World Bank Group.
AI: Legal and ethical challenges
Brulhart, V., Sign up & drive : quelles assurances ? Remarques sur l’émergence de l’économie collaborative et ses dépendances envers l’assurance, in Kahil-Wolff Hummer, B./Juge, J., ed, Le droit social numérique, Bern 2018, p.
47 et seq.
EU-Commission, Press Release, June 18 2018
European Parliament – Employment and social affairs, The situation of workers in the collaborative economy, 2016
Fanti, S., Protection des données informatiques, in Dunand, J.-P./Mahon, P., ed., La protection des données dans les relations de travail, Geneva/Zürich/Basel 2017, p. 230 et seq.
Grapentin, J., Vertragsschluss und vertragliches Verschulden beim Einsatz von Künstlicher Intelligenz und Softwareagenten, Baden-
Baden 2018.
Gutwirth, S., Privacy and the Information Age, for the Rathenau Institute, Translated by Raf Casert, Lanham 1997.
Kahil-Wolff Hummer, B., Les relations sociales internationales dans l’économie collaborative : renouveler les règles légales en Europe, in Kahil-Wolff Hummer, B./Juge, J., ed, Le droit social numérique, Bern 2018, p. 137 et seq.
Pärli, K., Gutachten zur Bedeutung der EMRK und der Beschwerde an den EGMR für das schweizerische Arbeitsrecht, im Auftrag des Schweizerischen Gewerkschaftsbundes SGB, Bern, March 2015, https://www.humanrights. ch/cms/upload/pdf/160902_Gutachten_Bedeutung_EMRK_SGB.pdf
Schieferdecker, I., Work in a Digitalized World, in Fraunhofer Institute, ed., Annual Report 2017 - The Future of Work, Munich 2017, p. 59 et seq.
Sève, R., Introduction, L’é-Justice – Dialogue et pourvoir, Archives de philosophie du droit, Paris, Tome 54, 11/2011, Introduction, p. 4 et seq.
Spiegel, B., Verschiedene Bestimmungen, in Fuchs, M., ed., Europäisches Sozialrecht, Baden-Baden 2017, p. 537 et seq.
Wagener, A., Vortrag Künstliche Intelligenz und Indistrie 4 0, Hochschule Hof, November 22 2016, https://www.youtube.com/watch?v=_ kfXmqJevFs
32
http://new.guap.ru/i04/contacts
vk.com/id446425943
Werro, F./Lubian, F., , Sign up and Drive: quelles responsabilités, in Bettina Kahil-Wolff Hummer/ Johan Juge, éd, Le droit social numérique, Bern 2018, pp. 67 et seq.
Wildhaber, I., Artificial intelligence and robotics, the workplace, and workplace-related law, in Woodrow Barfield/Ugo Pagallo, ed., Research Handbook on the Law of Artificial Intelligence, Cheltenham/Northhampton 2018, p. 577 et seq.
Witzig, A., L’ubérisation du monde du travail, I/
ZSR 2016, p. 457 et seq.
Wrobel, S., Blick in die Labore – Künstliche Intelligenz in der Medienanalyse, Medizin, Robotik und Produktion, Conference at Fraunhofer InnoVisions, November 29 2017, https://www. youtube.com/watch?v=IE6XiRhUegk.
Zetterberg, Å., A. Artificial intelligence will strengthen Sweden’s welfare and competitiveness, 2018, https://www. government.se/articles/2018/03/artifi-
cial-intelligence-will-strengthen-swedens-wel- fare-and-competitiveness
http://new.guap.ru/i04/contacts |
AI & The Future of Work |
33 |
|
|

vk.com/id446425943
About the authors
Rafael Lalive is a professor in economics at University of Lausanne and a member of several professional networks
(CEPR, CESifo, IFAU, IfW, and IZA). He holds a PhD in Labor
Economics from the University of Zurich. His key interests include the effects of robots on employment, placing job seekers into technology-resilient jobs and the economic effects of reforms on public policy. His research has been published by various major economics journals and science journals.
Daniel Oesch is a professor of sociology at the University of Lausanne. He is the author of two books “Occupational Change in
Europe” (2013, Oxford University Press) and “Redrawing the Class Map” (2006, Palgrave Macmillan) and over 20 articles on social stratification and the labor market. He learnt his trade as secretary of the Swiss Federation of Trade Unions and earned his PhD from the University of Zurich.
Howard Yu is the author of LEAP: How to Thrive in a
World Where Everything Can Be Copied (PublicAffairs, 2018), LEGO professor of management and innovation at the IMD Business School in Switzerland, and director of IMD’s signature Advanced Management Program (AMP). A native of Hong Kong, he earned his doctoral degree from
Harvard Business School.
34
http://new.guap.ru/i04/contacts

vk.com/id446425943
Jialu Shan is a Research Associate at The Global Center for Digital Business Transformation – An IMD and Cisco Initiative.
She holds a PhD in Economics (management) from the Faculty of Business and Economics at the University of Lausanne
(HEC). Her primary areas of interest are digital transformation and digital business models, as well as technological innovation, with a particular focus on Asian market.
Giuliano Bonoli is Professor of social policy at the Swiss graduate school for public administration at the University of Lausanne. He holds a PhD from the University of Kent at Canterbury and previously worked at the Universities of Bath
(UK), Bern and Fribourg (Switzerland). His main research topic is the transformation and adaptation of European welfare states. Recently his work has focused on the challenges posed by migration and digitalization to social cohesion. He has published some forty articles in international journals and a number of books.
Bettina Hummer teaches Social Law and Legal German at the University of Lausanne, where she was Dean of the Faculty of Law, Criminal Justice and Public Administration from August 2011 to July 2015. She has been Director of the Institute for Labor and Insurance Law in Lausanne since 2002. Professor Hummer’s research is focused mainly on
Social Security Law and Free Movement of Persons within the EU. Her last book about Social law of the European Union and associated countries was published in 2017. Since May 2018, she has been a member of the Board of Governors of the
International Association of Law Schools (IALS).
http://new.guap.ru/i04/contacts |
AI & The Future of Work |
35 |
|
|

vk.com/id446425943
General disclaimer / important information
This document was produced by and the opinions expressed are those of Credit Suisse Group AG and/or its affiliates (“CS”) as of the date of writing and are subject to change.
This document must not be read as independent investment research. It has been prepared with the greatest of care and to the best of its knowledge and belief and solely for information purposes and for the use of the recipient. It does not constitute an offer or an invitation by or on behalf of CS to any person to buy or sell any security or banking service and does not release the recipient from exercising his/her own judgment. Nothing in this material constitutes invest-
ment, legal, accounting or tax advice, or a representation that any investment or strategy is suitable or appropriate to your individual circumstances, or otherwise constitutes a personal recommendation to you. The price and value of investments mentioned and any income that might accrue may fluctuate and may fall or rise. Any reference to past performance is not a guide to the future.
The information and analysis contained in this document have been compiled or arrived at from sources believed to be reliable but CS does not make any representation as to their accuracy or completeness and does not accept liability for any loss arising from the use hereof. A Credit Suisse Group company may have acted upon the information and analysis contained in this publication before being made available
to clients of CS. Investments in emerging markets are speculative and considerably more volatile than investments in established markets. Some of the main risks are political risks, economic risks, credit risks, currency risks and market risks. Investments in foreign currencies are subject to exchange rate fluctuations. Any questions about topics raised in this piece or your investments should be made directly to your local relationship manager or other advisers. Before entering into any transaction, you should consider the suitability of the transaction to your particular circumstances and independently review (with your professional advisers as necessary) the specific financial risks as well as legal, regulatory, credit, tax and accounting consequences. This document may provide the addresses of, or contain hyperlinks to, websites. Except to the extent to which the report refers to website material
of CS, CS has not reviewed any such site and takes no responsibility for the content contained therein. Such address or hyperlink (including addresses or hyperlinks to CS’s own website material) is provided solely for your convenience and information and the content of any such website does not in
any way form part of this document. Accessing such website or following such link through this report or CS’s website shall be at your own risk.
This report is issued and distributed in the European Union (except Switzerland): by Credit Suisse (UK) Limited and Credit Suisse Securities (Europe) Limited. Credit Suisse Securities (Europe) Limited and Credit Suisse (UK) Limited, both authorized by the Prudential Regulation Authority and regulated by the Financial Conduct Authority and the Prudential Regulation Authority, are associated but independent legal entities within Credit Suisse; Germany: Credit Suisse
Securities (Europe) Limited Niederlassung Frankfurt am
Main regulated by the Bundesanstalt fuer Finanzdienstleistungsaufsicht (“BaFin”); United States and Canada: Credit Suisse Securities (USA) LLC; Switzerland: Credit Suisse AG authorized and regulated by the Swiss Financial Market
Supervisory Authority (FINMA); Brazil: Banco de Investimentos Credit Suisse (Brasil) S.A or its affiliates; Mexico: Banco Credit Suisse (México), S.A. (transactions related to the securities mentioned in this report will only be effected in compliance with applicable regulation); Japan: by Credit Suisse Securities (Japan) Limited, Financial Instruments Firm, Director-General of Kanto Local Finance Bureau ( Kinsho) No. 66, a member of Japan Securities Dealers Association, The Financial Futures Association of Japan, Japan Investment Advisers Association, Type II Financial
Instruments Firms Association; Hong Kong: Credit Suisse (Hong Kong) Limited; Australia: Credit Suisse Equities
(Australia) Limited; Thailand: Credit Suisse Securities (Thailand) Limited, regulated by the Office of the Securities and Exchange Commission, Thailand, having registered address at 990 Abdulrahim Place, 27th Floor, Unit 2701, Rama IV Road, Silom, Bangrak, Bangkok10500, Thailand, Tel. +66 2614 6000; Malaysia: Credit Suisse Securities (Malaysia) Sdn Bhd, Credit Suisse AG, Singapore Branch; India: Credit Suisse Securities (India) Private Limited (CIN no.U67120MH1996PTC104392) regulated by the Securities and Exchange Board of India as Research Analyst (registration no. INH 000001030) and as Stock Broker (registration no. INB230970637; INF230970637; INB010970631; INF010970631), having registered address at 9th Floor, Ceejay House, Dr.A.B. Road, Worli, Mumbai - 18, India, T- +91-22 6777 3777; South Korea: Credit Suisse Securities
(Europe) Limited, Seoul Branch; Taiwan: Credit Suisse AG Taipei Securities Branch; Indonesia: PT Credit Suisse
36
http://new.guap.ru/i04/contacts
vk.com/id446425943
Securities Indonesia; Philippines: Credit Suisse Securities
(Philippines ) Inc., and elsewhere in the world by the relevant authorized affiliate of the above.
Additional regional disclaimers
Hong Kong: Credit Suisse (Hong Kong) Limited (“CSHK”) is licensed and regulated by the Securities and Futures Commission of Hong Kong under the laws of Hong Kong, which differ from Australian laws. CSHKL does not hold an Australian financial services license (AFSL) and is exempt from the requirement to hold an AFSL under the Corporations Act
2001 (the Act) under Class Order 03/1103 published by the ASIC in respect of financial services provided to Australian wholesale clients (within the meaning of section 761G of the Act). Research on Taiwanese securities produced by Credit Suisse AG, Taipei Securities Branch has been prepared by a registered Senior Business Person. Malaysia: Research provided to residents of Malaysia is authorized by the Head of
Research for Credit Suisse Securities (Malaysia) Sdn Bhd, to whom they should direct any queries on +603 2723 2020.
Singapore: This report has been prepared and issued for distribution in Singapore to institutional investors, accredited investors and expert investors (each as defined under the Financial Advisers Regulations) only, and is also distributed by Credit Suisse AG, Singapore branch to overseas investors (as defined under the Financial Advisers Regulations). By virtue of your status as an institutional investor, accredited investor, expert investor or overseas investor, Credit Suisse AG, Singapore branch is exempted from complying with certain compliance requirements under the Financial Advisers
Act, Chapter 110 of Singapore (the “FAA”), the Financial Advisers Regulations and the relevant Notices and Guidelines issued thereunder, in respect of any financial advisory service which Credit Suisse AG, Singapore branch may provide to you. UAE: This information is being distributed by Credit
Suisse AG (DIFC Branch), duly licensed and regulated by the Dubai Financial Services Authority (“DFSA”). Related financial services or products are only made available to Professional
Clients or Market Counterparties, as defined by the DFSA, and are not intended for any other persons. Credit Suisse AG
(DIFC Branch) is located on Level 9 East, The Gate Building, DIFC, Dubai, United Arab Emirates. UK: The protections made available by the Financial Conduct Authority and/or the
Prudential Regulation Authority for retail clients do not apply to investments or services provided by a person outside the
UK, nor will the Financial Services Compensation Scheme
be available if the issuer of the investment fails to meet its obligations. To the extent communicated in the United
Kingdom (“UK”) or capable of having an effect in the UK, this document constitutes a financial promotion which has been approved by Credit Suisse (UK) Limited which is authorized by the Prudential Regulation Authority and regulated by the Financial Conduct Authority and the Prudential Regulation Authority for the conduct of investment business in the
UK. The registered address of Credit Suisse (UK) Limited is Five Cabot Square, London, E14 4QR. Please note that the rules under the UK’s Financial Services and Markets Act 2000 relating to the protection of retail clients will not be applicable to you and that any potential compensation made available to “eligible claimants” under the UK’s Financial Services Compensation Scheme will also not be available to you. Tax treatment depends on the individual circumstances of each client and may be subject to changes in future. USA: This material is issued and distributed in the U.S. by
CSSU, a member of NYSE, FINRA, SIPC and the NFA, and
CSSU accepts responsibility for its contents. Clients should contact analysts and execute transactions through a Credit
Suisse subsidiary or affiliate in their home jurisdiction unless governing law permits otherwise. EU: This report has been produced by subsidiaries and affiliates of Credit Suisse operating under its Global Markets Division and/or International
Wealth Management Division.
This document may not be reproduced either in whole, or in part, without the written permission of the authors and Credit Suisse. It is expressly not intended for persons who, due
to their nationality or place of residence, are not permitted access to such information under local law.
© 2019 Credit Suisse Group AG and/or its affiliates. All rights reserved.
http://new.guap.ru/i04/contacts |
AI & The Future of Work |
37 |
|
|
vk.com/id446425943
Also published by the Research Institute
CS Global Investment
Returns Yearbook 2017
February 2017
The Swiss Family
Business Model
September 2017
Emerging Consumer
Survey 2018
March 2018
Emerging Consumer
Survey 2017
March 2017
Global Wealth Report 2017
November 2017
The Future of GDP
May 2018
CREDIT SUISSE AG
Research Institute
Paradeplatz 8, CH-8070 Zurich, Switzerland research.institute@credit-suisse.com credit-suisse.com/researchinstitute
CSRI Special Report: The Chinese Consumer in 2017
April 2017
The Future of Politics – Davos edition
January 2018
The CS Family 1000 in 2018
September 2018
Switzerland: A Financial
Market History
June 2017
Eradicating Extreme Poverty – Davos edition
January 2018
Global Wealth Report 2018
October 2018
The CS Family 1000
September 2017
Summary Edition:
CS Global Investment
Returns Yearbook 2018
February 2018
Asia in Transition
November 2018
40
http://new.guap.ru/i04/contacts

vk.com/id446425943
Февраль 2019 года | 19-й выпуск | ey.com/CCB
Россия Барометр уверенности компаний
Как провести время с пользой, пока рынок M&A находится в режиме ожидания?
У вас есть вопрос? У нас есть ответ.
Решая сложные задачи бизнеса, мы улучшаем мир.
http://new.guap.ru/i04/contacts

vk.com/id446425943
Аппетит к сделкам достиг |
% |
опрошенных в мире планируют |
|
исторического минимума |
|||
приобретения в течение следующих |
|||
за последние четыре года, только |
46 |
12 месяцев. |
|
|
|
||
|
|
|
|
Многие компании стали чаще |
68 |
|
|
% пересматривают портфель раз |
|||
|
|
российских респондентов |
|
пересматривать портфели, теперь |
|
в полгода или ежеквартально. |
|
|
|
|
|
Более частый пересмотр портфеля |
76% российских компаний. |
||
приводит к выявлению большего |
|||
количества активов, от которых |
|||
компании по тем или иным причинам |
|||
готовы отказаться, рассматривают |
|
|
|
возможность продажи активов |
|
|
|
|
|
|
|
Основными покупателями могут |
% |
|
|
выступить фонды прямых |
российских респондентов. |
||
инвестиций, о чем заявляют |
50 |
|
|
|
77 |
|
|
Конкуренция за интересные активы |
% опрошенных. |
||
усилится, по мнению |
|
|
|
|
|
|
|
В целом ситуация на российском рынке |
% |
респондентов ожидают роста |
|
слияний и поглощений благоприятна |
доступности кредитных средств |
||
и повышения стоимости |
|||
для заключения сделок, и более |
70 |
акционерного капитала. |
|
Замедление активности на рынке M&A |
72 |
|
|
носит временный характер |
% ожидают улучшения ситуации |
||
|
|
российских участников рынка |
|
и обусловлено рядом факторов, |
|
в ближайшие 12 месяцев. |
|
поэтому |
|
|
|
|
|
|
|
Необходимо извлечь уроки из сделок, |
|
|
|
заключенных ранее, с учетом того, что |
% |
опрошенных полагают, что плани |
|
более половины из них не позволили |
рование интеграции позволило бы |
||
существенно повысить эффект |
|||
достичь эффекта синергии, |
60 |
синергии. |
|
на который рассчитывали компании, и |
|
|
|
http://new.guap.ru/i04/contacts

vk.com/id446425943
Содержание
2 Макроэкономическая ситуация
4 В фокусе: Brexit
6 Изменения в структуре портфеля и кадровой политике
8 Перспективы рынка слияний и поглощений
10 В фокусе: интеграция и синергия
12 Отрасли и страны
Профиль участников: |
В сентябре-октябре 2018 года были опрошены более 2600 руководителей |
|
высшего звена. |
|
Респонденты представляли 45 стран, включая Россию (64 опрошенных). |
|
Участвовали топ-менеджеры компаний из 14 отраслей. |
|
Среди них — 1567 исполнительных и финансовых директоров, а также |
|
других представителей руководства. |
http://new.guap.ru/i04/contacts |
Россия | Барометр уверенности компаний | 1 |
|

vk.com/id446425943
Алексей Иванов
Партнер EY, руководитель практики консультационных услуг по сделкам в СНГ
Настроения в зале ожидания,
или Ваш рейс задерживается
Неспроста авторство фразы «Все приходит вовремя для того, кто умеет ждать» приписывают и Франсуа Рабле, и Льву Толстому, ведь такой подход сохраняет актуальность в разных сферах, в том числе в условиях текущей экономической ситуации. Сегодня на российском рынке M&A царит такая же атмосфера, как
в зале ожидания: никто никуда не спешит, все ждут отправления транспорта, согласно расписанию и купленным билетам. Аппетит к сделкам упал до исторического минимума за последние четыре года: только 46% опрошенных в мире (и 27% в России) планируют приобретения в течение следующих 12 месяцев.
Фокус сместился с приобретения на сохранение «нажитого непосильным трудом». Следуя завету известного литературного и мультипликационного героя Филеаса Фогга «Используй то, что под рукою и не ищи себе другое», компании направляют усилия на то, чтобы извлечь максимальный полезный эффект из существующих активов и сохранить сотрудников, — вопрос мотивации, вознаграждения и удержания существующих специалистов беспокоит 60% российских респондентов и является основным на повестке дня.
Впопытках оптимизировать деятельность и избавиться от лишнего респонденты продолжают часто пересматривать портфели — раз в полгода или ежеквартально (68% российских опрошенных). Это приводит к выявлению большего количества активов, от которых компании по тем или иным причинам готовы отказаться: 76% российских компаний рассматривают возможность продажи активов. Логично, что при этом предложение по-прежнему превышает спрос, при этом, по мнению 77% респондентов, конкуренция за интересные активы усилится, а 50% опрошенных считают, что основными покупателями могут выступить фонды прямых инвестиций.
Вцелом ситуация благоприятна для заключения сделок, и «пассажиры» в нашем зале ожидания настроены оптимистично: более 70% респондентов ожидают роста доступности кредитных средств и стоимости акционерного капитала. Замедление активности на рынке M&A, как до сих пор считают многие, носит временный характер и обусловлено объективными факторами. Понимая это, 72% российских участников рынка ожидают улучшения ситуации в ближайшие 12 месяцев.
Пока рынок сделок стоит на паузе, есть смысл использовать затишье себе во благо — тщательно обдумать ранее проведенные транзакции и сделать соответ-
ствующие выводы. Респонденты отмечают, что более половины заключенных сделок не позволили достичь эффекта синергии, на который рассчитывали компании. По мнению 60% опрошенных, исправить такую ситуацию — существенно повысить эффект синергии — поможет заблаговременное планирование.
Время в зале ожидания может тянуться медленно, но никому еще не удалось остаться там навсегда, даже герою американского фильма «Терминал». Рано или поздно активность возобновится, и мы будем наблюдать совсем иную картину. Главное — дождаться!
http://new2 | Россия |.Барометрguap.уверенностиru/i04/contactsкомпаний

vk.com/id446425943
Макроэкономическая
ситуация
?Как Вы оцениваете текущее состояние российской экономики?
?Оцените степень Вашей уверенности в следующих показателях российского рынка:
Улучшается
Остается без изменений
Ухудшается
60% российских респондентов считают, что экономика страны улучшается, однако увеличилась доля тех, кто негативно оценивает ситуацию (9% респондентов). 85% глобальных респондентов ожидают улучшения или стабилизации роста мировой экономики. Того же мнения придерживаются и российские опрошенные: 70% считают, что ситуация улучшится либо не изменится.
По оценке экспертов, рост мировой экономики сохранял стабильность, несмотря на усиление торговой напряженности. По сравнению с предыдущими периодами россияне начали проявлять бóльшую степень уверенности в доступности кредитных средств и оценке стоимости акционерного капитала, в то время как доходность компаний стала вызывать опасения.
|
|
|
|
|
|
|
|
|
|
2% |
|
|
9% |
|
|
|
|
|
|
|
|
|
|
|||||||||||||||
16% |
40% |
|
|
|
|
|
|
31% |
|
|
|
|
|
|
|
Улучшается |
||||||||||||||||||||||
50% |
58% |
60% |
|
|
Остается без изменений |
|||||||||||||||||||||||||||||||||
|
|
Ухудшается |
||||||||||||||||||||||||||||||||||||
|
|
|
|
|
|
|
|
|
|
|
|
|
|
|
|
|
|
|
|
|
|
|
|
|
|
|
|
|
|
|
|
|||||||
|
|
Ухудшается |
|
|
|
|
|
Улучшается |
|
|
|
Улучшается |
|
|
|
|
|
|
|
|
||||||||||||||||||
34% |
|
|
|
|
|
|
|
|
|
|
|
|
|
|
|
|
|
|
|
|
|
|
|
|
|
|
|
|
|
|||||||||
Октябрь 2017 года |
Апрель 2018 года |
Октябрь 2018 года |
|
|
|
|
|
|
|
|
||||||||||||||||||||||||||||
|
|
|
|
|
|
|
|
|
|
|
|
|
|
|
|
|
|
|
|
|
|
|
|
|
|
|
|
|
|
|
Оценка стоимости |
|||||||
|
|
|
|
|
|
|
|
|
|
|
|
|
|
|
|
|
|
|
|
|
|
Стабильность |
акционерного капи- |
|||||||||||||||
|
|
|
|
|
|
|
|
|
|
|
|
|
|
|
|
|
|
|
|
|
|
рынка капитала |
тала / перспективы |
|||||||||||||||
Доходность |
|
Доступность |
|
в краткосрочной |
на рынке ценных |
|||||||||||||||||||||||||||||||||
компаний |
|
кредитных средств |
|
перспективе |
бумаг |
|||||||||||||||||||||||||||||||||
|
|
|
36% |
|
|
|
|
|
70% |
|
|
|
|
64% |
|
|
|
72% |
||||||||||||||||||||
|
|
|
|
|
|
|
|
|
|
|
|
|
||||||||||||||||||||||||||
|
|
|
|
|
|
43% |
|
|
|
|
|
|
63% |
|
|
|
|
|
|
75% |
|
|
|
|
53% |
|
||||||||||||
|
|
|
|
|
|
|
|
|
|
|
|
|
|
|
|
|
|
|||||||||||||||||||||
|
|
|
|
28% |
|
|
|
|
|
|
|
|
30% |
|
|
|
|
|
|
|
30% |
|
|
|
|
|
24% |
|
|
|
|
|||||||
|
|
|
|
|
|
|
|
|
|
|
|
|
|
|
|
|||||||||||||||||||||||
|
|
|
53% |
|
|
|
|
22% |
|
|
|
|
|
|
|
30% |
|
|
|
|
23% |
|
|
|
|
|||||||||||||
|
|
|
|
|
|
|
|
|
|
|
||||||||||||||||||||||||||||
|
|
|
|
|
|
|
|
|
57% |
|
|
|
|
|
35% |
|
|
|
|
|
|
25% |
|
|
|
|
|
47% |
|
|||||||||
|
|
|
|
|
|
|
|
|
|
|
|
|
|
|
||||||||||||||||||||||||
|
|
|
|
|
|
|
45% |
|
|
|
|
|
|
|
48% |
|
|
|
|
|
|
34% |
|
|
|
|
|
|
52% |
|
||||||||
|
|
|
|
|
|
|
|
|
|
|
|
|
|
|
|
|
|
|
|
|||||||||||||||||||
|
11% |
|
|
|
|
|
|
|
8% |
|
|
|
|
|
|
|
|
6% |
|
|
|
|
|
|
|
5% |
|
|
|
|
|
|
||||||
|
|
|
|
|
|
|
|
|
||||||||||||||||||||||||||||||
0% |
27% |
|
|
|
|
2% |
22% |
|
|
|
0% |
|
|
|
36% |
|
|
0% |
|
24% |
|
|
|
|
||||||||||||||
|
|
|
|
|
|
|||||||||||||||||||||||||||||||||
|
|
|
|
|
|
|
|
|
|
|
|
|
|
|
|
|
|
|
|
|
|
|
|
|
|
|
||||||||||||
|
|
|
|
|
|
|
|
|
|
|
|
|
|
|||||||||||||||||||||||||
|
|
Октябрь 2017 года |
|
|
|
|
Апрель 2018 года |
|
|
|
Октябрь 2018 года |
|
|
|
|
|
|
|
|
|||||||||||||||||||
|
|
|
|
|
|
|
|
|
|
|
|
|
|
|
|
|
||||||||||||||||||||||
К числу рисков, угрожающих развитию бизнеса в ближайшей перспективе, российские респонденты относят внешние факторы, в том числе новые глобальные тренды (развитие технологий, цифровизацию, размывание границ между секторами, изменение моделей покупательского поведения и конкурен цию со стороны нетрадиционных игроков, таких как стартапы и цифровые компании), деглобализацию и неопределенность в плане регуляторики, геополи тики и направления политического курса. При этом доля респондентов, обеспокоенных геополитической напряженностью, заметно снизилась — с 55% до 28%.
http://new.guap.ru/i04/contacts |
Россия | Барометр уверенности компаний | 3 |
|

vk.com/id446425943
В фокусе
Brexit
Респонденты предпочли бы, чтобы в результате переговоров Великобритании с ЕС, были использованы устоявшиеся модели.
•Компании могут учитывать при планировании стратегии варианты Brexit и вытекающие
из них торговые отношения с ЕС, построенные на уже знакомых принципах, как, например, швейцарские, норвежские или канадские модели.
•Существующая «Белая книга» (White Paper) менее популярна, будучи незнакомой концепцией, которая может создать новые сложности для компаний.
•Респонденты не хотят продолжения неопределенности, которая повлечет за собой второй референдум в Великобритании или отказ от правил ВТО. Такой «жесткий Brexit» будет проблематичным для многих компаний.
Хотя исследование проводилось еще до того, как предположительно финаль ный проект Brexit вызвал разногласия в британском парламенте, тема сохраняет актуальность, пока договоренности о выходе Великобритании из ЕС не будут финализированы.
Почти половина респондентов (41% по всему миру, 48% в России) высказываются в пользу того, чтобы Великобритания приняла модель швейцарского соглашения об экономической свободной торговле, и только 5% поддерживают идею проведения второго референдума в Великобритании. Значительная доля респондентов (52% в России и 43% в мире) утверждают, что будут реже приобретать финансовые продукты и услуги у лондонских провайдеров, после того как Великобритания покинет ЕС.
Несмотря на то, что экономика Великобритании является крупнейшей экономикой мира и влияет на все глобальные процессы, россияне, в отличие от других респондентов, меньше обеспокоены негативными последствиями Brexit. Это может быть связано с ограничением доступа к мировым рынкам
капитала, как и с тем, что немногие российские компании ведут бизнес именно в Соединенном Королевстве.
Большинство российских респондентов считает, что даже при выходе Великобритании из ЕС ощутимый ущерб для ведения бизнеса будет связан с сокращением масштабов операционной деятельности и численности персонала на территории ЕС. Что касается других сфер, на которые потенциально
может повлиять это событие, респонденты по большей части уверены в сохранении стабильности бизнеса.
http://new4 | Россия |.Барометрguap.уверенностиru/i04/contactsкомпаний
vk.com/id446425943
?Как и в каких сферах, по Вашему мнению, может
повлиять на Ваш бизнес / деятельность выход Великобритании из ЕС в марте 2019 года?
Доход в перспективе от краткосрочной до среднесрочной
Сохранение и наем сотрудников, включая свободное передвижение персонала
Масштаб операционной деятельности и численность персонала в Великобритании
Масштаб операционной деятельности и численность персонала в ЕС
Инвестиции (в том числе в персонал) и приобретения в Великобритании
Инвестиции (в том числе в персонал) и приобретения в ЕС
Инвестиции (в том числе в персонал) и приобретения за пределами Великобритании
Инвестиции (в том числе в персонал) и приобретения за пределами ЕС
|
Изменится |
Останется |
Изменится |
|
в худшую |
в лучшую |
|
|
без изменений |
||
|
сторону |
сторону |
|
|
|
||
|
|
|
19% |
|
45% |
36% |
20% |
|
|
|
|
36% |
44% |
16% |
|
|
|
|
|
33% |
51% |
19% |
|
|
|
|
|
51% |
30% |
16% |
|
|
|
|
|
46% |
38% |
13% |
|
|
|
|
|
41% |
46% |
23% |
|
41% |
36% |
||
37% |
33% |
30% |
|
http://new.guap.ru/i04/contacts |
Россия | Барометр уверенности компаний | 5 |
|

vk.com/id446425943
Изменения в структуре портфеля
и кадровой политике
Более частый пересмотр портфелей, вероятно, приведет к выявлению большего количества активов для отчуждения: увеличивается доля руководителей (более 73% в России), которые пересматривают портфели каждые шесть месяцев, ежеквартально или чаще. В результате 76% компаний определили активы для продажи, притом что доля потенциальных покупателей составляет лишь 27%. Это говорит о значительном разрыве между спросом и предложением.
? Как часто Вы |
2% |
1% |
Реже, чем раз в год |
||
|
пересматриваете |
|
|
|
|
|
свой портфель? |
|
|
|
|
25% |
33% |
|
|
Ежегодно |
|
|
|
|
|||
|
|
|
|||
Каждое полугодие
46% 40%
22% |
|
22% |
|
Каждый квартал |
|
|
|
||
|
5% |
4% |
Непрерывно |
|
|
|
|
Российские респонденты |
Все респонденты |
?Какое основное действие Вы предприняли в результате последнего пересмотра портфеля?
27% |
49% |
опрошенных готовы продать |
респондентов готовы продать |
те активы, которые связаны с риском |
экономически неэффективные |
прекращения деятельности |
активы |
Мы выявили экономически неэффективные активы для продажи
Мы выявили активы, связанные с риском прекращения деятельности, для продажи
Мы определили области, в которых необходимо осуществить приобретения
Мы, используя дифференцированный подход, инвестировали капитал в определенную бизнес-единицу
Мы не предпринимали никаких определенных действий
Мы перераспределили капитал в рамках всего портфеля
 49% 34%
 27%
27%
39%
 11% 14%
 6%
6%  7%
7%
 5%
5%  3%
3%
 2%
2%  3%
3%
 Российские респонденты
  Все респонденты
http://new6 | Россия |.Барометрguap.уверенностиru/i04/contactsкомпаний
vk.com/id446425943
Изменения в структуре портфеля и кадровой политике
?На какой из вопросов распределения капитала
иформирования стратегии Ваша компания направляет наибольшее внимание
иресурсы?
?Какой из следующих вопросов, связанных с кадровой политикой, представляет для Вас
наибольшую проблему?
Влияние негативных внешних факторов и нестабильная геополитическая ситуация — не единственные причины, по которым портфели компаний пересматриваются все чаще. Респонденты также стремятся избавиться от неэффективных активов и операций, которые подвергаются рискам в результате развития цифровых технологий и чувствительны к изменениям спроса клиентов.
Совершенствование управления оборотным |
|
|
|
|
|
|
|
|
|
|
|
|
30% |
||||
|
|
|
|
|
|
|
|
|
|
|
|
||||||
капиталом |
|
|
|
|
|
|
|
|
|
|
|
|
|
|
|
28% |
|
|
|
|
|
|
|
|
|
|
|
|
|
||||||
Инвестирование в существующие операции |
|
|
|
|
|
|
|
|
|
|
|
|
|
26% |
|
||
|
|
|
|
|
|
|
|
|
|
|
|
||||||
|
|
|
|
|
|
|
|
|
|
|
|
|
|
27% |
|
||
|
|
|
|
|
|
|
|
|
|
|
|
|
|
|
|||
|
|
|
|
|
|
|
|
|
|
|
|
|
|
|
|||
Цифровая трансформация |
|
|
|
|
|
|
|
|
|
|
17% |
|
|
|
|
|
|
|
|
|
|
|
|
|
|
||||||||||
|
|
|
|
|
|
|
|
|
16% |
|
|
|
|
|
|
||
|
|
|
|
|
|
|
|
|
|
|
|
|
|
|
|||
|
|
|
|
|
|
|
|
|
|||||||||
Приобретения, совместные предприятия |
|
|
|
|
|
|
|
|
12% |
|
|
|
|
|
|
|
|
|
|
|
|
|
|
|
|
||||||||||
и альянсы |
|
|
|
|
|
|
|
11% |
|
|
|
|
|
|
|
|
|
|
|
|
|
|
|
|
|
||||||||||
Совершенствование структуры капитала |
|
|
|
|
|
|
10% |
|
|
|
|
|
|
|
|
||
|
|
|
|
|
|
|
|
||||||||||
в ответ на изменение условий* |
|
|
|
|
12% |
|
|
|
|
|
|
|
|
||||
|
|
|
|
|
|
|
|
|
|
||||||||
Отчуждение активов |
|
|
|
|
3% |
|
|
|
|
|
|
|
|
|
|
|
|
|
|
|
|
|
|
|
|
||||||||||
|
|
|
|
|
4% |
|
|
|
|
|
|
|
|
|
|
|
|
|
|
|
|
|
|
|
|
|
|
|
|
|
|
|
|
||
|
|
|
|
|
|
|
|
|
|
|
|
|
|
|
|||
Возврат капитала акционерам |
|
|
|
2% |
|
|
|
|
|
|
|
|
|
|
|
||
|
|
|
|
|
|
|
|
||||||||||
|
|
|
2% |
|
|
|
|
|
|
|
|
|
|
|
|||
|
|
|
|
|
|
|
|
||||||||||
* Процентные ставки, валютные риски, |
|
|
Российские респонденты |
|
Все респонденты |
||||||||||||
|
|
||||||||||||||||
налоговый режим / законодательство |
|
|
|
|
|
|
|
|
|
|
|
|
|
|
|
|
|
Игроки рынка заняли выжидательную позицию, стремясь сохранить текущие активы и человеческие ресурсы. Все сосредоточены на существующем бизнесе и максимизации полезного эффекта от активов, которые находятся в распоряжении компании здесь и сейчас.
Вопрос мотивации, вознаграждения и удержания существующих специалистов
60%
 43%
43%
Сложности с переобучением персонала в целях адаптации к новым технологиям или бизнес-моделям
34%
 29%
29%
Вопросы поиска и найма персонала с требуемой квалификацией
 6%
6%
23%
Ограничение свободного передвижения рабочей силы
0%
5%
 Российские респонденты
  Все респонденты
Замедление автоматизации производства и бизнес-процессов, а также современная демографическая ситуация, связанная с низкими показателями рождаемости 90-х годов, сказывается на рынке труда в России. Спрос на рабочую силу растет, а предложение ограничено в силу отмеченных демографических тенденций. При таком климате на рынке труда неудивительно, что работодатели нацелены на мотивацию и удержание существующих сотрудников.
http://new.guap.ru/i04/contacts |
Россия | Барометр уверенности компаний | 7 |
|
vk.com/id446425943
Перспективы рынка слияний и поглощений
? |
Как, по Вашему мнению, |
Российские респонденты |
Все респонденты |
|
изменится ситуация |
|
|
|
на мировом рынке слияний |
|
|
|
и поглощений в ближайшие |
|
|
|
12 месяцев? |
|
|
?Как, по Вашему мнению, изменится ситуация на отечественном рынке слияний и поглощений
в ближайшие 12 месяцев?
45% |
88% |
84% |
52% |
12% |
13% |
3% |
0% |
3% |
57% |
86% |
90% |
41% |
14% |
9% |
2% |
0% |
1% |
Улучшится |
Останется |
Ухудшится |
Улучшится |
Останется |
Ухудшится |
||||||||||||
|
|
|
без изменений |
|
|
|
|
|
|
без изменений |
|
|
|
||||
Октябрь 2017 года |
Апрель 2018 года |
|
Октябрь 2018 года |
|
|
|
|
|
|
||||||||
|
|
|
|
|
|
|
|
|
|
|
|
|
4% |
|
|
6% |
|
54% |
|
73% |
72% |
|
42% |
|
27% |
22% |
|
|
|
0% |
|
|
|||
|
|
|
|
|
|
|
|
|
|||||||||
|
|
Улучшится |
|
|
|
Останется без изменений |
|
|
|
Ухудшится |
|
|
|||||
Октябрь 2017 года |
Апрель 2018 года |
|
Октябрь 2018 года |
|
|
|
|
|
|
||||||||
Среди основных стратегических драйверов для приобретений 20% российских респондентов называют выход на новые рынки, инвестиции в персонал и поиск надежных каналов поставок.
31% российских респондентов считают увеличение барьеров для трансграничных сделок одной из главных тенденций на рынке слияний и поглощений в течение следующих 12 месяцев.
http://new8 | Россия |.Барометрguap.уверенностиru/i04/contactsкомпаний
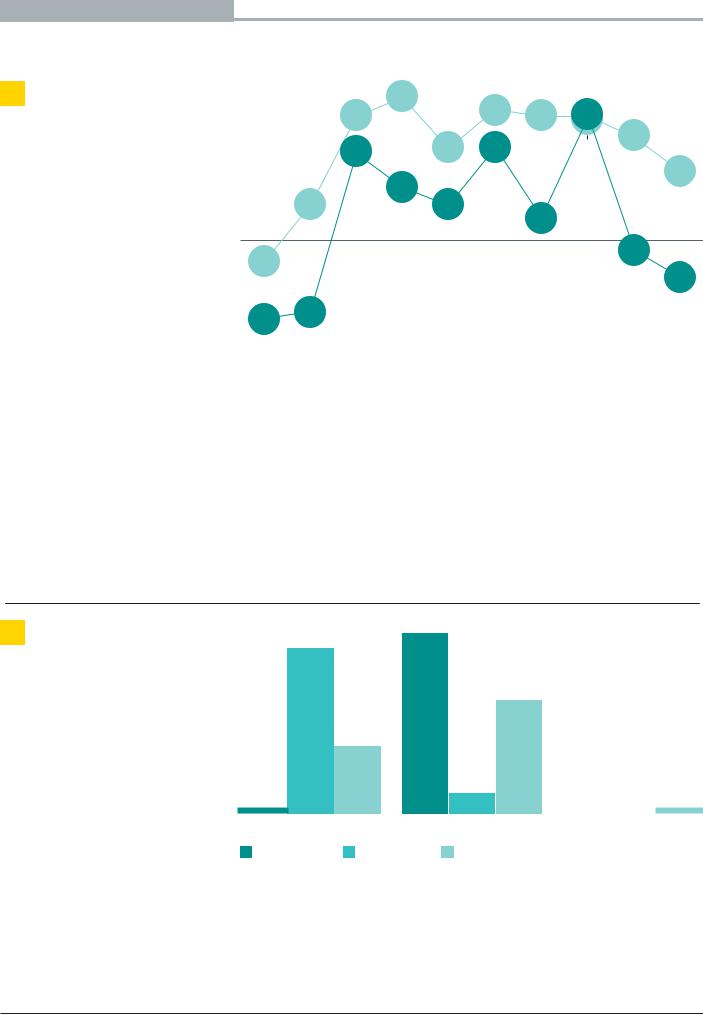
vk.com/id446425943
Перспективы рынка слияний и поглощений
? |
Планирует ли Ваша компания |
|
|
59% |
|
|
|
|
приобретение активов |
|
|
|
57% |
|
|
|
в течение ближайших |
|
56% |
|
56% |
57% |
|
|
12 месяцев? |
|
|
|
|
|
52% |
|
|
|
49% |
50% |
50% |
|
56% |
|
|
|
|
|
|
|
|
|
|
|
|
|
|
|
46% |
|
|
|
|
43% |
|
|
|
|
|
40% |
|
40% |
|
38% |
|
|
|
|
|
|
|
|
|
|
30% |
|
|
|
34% |
|
32% |
|
|
|
|
|
|
||
|
|
|
Среднее значение, согласно результатам |
|
|||
|
|
|
|
27% |
|||
|
|
|
|
исследования «Барометр уверенности компаний» |
|||
|
|
|
|
по России с 2010 года |
|
|
|
|
20% |
21% |
|
|
|
|
|
|
|
|
|
|
|
|
|
Апрель Октябрь Апрель Октябрь Апрель Октябрь Апрель Октябрь Апрель Октябрь 2014 года 2014 года 2015 года 2015 года 2016 года 2016 года 2017 года 2017 года 2018 года 2018 года
 Российские респонденты
  Все респонденты
Если говорить об основных рисках, угрожающих заключению сделок в ближайшие 12 месяцев, российских респондентов в меньшей степени беспокоят сложности с выявлением высококачественных активов и финансированием сделок, как и высокая оценка стоимости активов и позиция акционеров. Гораздо большую тревогу вызывают регулирование и геополитическая неопределенность. 49% видят риски для заключения сделок в регулировании и геополитической неопределенности.
|
|
Среди прочих — трудности с выявлением качественных активов (25%) и доступ- |
||||||||
|
|
ностью финансирования (18%). |
|
|
|
|
|
|||
? |
Каковы Ваши ожидания |
Российские респонденты |
|
|
|
|
|
|
||
|
в части количества сделок, |
|
|
|
|
|
|
|
|
|
|
которые завершит Ваша |
|
|
|
|
|
|
|
|
|
|
компания в течение |
|
|
|
|
|
|
|
|
|
|
следующих 12 месяцев, |
|
|
|
|
|
|
|
|
|
|
по сравнению с аналогичным |
|
|
|
|
|
|
|
|
|
|
показателем за предыдущие |
|
|
|
|
|
|
|
|
|
|
12 месяцев? |
|
|
|
|
|
|
|
|
|
|
|
3% |
89% |
36% |
97% |
11% |
61% |
0% |
0% |
3% |
|
|
|
|
|||||||
|
|
|
Улучшится |
|
Останется без изменений |
|
Ухудшится |
|
||
|
|
Октябрь 2017 года |
Апрель 2018 года |
Октябрь 2018 года |
|
|
|
|||
http://new.guap.ru/i04/contacts |
Россия | Барометр уверенности компаний | 9 |
|
vk.com/id446425943
Перспективы рынка слияний и поглощений
|
Были ли у Вас случаи |
11% |
89% |
|
Если да, то по какой причине |
? |
? |
||||
|
незавершения или отказа |
Нет |
Да |
|
сделка не была завершена? |
|
от запланированной сделки |
|
|
за предыдущие 12 месяцев? |
Вмешательство активных инвесторов |
|
|
|
23% |
|
20% |
Вмешательство со стороны регуляторов или государственных органов
 22% 23%
?Какими будут основные тенденции на рынке слияний и поглощений в течение ближайших 12 месяцев?
Конкуренция со стороны других покупателей или расхождение в цене / оценке
 18%
18%
20%
Сомнения относительно соблюдения требований антимонопольного законодательства
 15%
15%
 13%
13%
Вопросы, возникшие в ходе проведения комплексной проверки перед сделкой
 10%
10%
 11%
11%
Усиление протекционизма и опасения относительно торговой политики
 9%
9%
12%
Проблемы с культурной интеграцией
3%
 1%
1%
 Российские респонденты
  Все респонденты
Рост числа барьеров, препятствующих трансграничным сделкам
31%
23%
Возвращение фондов прямых инвестиций как основного покупателя активов
 22%
22%
31%
Увеличение количества межсекторальных сделок, связанных с развитием технологий и цифровизацией
 22%
22%
27%
Продолжение активности в плане заключения мегасделок на рынке слияний и поглощений
17%
 12%
12%
Увеличение количества сделок с участием конкурентов
 5%
5%
 5%
5%
Замедление активности на рынке слияний и поглощений
 3%
3%
 2%
2%
 Российские респонденты
  Все респонденты
http://new10 | Россия .|guapБарометр.ru/i04/contactsуверенности компаний

vk.com/id446425943
?Ожидаете ли Вы роста числа конкурентов при приобретении активов в течение ближайших 12 месяцев?
Российские респонденты
23% |
77% |
Нет |
Да |
Со стороны фондов прямых инвестиций и других фондов
 50%
50%
Со стороны корпоративных инвестиционных фондов
 31%
31%
Со стороны корпоративных покупателей
 19%
19%
Все респонденты
32% |
68% |
Нет |
Да |
Со стороны фондов прямых инвестиций и других фондов
 46%
46%
Со стороны корпоративных инвестиционных фондов
 39%
39%
Со стороны корпоративных покупателей
 15%
15%
Новые источники частного капитала, поступающие на рынок, обостряют конкуренцию. Помимо традиционных прямых инвестиций, руководители ожидают усиления давления на активы со стороны венчурного капитала, корпоративных венчурных фондов, суверенных фондов и компаний по управлению частным капиталом.
Частный капитал вкладывает все больше средств, ориентируясь на среднесрочную и долгосрочную перспективу. Частные инвесторы также возвраща ются на рынок слияний и поглощений со значительной покупательской способностью. Поэтому руководители должны быть готовы к усилению конкуренции за активы или к совместному инвестированию.
http://new.guap.ru/i04/contacts |
Россия | Барометр уверенности компаний | 11 |
|

vk.com/id446425943
В фокусе
Интеграция и синергия
?Как нужно изменить подход к заключению сделок
на растущем рынке, чтобы повысить вероятность достижения синергии, необходимой для обоснования стоимости транзакций?
|
|
|
|
|
60% |
|
|
|
|
|
Начинать процесс |
|
|
|
|
|
интеграции раньше |
Применять более |
|
|
|
|
|
|
|
49% |
|
||
агрессивный подход |
20% |
|
|
||
при постановке целей |
|
|
|
|
|
в плане синергии/ |
|
|
|
|
Уделять больше |
трансформации |
|
|
|
|
|
18% |
|
|
внимания вопросам |
||
|
|
|
|||
|
|
|
|
|
назначения руководителей |
|
11% |
|
7% |
для процесса интеграции |
|
Ничего не менять |
|
|
|||
|
|
|
|
|
|
26% 9%
 Российские респонденты
  Все респонденты
60% российских респондентов уже на ранних этапах сделки готовятся к внедре нию и интегрированию ее результатов. Приобретение активов обеспечит максимальный синергетический эффект только в том случае, если возможности для синергии будут выявлены заранее и будет создана система мониторинга, позволяющая отслеживать прогресс в этом отношении.
Тем не менее такая практика требует опыта в определении эффективно работающих бизнес-направлений и выявлении рисков, а также понимания ценности в транзакциях. Для получения конкурентного преимущества ценность сделки должна быть определена заранее, зачастую это приходится делать в условиях недостаточности информации.
Все бизнес-подразделения должны участвовать в процессе оценки потенциальной синергии, понимать важность доведения сделки до завершения и продвигать эту идею.
http://new12 | Россия .|guapБарометр.ru/i04/contactsуверенности компаний

vk.com/id446425943
Отрасли и страны
Основные отрасли, в которых планируются сделки слияний и поглощений
Горнодобывающая |
Промышленное |
Сектор потребительских |
|
товаров и розничная |
|||
и металлургическая отрасли |
производство |
||
торговля |
|||
|
|
||
|
|
|
|
Сектор технологий |
Медико-биологическая |
Автомобильная отрасль |
|
отрасль |
и транспорт |
||
|
|||
|
|
|
Основные инвестиционные направления, по мнению российских респондентов
1 |
2 |
3 |
4 |
|
5 |
|||||
|
|
|
|
|
|
|
|
|
|
|
|
|
|
|
|
|
|
|
|
|
|
|
|
|
|
|
|
|
|
|
|
|
|
|
|
|
|
|
|
|
|
|
|
|
|
|
|
|
|
|
|
|
|
|
|
|
|
|
|
|
|
|
|
|
|
Россия |
США |
ОАЭ |
Нидерланды |
Германия |
Об исследовании
«Барометр уверенности компаний» (Capital Confidence Barometer) измеряет степень уверенности компаний в перспективах развития экономики, дает представление о приоритетных задачах руководства, а также позволяет выявить основные тенденции в области управления капиталом.
Это периодическое исследование мнений руководителей высшего звена, которое проводит Economist Intelligence Unit (EIU). Группа респондентов включает отдельных международных клиентов и деловых партнеров EY, а также постоянных участников исследований EIU.
В сентябре и октябре 2018 года мы опросили более 2600 топ- менеджеров из 45 стран. При этом в группу респондентов вошли 64 руководителей российских компаний.
Среди российских респондентов 21% — руководители бизнес-подраз- делений департаментов, 60% — представители высшего исполнительного руководства, 19% — старшие вице-президенты / вице-президен- ты / директора.
Респонденты представляли 14 секторов экономики, среди которых нефтегазовая отрасль, промышленное производство, недвижимость
истроительство, автомобильная отрасль и перевозки, телекоммуникации, финансовые услуги, производство потребительских товаров
ирозничная торговля, сектор технологий, металлургическая и горнодобывающая отрасли.
По показателям годового дохода российские респонденты распределились следующим образом:
•менее 500 млн долларов США — 14%;
•от 500 млн долларов США до 1 млрд долларов США — 41%;
•от 1 млрд долларов США до 3 млрд долларов США — 16%;
•от 3 млрд долларов США до 5 млрд долларов США — 5%;
•от 5 млрд долларов США до 10 млрд долларов США — 11%,
•свыше 5 млрд долларов США — 13%.
По структуре собственности глобальных компаний респонденты распределились следующим образом: компании, акции которых котируются на биржах, — 48%; компании, находящиеся в частной собственности, — 50%; компании, находящиеся в семейной собственности — 0%; компании, принадлежащие государству, — 2%.
http://new.guap.ru/i04/contacts |
Россия | Барометр уверенности компаний | 13 |
|

vk.com/id446425943
EY | Assurance | Tax | Transactions | Advisory
Краткая информация о компании EY
EY является международным лидером в области аудита, налогообложения, сопровождения сделок и консультирования. Наши знания и качество услуг помогают укреплять доверие общественности к рынкам капитала и экономике в разных странах мира. Мы формируем выдающихся лидеров, под руководством которых наш коллектив всегда выполняет взятые на себя обязательства. Тем самым мы вносим
значимый вклад в улучшение деловой среды на благо наших сотрудников, клиентов и общества в целом.
Мы взаимодействуем c компаниями из стран СНГ, помогая им в достижении бизнес-целей. В 19 офисах нашей фирмы (в Москве, Санкт-Петербурге, Новосибирске, Екатеринбурге, Казани, Краснодаре, Ростове-на-Дону, Владивостоке, Тольятти, Алматы, Астане, Атырау, Бишкеке, Баку, Киеве, Ташкенте, Тбилиси, Ереване и Минске) работают 4500 специалистов.
Название EY относится к глобальной организации и может относиться к одной или нескольким компаниям, входящим в состав Ernst & Young Global Limited, каждая из которых является отдельным юридическим лицом. Ernst & Young
Global Limited — юридическое лицо, созданное в соответствии с законодательством Великобритании, — является компанией, ограниченной гарантиями ее участников, и не оказывает услуг клиентам. Более подробная информация представлена на нашем сайте: ey.com.
© 2019 «Эрнст энд Янг (СНГ) Б.В.» Все права защищены.
Информация, содержащаяся в настоящей публикации, представлена
всокращенной форме и предназначена лишь для общего ознакомления,
всвязи с чем она не может рассматриваться в качестве полноценной замены подробного отчета о проведенном исследовании и других упомянутых материалов и служить основанием для вынесения профессионального суждения. Компания EY не несет ответственности за ущерб, причиненный каким-либо лицам в результате действия или отказа от действия на основании сведений, содержащихся в данной публикации. По всем конкретным вопросам следует обращаться к специалисту по соответствующему направлению.
http://new.guap.ru/i04/contacts
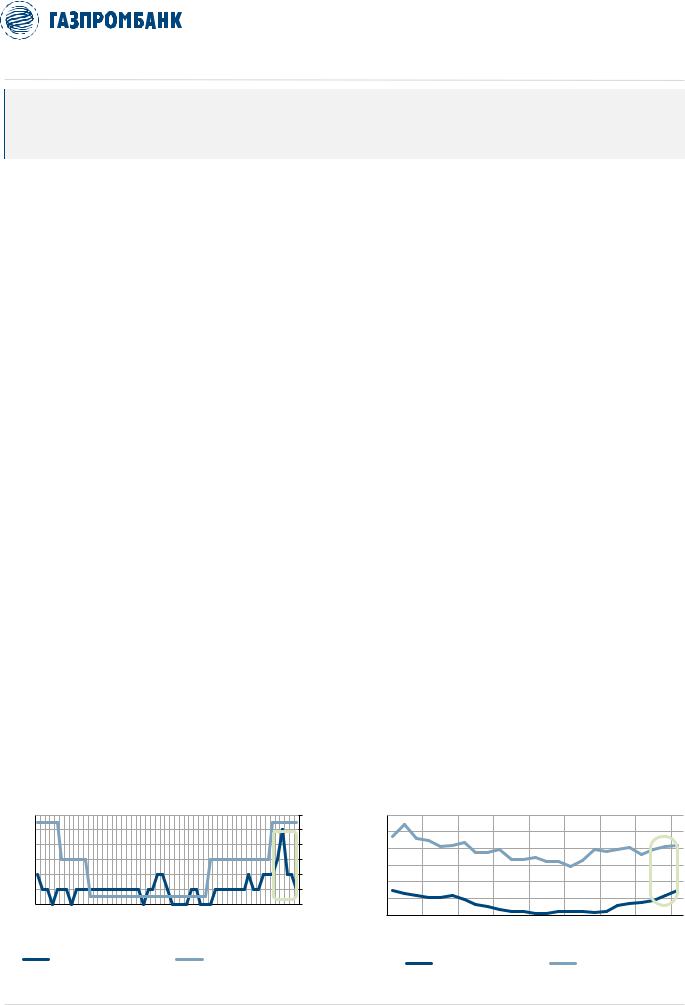
vk.com/id446425943
4 ФЕВРАЛЯ 2019 Г. |
МАКРОЭКОНОМИКА |
|
|
КЛЮЧЕВАЯ СТАВКА ЦБ РФ: ИЗМЕНЕНИЙ НЕ ЖДЕМ НА ФОНЕ УМЕРЕННОГО ВЛИЯНИЯ НДС
В пятницу, 8 февраля, ЦБ РФ проведет первое в этом году заседание, на котором примет решение по ключевой ставке. Влияние факторов, которые привели к повышению ставки в декабре, сейчас ослабло, поэтому мы ожидаем, что регулятор сохранит ее на текущем уровне 7,75%.
Риски резкого повышения инфляции до 5,5-6,0% в 1К19 ослабли. Умеренный темп роста недельных показателей позволяет предположить, что инфляция окажется ниже ранее озвученных прогнозов Банка России (5,5-6,0%) в 1К19. За период с 1 по 28 января ИПЦ составил 1,0%, что соответствует 5,0% в годовом выражении. Среднесуточный темп роста цен замедлился до 0,036% (с более чем 0,04% на 21 января и 0,05% на 9 января). Эффект от повышения НДС, который мы оцениваем на основе динамики топливных цен, жилищных и транспортных тарифов, составил 0,3 п.п. с 1 по 28 января, при этом основной вклад пришелся на 1-9 января. На конец января фактический вклад роста НДС в инфляцию составил 0,3 п.п. и оказался ниже оценок Банка России в 1,1 п.п. Эффект от роста НДС, скорее всего, уже достиг своего пика, и инфляция в годовом выражении не будет значимо ускоряться в ближайшие месяцы. Мы ожидаем инфляцию в районе 5,0-5,5% г/г в 1К19, что предполагает сохранение ключевой ставки на текущем уровне 7,75%.
Инфляционные ожидания населения в январе выросли умеренно, демонстрируя незначительную реакцию на изменение НДС. Оценка ожиданий в январе составила 10,4% (+0,2 п.п. за месяц). Опрос показал, что население реагирует на повышение фактической инфляции (в декабре помесячный темп роста цен ускорился до пикового уровня 0,8%). Хотя инфляционные ожидания, вероятно, останутся повышенными в 1К19 на фоне ускорения фактического роста цен из-за НДС, мы ожидаем понижательной динамики ожиданий и фактической инфляции с 2К19.
Фактор валютного риска на динамику цен сейчас отсутствует. Курс рубля к доллару укрепился на 5,5% с начала года, несмотря на возобновление покупок валюты в рамках бюджетного правила. На данный момент мы считаем риск ослабления курса RUB/USD незначимым вследствие покупок валюты. Подробнее см. («ЦБ РФ возобновит отложенные покупки валюты» от 28.01.2019).
Риски внешней конъюнктуры выглядят умеренно. Единственным фактором риска, который может привести к повышению ключевой ставки, на наш взгляд, остается неопределенность внешних условий, однако мы не считаем, что этот фактор будет являться определяющим для ужесточения монетарной политики.
Сергей Коныгин
+7 (495) 287 61 00 (доб. 5 29 08) Sergey.Konygin@gazprombank.ru
Диаграмма 1. Траектория недельной инфляции в январе |
|||||||||
замедляется |
|
|
|
|
|
|
|
|
|
0,6% |
|
|
|
|
|
|
|
|
7,8% |
0,5% |
|
|
|
|
|
|
|
|
7,7% |
0,4% |
|
|
|
|
|
|
|
|
7,6% |
0,3% |
|
|
|
|
|
|
|
|
7,5% |
0,2% |
|
|
|
|
|
|
|
|
7,4% |
0,1% |
|
|
|
|
|
|
|
|
7,3% |
0,0% |
|
|
|
25 ИЮН 18 |
|
|
|
|
7,2% |
09 ЯНВ 18 |
19 ФЕВ 18 |
02 АПР 18 |
14 МАЙ 18 |
06 АВГ 18 |
17 СЕН 18 |
29 ОКТ 18 |
10 ДЕК 18 |
28 ЯНВ 19 |
|
|
НЕДЕЛЬНЫЙ УРОВЕНЬ ИПЦ |
|
КЛЮЧЕВАЯ СТАВКА (ПР. ШК.) |
||||||
|
|
|
|
|
|
|
Источник:Росстат, ЦБ РФ |
||
Диаграмма 2. Инфляционные ожидания населения |
|
|||||||
выросли умеренно в январе, г /г |
|
|
|
|
|
|||
14% |
|
|
|
|
|
|
|
|
12% |
|
|
|
|
|
|
|
|
10% |
|
|
|
|
|
|
|
|
8% |
|
|
|
|
|
|
|
|
6% |
|
|
|
|
|
|
|
|
4% |
|
|
|
|
|
|
|
|
2% |
АПР 17 |
ИЮЛ 17 |
ОКТ 17 |
|
АПР 18 |
ИЮЛ 18 |
ОКТ 18 |
|
ЯНВ 17 |
ЯНВ 18 |
ЯНВ 19 |
||||||
|
|
ФАКТИЧЕСКАЯ ИНФЛЯЦИЯ |
|
ОЖИДАЕМАЯ ИНФЛЯЦИЯ |
||||
|
|
|
|
|
Источник:Росстат, ЦБ РФ |
|||
Департамент анализа |
|
Copyright © 2003-2019 |
рыночной конъюнктуры |
|
Газпромбанк (Акционерное общество) |
http://new.guap.ru/i04/contacts |
1 |
Все права защищены |
|

vk.com/id446425943
117420, г. Москва, ул. Наметкина, 16, стр. 1. |
Офис: ул. Коровий вал, 7 |
|
|
Департамент анализа рыночной конъюнктуры |
|
|
|
+7 (495) 983 18 00 |
|
|
|
ПРОДАЖА ИНСТРУМЕНТОВ ФОНДОВОГО РЫНКА |
ПРОДАЖА ДОЛГОВЫХ ИНСТРУМЕНТОВ |
|
|
+7 (495) 988 24 10 |
+7 (495) 980 41 82 |
Copyright © 2003 – 2019. Газпромбанк (Акционерное общество). Все права защищены
Ограничение ответственности
Настоящий документ подготовлен Департаментом анализа рыночной конъюнктуры Газпромбанка (Акционерное общество) (далее – «Газпромбанк» или «мы»), зарегистрированного в Москве, Россия, и имеющего лицензию, выданную Центральным банком Российской Федерации. Если в настоящем документе присутствует обращение к «вам», то такое обращение адресовано к вам или вашей организации.
Настоящий документ является инвестиционной рекомендацией согласно положениям Директивы ЕС «О рынках финансовых инструментов» 2014/65 и Регламента ЕС «О злоупотреблениях на рынке» (MAR) 2014/596, и был подготовлен в соответствии с указанными документами, а также с политиками, процедурами и внутренними правилами Газпромбанка в части регулирования конфликтов интересов.
Настоящий документ не является индивидуальной инвестиционной рекомендацией в соответствии с Федеральным законом от 22.04.1996 № 39-ФЗ «О рынке ценных бумаг».
Настоящий документ содержит независимую оценку вопросов, содержащихся в нем, и не должен рассматриваться в качестве инвестиционного совета / индивидуальной инвестиционной рекомендации. В настоящем документе не учитывается целесообразность инвестиций, порядка действий или сопутствующих рисков для адресата. Настоящий документ не предназначен для предоставления индивидуальных инвестиционных советов и не учитывает конкретные инвестиционные цели, финансовое положение и индивидуальные потребности любого конкретного лица, которое может получить настоящий документ. Адресатам следует получать независимые профессиональные финансовые советы относительно юридических, финансовых, налоговых и регуляторных последствий любой транзакции, а также целесообразности и/или уместности инвестирования или осуществления любых инвестиционных стратегий, рассматриваемых в настоящем документе, а также принимать во внимание, что представленные в настоящем документе прогнозы могут не осуществиться. Любая информация и мнения, содержащиеся в настоящем документе, публикуются в качестве помощи адресатам, но не должны считаться неоспоримыми или заменять самостоятельное суждение адресата, могут быть изменены без предварительного уведомления и не могут служить единственным основанием для осуществления любой оценки рассматриваемых в настоящем документе инструментов. Инвесторам следует учитывать, что финансовые инструменты и иные инвестиционные инструменты, номинированные в иностранной валюте, подвержены колебаниям обменного курса, что может отрицательно повлиять на их стоимость.
Настоящий документ основан на информации, полученной из публичных источников, которые, по мнению Газпромбанка, являются надежными, однако мы не осуществляем проверку их точности и полноты, и они не должны восприниматься таковыми. За исключением информации, непосредственно связанной с Газпромбанком, Газпромбанк не несет ответственность за точность или полноту любой информации, представленной в настоящем документе.
В настоящем документе мы подтверждаем, что (i) мнения, изложенные в настоящем документе, отражают только наши взгляды в отношении конкретных компании или компаний и ее или их ценных бумаг, и (ii) никакая часть вознаграждения аналитика не связана в настоящее время, не была или не будет связана прямо или косвенно с конкретными рекомендациями или мнениями, изложенными в настоящем документе. Мнение Газпромбанка может отличаться от мнения аналитиков. Все мнения и оценки приведены по состоянию на дату публикации настоящего документа и могут быть изменены без предварительного уведомления. Все представленные в настоящем документе мнения являются личным мнением аналитиков в отношении событий и ситуаций, описанных и проанализированных в настоящем документе, и могут отличаться от или противоречить мнениям, выраженным инвестиционными и бизнес-подразделениями Газпромбанка вследствие использования ими иных подходов или предположений.
Настоящий документ может содержать прогнозы, предположения и/или целевые цены, которые представляют собой текущую оценку автора по состоянию на дату публикации настоящего документа.
Газпромбанк не обязан обновлять или изменять настоящий документ или в иных случаях уведомлять кого-либо о таких изменениях. Указанные в настоящем документе финансовые инструменты могут быть неподходящими инструментами инвестирования для инвесторов определенных категорий. Настоящий документ предназначен для Профессиональных клиентов.
Газпромбанк и связанные с ним физические лица (исключая любых финансовых аналитиков или иных сотрудников, участвующих в составлении настоящего документа) могут (в различном качестве) иметь позиции или заключать сделки, в том числе с ценными бумагами (или соответствующими деривативами), идентичными или подобными описанным в настоящем документе. Газпромбанк и/или его аффилированные лица могут также владеть ценными бумагами эмитентов, находящихся под его аналитическим покрытием.
Газпромбанк и/или его аффилированное (-ые) лицо (-а) могут влиять на рынок (выступать маркетмейкером) и/или предоставлять ликвидность по инструментам, указанным в настоящем документе.
Газпромбанк уважает конфиденциальность информации, которую он получает о своих клиентах, и соблюдает все применимые законы в отношении обработки такой информации. Газпромбанк ввел эффективные внутренние процедуры в отношении информационных барьеров (включая создание «китайских стен»), которые направлены на ограничение потоков информации между различными подразделениями Газпромбанка.
Для получения дополнительной информации, пожалуйста, используйте ссылку: https://www.gazprombank.ru.
Оплата труда сотрудников частично зависит от доходности Газпромбанка и его аффилированных лиц, которая включает в себя доходы от инвестиционно-банковских услуг.
В максимально возможной степени, разрешенной законом, Газпромбанк не принимает на себя какую-либо ответственность за какие-либо убытки, ущерб или расходы, возникшие прямо или косвенно (включая, но не ограничиваясь, специальные, случайные, сопутствующие, штрафные убытки или любые убытки, ущерб или расходы возникшие в результате в числе прочего любых искажений, ошибок, неполноты, упущений, заблуждений или неточностей, содержащихся в настоящем документе или любых сопутствующих услугах, или возникших в результате недоступности настоящего документа или любой его части или связанных с ним услуг) вследствие использования любой информации, содержащейся в настоящем документе или на веб-сайте Газпромбанка, включая любую информацию, которая может представлять собой инвестиционную рекомендацию/инвестиционное исследование.
Любая информация, содержащаяся в настоящем документе или в приложениях к настоящему документу, не может толковаться как предложение или склонение к покупке или продаже или подписке на какие-либо ценные бумаги или финансовые инструменты, как оферта или реклама, если иное прямо не указано в настоящем документе или приложениях к нему. Предыдущие результаты не являются гарантией будущих результатов. Оценки будущих результатов основаны на предположениях, которые могут не осуществиться.
Раскрытие конфликта интересов, если таковое имеется, может быть найдено в разделе раскрытия информации касательно настоящего документа.
Настоящий документ не был раскрыт эмитенту и не был впоследствии изменен.
Более подробную информацию о ценных бумагах, указанных в настоящем документе, можно получить по запросу в Газпромбанк.
Повторное распространение или воспроизведение полностью или частично настоящего документа запрещено без предварительного письменного разрешения Газпромбанка.
Адресатам следует самостоятельно определять, нет ли у них запрета на получение конкретной Инвестиционной рекомендации/конкретного Инвестиционного исследования в рамках MiFID II. Если MiFID II вам предписано получать настоящий документ на платной основе, или вы в иных случаях желаете заплатить за него, мы заключим отдельное письменное соглашение, в котором будут указаны условия, на которых вам будет предоставляться материал, включая оплату за его получение.
Для резидентов Гонконга: Исследования, содержащиеся в настоящем документе и имеющие отношение к «ценным бумагам» (согласно Положению о Ценных бумагах и Фьючерсах (Глава 571 Свода законов Гонконга)), публикуются в Гонконге самим GPB Financial Services Hong Kong Limited (GPBFSHK) или от его имени и по его поручению, и он берет на себя ответственность за их содержание. Информация, содержащаяся в настоящем документе, не должна толковаться как подразумевающая какие-либо отношения, консультативные или иные, между GPBFSHK и адресатом или пользователем настоящего документа, если это напрямую не согласовано с GPBFSHK. GPBFSHK не действует и не считается действующим как «фидуциар» или «инвестиционный менеджер» или «инвестиционный консультант» по отношению к любому адресату или пользователю этой информации, если это напрямую не согласовано с GPBFSHK. GPBFSHK регулируется Гонконгской Комиссией по Ценным бумагам и Фьючерсам. Пожалуйста, свяжитесь с [г-н Шон Ансел (+852 2867 1883) или г-н Джозеф Чу (+852 2867 1812)] в GPBFSHK, если у вас возникли какие-либо вопросы, связанные с настоящим документом.
Для GPB - Financial Services Ltd: Настоящий документ был подготовлен в соответствии с Директивой 2014/65/TU (MiFID II). Информация, содержащаяся в настоящем документе, предоставляется исключительно в информационных целях и не является маркетинговым сообщением, инвестиционным советом или личной рекомендацией, как это определено MiFID II. Данная информация не должна использоваться или рассматриваться как предложение или склонение к покупке или продаже или подписке на ценные бумаги или иные финансовые инструменты. Компания GPB-Financial Services Ltd регулируется Комиссией по Ценным бумагам и Биржам Кипра, номер лицензии 113/10.
http://new.guap.ru/i04/contacts
vk.com/id446425943
4 ФЕВРАЛЯ 2019 Г. |
РОССИЯ > РЫНОК АКЦИЙ > НЕФТЕГАЗОВЫЙ СЕКТОР |
|
|
ИЗМЕНЕНИЯ В НАЛОГООБЛОЖЕНИИ НЕФТЯНОГО СЕКТОРА ПРЕДПОЛАГАЮТ НОВЫЙ СЛОЖНЫЙ МЕХАНИЗМ СУБСИДИРОВАНИЯ СЕГМЕНТА DOWNSTREAM
С 2019 г. вступили в силу ключевые изменения в налогообложении нефтяного сектора РФ: система экспортных пошлин будет постепенно ликвидирована, введен новый механизм субсидирования сегмента downstream
В прошлом году правительство РФ одобрило ключевые изменения в налогообложении нефтяного сектора, которые вступили в силу с 2019 г. и предполагают поэтапную ликвидацию системы экспортных пошлин.
«Налоговый маневр», начавшийся в 2015 г. и подразумевающий постепенное сокращение до нуля экспортной пошлины на нефть/нефтепродукты и одновременное повышение НДПИ на нефть, завершится к 2024 г. Единой базой налогообложения для федерального бюджета РФ станет добыча нефти.
Поскольку в удельном выражении отмена экспортной пошлины на нефть компенсируется соответствующим повышением НДПИ, чистый эффект на баррель от завершения «налогового маневра» на сегмент upstream будет нейтральным. Однако из-за расширения налогооблагаемой базы (объем добычи нефти вместо экспорта) общая налоговая нагрузка на нефтяные компании увеличится.
Российская нефтепереработка, для которой значительно вырастет стоимость сырья (нефти) в результате отмены экспортной пошлины, будет субсидироваться за счет введения новой налоговой составляющей – отрицательного (обратного) акциза на нефтяное сырье. По сути, он покрывает существующую дельту между размером экспортных пошлин на нефть и на нефтепродукты.
Субсидия также включает определенную компенсацию (коэффициент KДЕМП или демпфер) за отклонение от экспортного паритета внутренних цен на бензин/ дизтопливо, рост которых, как ожидается, будет сдерживаться регуляторами. Формула демпфера наиболее активно обсуждалась с российскими нефтяными компаниями в 2П18 и в итоге претерпела изменения.
В итоге, по нашим оценкам на примере Газпром нефти, чистый эффект от завершения «налогового маневра» и ввода отрицательного акциза на нефтяное сырье без учета демпфера будет отрицательным для российских нефтяных компаний из-за расширения налогооблагаемой базы в сегменте upstream.
Однако при высоких ценах на нефть (70 долл./барр. в 2019 г. в нашем сценарии) демпфер позволит компенсировать компаниям и общее увеличение налоговой нагрузки в результате завершения «налогового маневра», и негативный эффект от сдерживания регуляторами роста цен на нефтепродукты на внутреннем рынке.
При более слабых ценах на нефть демпфер вместо компенсации (субсидии) становится дополнительной выплатой для компаний, однако в этом случае компании будут выигрывать от более высоких установленных внутренних цен на нефтепродукты (по сравнению с экспортными нетбэками).
Учитывая высокую сложность нового механизма субсидирования, мы полагаем, что первое время регуляторы будут мониторить налоговую нагрузку на нефтяные компании и поступления в бюджет и отслеживать искажения в ту или иную сторону, и ожидаем в будущем новых изменений в системе и формулах налогов.
Евгения Дышлюк
Evgenia.Dyshlyuk@gazprombank.ru
Михаил Калимулин
Mikhail.Kalimulin@gazprombank.ru
http://newрыночной конъюнктуры.guap.ru/i04/contacts |
Газпромбанк (Акционерное общество) |
Департамент анализа |
Copyright © 2003-2018 |
|
Все права защищены |

vk.com/id446425943
4 ФЕВРАЛЯ 2019 Г. |
РОССИЯ > РЫНОК АКЦИЙ > НЕФТЕГАЗОВЫЙ СЕКТОР |
|
|
Экспортная пошлина на нефть будет постепенно отменена к 2024 г., что приведет к росту экспортного нетбэка (внутренней цены) на нефть
В рамках завершения «налогового маневра» экспортная пошлина на нефть в РФ к 2024 г. будет ликвидирована, и единственным налогом в сегменте upstream («разведка и добыча») российского нефтяного сектора останется налог на добычу полезных ископаемых (НДПИ) на нефть.
Так, экспортная пошлина на нефть будет постепенно сокращаться до нуля к 2024 г., а НДПИ на нефть будет повышаться на соответствующую величину. Формулы данных налогов были изменены следующим образом:
Таблица 1. Изменения в формулах экспортной пошлины и НДПИ на нефть
ИЗМЕНЕНИЕ
Снижение экспортной пошлины на нефть путем применения в формуле понижающего коэффициента
Соответствующее повышение
НДПИ на нефть путем добавления в формулу НДПИ формулы экспортной пошлины с повышающим коэффициентом
СТАРАЯ ФОРМУЛА
Экспортная пошлина на нефть ($/т) (ЭПНЕФТЬ) =
[Цена нефти Urals ($/барр.) x 7,3 – 182,5] x 0,3 + 29,2
НДПИ на нефть (руб./т) = 919 х КЦ – ДМ
КЦ = [Цена нефти Urals ($/барр.) – 15] x сред. курс RUB/USD / 261
ДМ = 559 х KЦ х (1 – KВ х KЗ х KД х KДВ х KКАН) – KК
где:
KВ – коэффициент, характеризующий степень выработанности
запасов участка;
KЗ – коэффициент, характеризующий величину запасов участка;
KД – коэффициент, характеризующий степень сложности добычи
нефти;
KДВ – коэффициент, характеризующий степень выработанности
залежи (применяется для участков, на которых имеются залежи с коэффициентом KД <0);
KКАН – коэффициент, характеризующий регион добычи и свойства
нефти;
KК = 428 на 2019-2021 гг.
НОВАЯ ФОРМУЛА
Экспортная пошлина на нефть ($/т) = ЭПНЕФТЬ х (1 – ККОРР)
где:
Понижающий коэффициент (1 – ККОРР) =
0,833 в 2019 г.,
0,667 в 2020 г.,
0,500 в 2021 г.,
0,333 в 2022 г.,
0,167 в 2023 г.,
0 в 2024 г.
НДПИ на нефть (руб./т) = 919 х КЦ – ДМ
ДМ = 559 х KЦ х (1 – KВ х KЗ х KД х KДВ х KКАН) – KК – KАБДТ – KМАН х СВН
KАБДТ = НАБ х ИАБ + НДТ х ИДТ
НАБ/ДТ – коэффициент, характеризующий надбавку за автомобильный
бензин (125 в 2019 г., 105 в 2020 г. и далее) и дизтопливо (110 в 2019 г., 92 в 2020 г. и далее)
ИАБ/ДТ = 1, если премия экспортного бенчмарка ≥ 0
KМАН = ЭПНЕФТЬ x сред. курс RUB/USD x ККОРР
где:
Повышающий коэффициент (ККОРР) =
0,167 в 2019 г.,
0,333 в 2020 г.,
0,500 в 2021 г.,
0,667 в 2022 г.,
0,833 в 2023 г.,
1,000 в 2024 г.
СВН = коэффициент, характеризующий добычу сверхвязкой нефти.
Источник: Консультант Плюс
Поскольку в удельном выражении отмена экспортной пошлины на нефть полностью компенсируется соответствующим повышением НДПИ, чистый эффект на баррель от завершения «налогового маневра» на сегмент upstream российского нефтяного сектора будет нейтральным (Таблица 2).
Однако из-за расширения налогооблагаемой базы (объем добычи нефти вместо экспорта) общая налоговая нагрузка на российские нефтяные компании увеличится.
Отметим также, что в новую формулу НДПИ на нефть был добавлен коэффициент КАБДТ, увеличивающий ставку НДПИ, если экспортные бенчмарки на бензин/ дизтопливо превышают внутренние цены (см. ниже раздел «Российские нефтяные компании также могут получить компенсацию за отклонение внутренних цен на топливо от экспортного бенчмарка»). В этом случае ставка НДПИ на нефть может вырасти максимум на 225 (110+125) руб./т или ~3,5 долл./т.
http://new.guap.ru/i04/contacts 2

vk.com/id446425943
4 ФЕВРАЛЯ 2019 Г. |
РОССИЯ > РЫНОК АКЦИЙ > НЕФТЕГАЗОВЫЙ СЕКТОР |
|
|
Таблица 2. Эффект завершения «налогового маневра» на сегмент upstream российского нефтяного сектора (в удельном выражении)
|
|
|
|
|
|
|
СТАРОЕ НАЛОГООБЛОЖЕНИЕ |
|
|
|
|
|
|
|
|
НОВОЕ НАЛОГООБЛОЖЕНИЕ |
|
|
|
|
|
|
|
|
|
ИЗМЕНЕНИЕ |
|
|
|
|
|
|
|||||||||||||||||||||||
|
|
|
|
|
|
|
|
|
|
|
|
|
|
|
|
|
|
|
|
|
|
|
|
|
|
|
|
|
|
||||||||||||||||||||||||||
|
|
|
|
|
|
|
|
|
|
|
|
|
|
|
|
|
|
|
|
|
|
|
|
|
|
|
|
|
|
|
|
|
|
|
|
|
|
|
|
|
|
|
|
|
|
|
|
|
|
|
|
|
|
|
|
|
|
|
|
2019 |
|
|
2020 |
|
2021 |
|
|
2022 |
|
|
2023 |
|
|
2024 |
|
|
|
2019 |
|
|
2020 |
|
|
2021 |
|
|
2022 |
|
|
2023 |
|
|
2024 |
|
2019 |
|
|
2020 |
|
|
2021 |
|
|
2022 |
|
|
2023 |
|
|
2024 |
|
|
|
|
|
|
|
|
|
|
|
|
|
|
|
|
|
|
|
|
|
|
|
|
|
|
|
|
|
|
|
|
|
|
|
|
|
|
|
|
|
|
|
|
|
|
|
|
|
|
|
|
|
|
|
|
|
|
Цена нефти Brent, $/барр. |
70,0 |
|
70,0 |
|
70,0 |
|
70,0 |
|
70,0 |
|
70,0 |
|
|
70,0 |
|
70,0 |
|
70,0 |
70,0 |
|
70,0 |
|
70,0 |
|
|
|
|
|
|
|
|
|
|
|
|
|
|
|
|
|
|
|||||||||||||
|
|
|
|
|
|
|
|
|
|
|
|
|
|
|
|
|
|
|
|
|
|
|
|
|
|
|
|
|
|
|
|
|
|
|
|
|
|
|
|
|
|
|
|||||||||||||
|
Средний курс RUB/USD |
|
|
65,0 |
|
|
65,0 |
|
65,0 |
|
|
65,0 |
|
|
65,0 |
|
|
65,0 |
|
|
|
65,0 |
|
|
65,0 |
|
|
65,0 |
|
|
65,0 |
|
|
65,0 |
|
|
65,0 |
|
|
|
|
|
|
|
|
|
|
|
|
|
|
|
|
|
|
|
|
|
|
|
|
|
|
|
|
|
|
|
|
|
|
|
|
|
|
|
|
|
|
|
|
|
|
|
|
|
|
|
|
|
|
|
|
|
|
|
|
|
|
|
|
|
|
|
|
|
|
|
|
|
|
|
ПОСТЕПЕННАЯ ОТМЕНА ЭКСПОРТНОЙ ПОШЛИНЫ НА НЕФТЬ: |
|
|
|
|
|
|
|
|
|
|
|
|
|
|
|
|
|
|
|
|
|
|
|
|
|
|
|
|
|
|
|
|
|
|
|
|
|
|
|
|
|
|
|
|
|
|
|
|||||||
|
|
|
|
|
|
|
|
|
|
|
|
|
|
|
|
|
|
|
|
|
|
|
|
|
|
|
|
|
|
|
|
|
|
|
|
|
|
|
|
|
|
|
|
|
|
|
|
|
|
|
|
|
|
|
|
|
Экспортная пошлина на нефть, $/барр. |
17,1 |
|
17,1 |
|
17,1 |
|
17,1 |
|
17,1 |
|
17,1 |
|
14,2 |
|
11,4 |
|
8,5 |
5,7 |
|
2,8 |
|
0,0 |
|
-2,8 |
|
-5,7 |
-8,5 |
|
-11,4 |
|
-14,2 |
-17,1 |
|
|||||||||||||||||||||
|
|
|
|
|
|
|
|
|
|
|
|
|
|
|
|
|
|
|
|
|
|
|
|
|
|
|
|
|
|
|
|
|
|||||||||||||||||||||||
|
% от цены нефти Urals |
|
|
25% |
|
|
25% |
|
25% |
|
|
25% |
|
|
25% |
|
|
25% |
|
|
|
21% |
|
|
17% |
|
|
12% |
|
|
8% |
|
|
4% |
|
|
0% |
|
|
|
|
|
|
|
|
|
|
|
|
|
|
|
|
|
|
|
|
|
|
|
|
|
|
|
|
|
|
|
|
|
|
|
|
|
|
|
|
|
|
|
|
|
|
|
|
|
|
|
|
|
|
|
|
|
|
|
|
|
|
|
|
|
|
|
|
|
|
|
|
|
|
|
стандартная экспортная пошлина |
|
|
17,1 |
|
|
17,1 |
|
17,1 |
|
|
17,1 |
|
|
17,1 |
|
|
17,1 |
|
|
|
17,1 |
|
|
17,1 |
|
|
17,1 |
|
|
17,1 |
|
|
17,1 |
|
|
17,1 |
|
|
|
|
|
|
|
|
|
|
|
|
|
|
|
|
|
|
|
на нефть, $/барр. |
|
|
|
|
|
|
|
|
|
|
|
|
|
|
|
|
|
|
|
|
|
|
|
|
|
|
|
|
|
|
|
|
|
|
|
|
|
|
|
|
|
|
||||||||||||
|
|
|
|
|
|
|
|
|
|
|
|
|
|
|
|
|
|
|
|
|
|
|
|
|
|
|
|
|
|
|
|
|
|
|
|
|
|
|
|
|
|
|
|
|
|
|
|
|
|
|
|
|
|
|
|
|
|
|
|
|
|
|
|
|
|
|
|
|
|
|
|
|
|
|
|
|
|
|
|
|
|
|
|
|
|
|
|
|
|
|
|
|
|
|
|
|
|
|
|
|
|
|
|
|
|
|
|
|
|
|
|
|
(х) понижающий коэф-т (1 – КОРР) |
|
|
- |
|
|
- |
|
- |
|
|
- |
|
|
- |
|
|
- |
|
|
|
0,833 |
|
|
0,667 |
|
|
0,500 |
|
|
0,333 |
|
|
0,167 |
|
|
0,000 |
|
|
|
|
|
|
|
|
|
|
|
|
|
|
|
|
|
|
|
|
|
|
|
|
|
|
|
|
|
|
|
|
|
|
|
|
|
|
|
|
|
|
|
|
|
|
|
|
|
|
|
|
|
|
|
|
|
|
|
|
|
|
|
|
|
|
|
|
|
|
|
|
|
|
Цена нефти Urals, $/барр. |
68,5 |
68,5 |
68,5 |
68,5 |
68,5 |
68,5 |
68,5 |
68,5 |
68,5 |
68,5 |
68,5 |
68,5 |
|
|
|
|
|
|
(-) экспортная пошлина, $/барр |
-17,1 |
-17,1 |
-17,1 |
-17,1 |
-17,1 |
-17,1 |
-14,2 |
-11,4 |
-8,5 |
-5,7 |
-2,8 |
0,0 |
-2,8 |
-5,7 |
-8,5 |
-11,4 |
-14,2 |
-17,1 |
(-) транспортные затраты, $/барр |
-1,7 |
-1,7 |
-1,7 |
-1,7 |
-1,7 |
-1,7 |
-1,7 |
-1,7 |
-1,7 |
-1,7 |
-1,7 |
-1,7 |
|
|
|
|
|
|
|
|
|
|
|
|
|
|
|
|
|
|
|
|
|
|
|
|
|
|
|
|
|
|
|
|
|
|
|
|
|
|
|
|
|
|
|
|
|
|
|
|
|
|
|
|
|
|
|
|
|
Экспортный нетбэк на нефть, $/барр. |
|
|
49,8 |
|
|
49,8 |
|
|
49,8 |
|
|
49,8 |
|
|
49,8 |
|
|
49,8 |
|
|
|
52,6 |
|
|
55,4 |
|
|
58,3 |
|
|
61,1 |
|
|
64,0 |
|
|
66,8 |
|
+2,8 |
|
+5,7 |
+8,5 |
|
+11,4 |
|
+14,2 |
+17,1 |
|
|
|
|
|
|
|
|
|
|
|
|
|
|
|
|
|
|
|
|
|
|
|
|
|
|
|
|
|
|
|
|
|
|
|
|
|
|
|
|
|
|
|
|
|
|
|
|
|
|
|
|
ОДНОВРЕМЕННОЕ ПОВЫШЕНИЕ НАЛОГА НА ДОБЫЧУ ПОЛЕЗНЫХ ИCКОПАЕМЫХ (НДПИ) НА НЕФТЬ: |
|
|
|
|
|
|
|
|
|
|
|
|
|
|
|
|
|
|
|
|
|
|
|
|
|
|
|
|||||||||||||||||||||
|
|
|
|
|
|
|
|
|
|
|
|
|
|
|
|
|
|
|
|
|
|
|
|
|
|
|
|
|
|
|
|
|
|
|
|
|
|
|
|
|
|
|
|
|
|
|
|
|
|
|
|
|
|
|
|
|
|
|
|
|
|
|
|
|
|
|
|
|
|
|
|
|
|
|
|
|
|
|
|
|
|
|
|
|
|
|
|
||||||||||||
|
Стандартный НДПИ на нефть, руб./т |
|
|
12 673 |
|
|
12 673 |
|
|
12 245 |
|
|
12 245 |
|
|
12 245 |
|
|
12 245 |
|
|
|
12 673 |
|
|
12 673 |
|
|
12 673 |
|
|
12 245 |
|
|
12 245 |
|
|
12 245 |
|
|
|
|
|
|
|
|
|
|
|
|
|
|
|
|
|
|
|
|
|
|
|
|
|
|
|
|
|
|
|
|
|
|
|
|
|
|
|
|
|
|
|
|
|
|
|
|
|
|
|
|
|
|
|
|
|
|
|
|
|
|
поправочный коэффициент (KК) |
|
|
428 |
|
|
428 |
|
|
0 |
|
|
0 |
|
|
0 |
|
|
0 |
|
|
|
428 |
|
|
428 |
|
|
428 |
|
|
0 |
|
|
0 |
|
|
0 |
|
|
|
|
|
|
|
|
|
|
|
|
|
|
|
|
|
|
|
|
|
|
|
|
|
|
|
|
|
|
|
|
|
|
|
|
|
|
|
|
|
|
|
|
|
|
|
|
|
|
|
|
|
|
|
|
|
|
|
|
|
|
(+) Новый компонент, руб./т*: |
- |
|
- |
|
- |
|
- |
|
- |
|
- |
|
|
|
1 351 |
|
2 694 |
|
4 045 |
5 396 |
|
6 739 |
|
8 090 |
|
|
|
|
|
|
|
|
|
|
|
|||||||||||||
|
|
|
|
|
|
|
|
|
|
|
|
|
|
|
|
|
|
|
|
|
|
|
|
|
|
|
|
|
|
|
|
|
|
|
|
|
|
|
|
|
|
|
|
|
|
|
|
|
|
|
стандартная экспортная пошлина |
|
|
- |
|
|
- |
|
|
- |
|
|
- |
|
|
- |
|
|
- |
|
|
|
17,1 |
|
|
17,1 |
|
|
17,1 |
|
|
17,1 |
|
|
17,1 |
|
|
17,1 |
|
|
|
|
|
|
|
|
|
|
|
|
на нефть, $/барр. |
|
|
|
|
|
|
|
|
|
|
|
|
|
|
|
|
|
|
|
|
|
|
|
|
|
|
|
|
|
|
|
|
|
|
|
|
||||||||||||
|
|
|
|
|
|
|
|
|
|
|
|
|
|
|
|
|
|
|
|
|
|
|
|
|
|
|
|
|
|
|
|
|
|
|
|
|
|
|
|
|
|
|
|
|
|
|
|
|
|
|
(х) повышающий коэф-т (КОРР) |
|
|
- |
|
|
- |
|
|
- |
|
|
- |
|
|
- |
|
|
- |
|
|
|
0,167 |
|
|
0,333 |
|
|
0,500 |
|
|
0,667 |
|
|
0,833 |
|
|
1,000 |
|
|
|
|
|
|
|
|
|
|
|
|
|
|
|
|
|
|
|
|
|
|
|
|
|
|
|
|
|
|
|
|
|
|
|
|
|
|
|
|
|
|
|
|
|
|
|
|
|
|
|
|
|
|
|
|
|
|
|
|
|
|
НДПИ на нефть, руб./т |
|
|
12 673 |
|
|
12 673 |
|
|
12 245 |
|
|
12 245 |
|
|
12 245 |
|
|
12 245 |
|
|
|
14 024 |
|
|
15 367 |
|
|
16 718 |
|
|
17 641 |
|
|
18 984 |
|
|
20 335 |
|
1 351 |
|
2 694 |
4 473 |
|
5 396 |
|
6 739 |
8 090 |
|
|
|
|
|
|
|
|
|
|
|
|
|
|
|
|
|
|
|
|
|
|
|
|
|
|
|
|
|
|
|
|
|
|
|
|
|
|
|
|
|
|
|
|
|
|
|
|
|
|
|
|
НДПИ на нефть, $/барр. |
26,7 |
|
26,7 |
|
25,8 |
|
25,8 |
|
25,8 |
|
25,8 |
|
|
|
29,6 |
|
32,4 |
|
35,2 |
37,2 |
|
40,0 |
|
42,9 |
|
+2,8 |
|
+5,7 |
+9,4 |
|
+11,4 |
|
+14,2 |
+17,1 |
|
|||||||||||||
|
|
|
|
|
|
|
|
|
|
|
|
|
|
|
|
|
|
|
|
|
|
|
|
|
|
|
|
||||||||||||||||||||||
|
% от цены нефти Urals |
|
|
39% |
|
|
39% |
|
|
38% |
|
|
38% |
|
|
38% |
|
|
38% |
|
|
|
43% |
|
|
47% |
|
|
51% |
|
|
54% |
|
|
58% |
|
|
63% |
|
|
|
|
|
|
|
|
|
|
|
|
|
|
|
|
|
|
|
|
|
|
|
|
|
|
|
|
|
|
|
|
|
|
|
|
|
|
|
|
|
|
|
|
|
|
|
|
|
|
|
|
|
|
|
|
|
|
|
|
|
|
ЧИСТОЕ ИЗМЕНЕНИЕ НАЛОГОВОЙ НАГРУЗКИ: |
|
|
|
|
|
|
|
|
|
|
|
|
|
|
|
|
|
|
|
|
|
|
|
|
|
|
|
|
|
|
|
|
|
|
|
|
|
|
|
|
|
|
|
|
||||
|
|
|
|
|
|
|
|
|
|
|
|
|
|
|
|
|
|
|
|
|
|
|
|
|
|
|
|
|
|
|
|
|
|
|
|
|
|
|
|
|
|
|
|
|
|
|
|
|
|
|
Экспортная пошлина + |
43,8 |
|
43,8 |
|
42,9 |
|
42,9 |
|
42,9 |
|
42,9 |
|
|
|
43,8 |
|
43,8 |
|
43,8 |
42,9 |
|
42,9 |
|
42,9 |
|
0,0 |
|
0,0 |
0,9 |
|
0,0 |
|
0,0 |
0,0 |
|
|||||||||||||
|
НДПИ на нефть, $/барр. |
|
|
|
|
|
|
|
|
|
|
|
|
|
|
|
|
|
|||||||||||||||||||||||||||||||
|
|
|
|
|
|
|
|
|
|
|
|
|
|
|
|
|
|
|
|
|
|
|
|
|
|
|
|
|
|
|
|
|
|
|
|
|
|
|
|
|
|
|
|
|
|
|
|
||
% от цены нефти Urals |
64% |
64% |
63% |
63% |
63% |
63% |
64% |
64% |
64% |
63% |
63% |
63% |
* Не включая коэффициент КАБДТ |
Источник: Консультант Плюс, расчеты Газпромбанка |
Рост нетбэков на нефтепродукты в результате отмены экспортных пошлин не сможет полностью компенсировать удорожание сырья для российских НПЗ
В результате отмены экспортной пошлины повысится экспортный нетбэк (внутренняя цена) на нефть, т.е. стоимость сырья для российских нефтеперерабатывающих заводов (НПЗ) (сегмент «нефтепереработка и розница» или downstream).
Экспортные пошлины на нефтепродукты, устанавливаемые как процент от экспортной пошлины на нефть, также сократятся до нуля к 2024 г. (Диаграммы 1, 2), что также приведет к росту экспортных нетбэков (внутренних цен) на них.
Однако, поскольку экспортные пошлины на нефтепродукты в целом ниже экспортной пошлины на нефть (за исключением темных нефтепродуктов (мазута), для которых экспортная пошлина равна 100% экспортной пошлины на нефть), рост цен на них в результате отмены экспортных пошлин не сможет полностью компенсировать удорожание сырья для российских НПЗ.
Рассмотрев в качестве примера наиболее передовой НПЗ Газпром нефти – Омский – с глубиной переработки ~92% и выходом светлых нефтепродуктов ~72%, мы рассчитали, что увеличение стоимости сырья (нефти) будет примерно вдвое выше роста цены корзины нефтепродуктов НПЗ (Таблица 3). В результате рентабельность российских НПЗ существенно ухудшится (Диаграмма 3).
http://new.guap.ru/i04/contacts 3
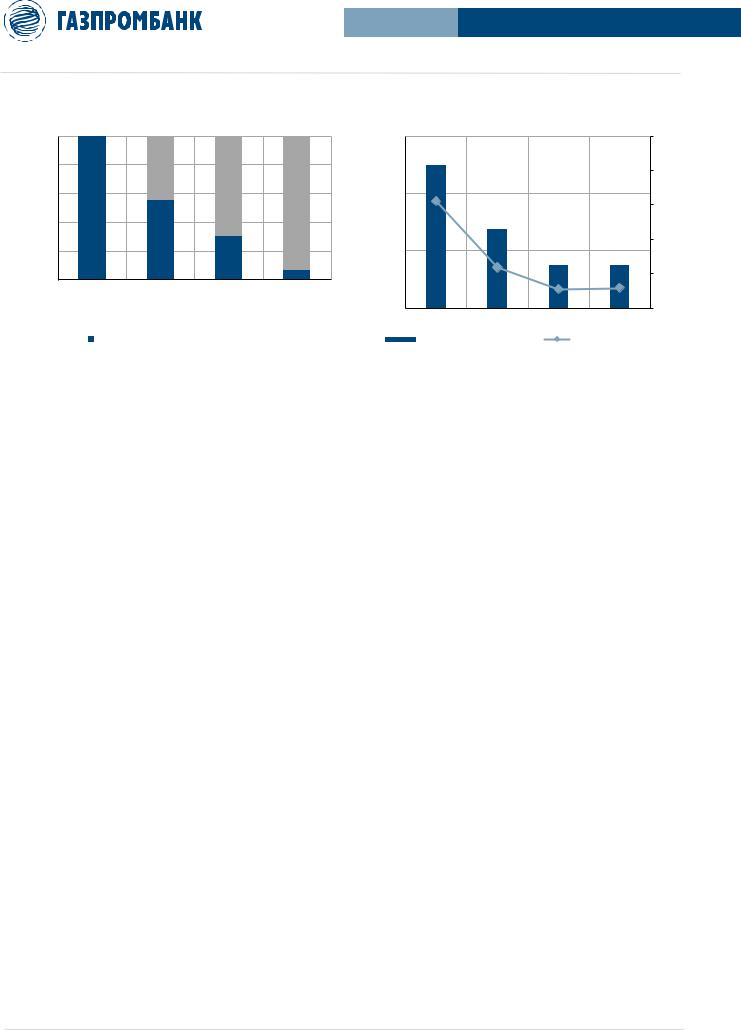
vk.com/id446425943 |
|
|
|
|
|
|
|
|
|
|
4 ФЕВРАЛЯ 2019 Г. |
РОССИЯ > РЫНОК АКЦИЙ > НЕФТЕГАЗОВЫЙ СЕКТОР |
|||
Диаграмма 1. Действующие экспортные пошлины на |
Диаграмма 2. Экспортные пошлины на нефтепродукты |
||||||
нефтепродукты, % от экспортной пошлины на нефть |
при старом налогообложении |
|
|
||||
100,0% |
|
|
|
150,0 |
|
|
50,0% |
|
|
|
|
124 |
|
|
|
80,0% |
|
|
|
|
|
|
40,0% |
|
|
|
|
|
|
|
|
60,0% |
|
|
|
100,0 |
|
|
|
100,0% |
|
|
|
|
|
|
30,0% |
|
|
|
|
68 |
|
|
|
40,0% |
|
|
|
|
|
|
|
|
|
|
|
|
|
|
|
|
55,0% |
|
|
|
|
|
20,0% |
20,0% |
|
30,0% |
|
50,0 |
|
37 |
37 |
|
|
|
|
|
|||
|
|
|
|
|
|
|
|
0,0% |
|
|
6,5% |
|
|
|
10,0% |
|
|
|
|
|
|
|
|
Темные |
Нафта |
Светлые и |
Кокс |
|
|
|
|
нефтепродукты |
|
средние |
|
0,0 |
|
|
0,0% |
|
|
нефтепродукты |
|
|
|
||
|
|
|
Мазут |
Нафта |
Бензин |
Дизтопливо |
|
|
|
|
|
||||
% ОТ ЭКСПОРТНОЙ ПОШЛИНЫ НА НЕФТЬ |
|
ЭКСПОРТНАЯ ПОШЛИНА, $/Т |
% ОТ ЦЕНЫ НА ПРОДУКТ |
||||
Примечание: оценка при цене на нефть Brent 70,0 долл./барр. и среднем курсе RUB/USD 65,0. |
|
Источник: Консультант Плюс, расчеты Газпромбанка |
|||||
Таблица 3. Эффект завершения «налогового маневра» на сегмент downstream российского нефтяного сектора
без учета субсидии и акцизов в удельном выражении (иллюстративный пример – Омский НПЗ Газпром нефти), долл./т
|
|
|
|
|
|
|
СТАРОЕ НАЛОГООБЛОЖЕНИЕ |
|
|
|
|
|
|
|
НОВОЕ НАЛОГООБЛОЖЕНИЕ |
|
|
|
|
|
|
|
|
|
|
ИЗМЕНЕНИЕ |
|
|
|
|
|
|
||||||||||||||||||||||
|
|
|
|
|
|
|
|
|
|
|
|
|
|
|
|
|
|
|
|
|
|
|
|
|
|
|
|
|
|
|||||||||||||||||||||||||
|
|
|
|
|
|
|
|
|
|
|
|
|
|
|
|
|
|
|
|
|
|
|
|
|
|
|
|
|
|
|
|
|
|
|
|
|
|
|
|
|
|
|
|
|
|
|
|
|
|
|
|
|
|
|
|
|
|
|
2019 |
|
|
2020 |
|
|
2021 |
|
|
2022 |
|
|
2023 |
|
|
2024 |
|
|
2019 |
|
|
2020 |
|
2021 |
|
|
2022 |
|
2023 |
|
|
2024 |
|
|
2019 |
|
|
2020 |
|
|
2021 |
|
|
2022 |
|
|
2023 |
|
|
2024 |
|
|
|
|
|
|
|
|
|
|
|
|
|
|
|
|
|
|
|
|
|
|
|
|
|
|
|
|
|
|
|
|
|
|
|
|
|
|
|
|
|
|
|
|
|
|
|
|
|
|
|
|
|
|
|
|
|
ПОСТЕПЕННАЯ ОТМЕНА ЭКСПОРТНЫХ ПОШЛИН НА НЕФТЕПРОДУКТЫ: |
|
|
|
|
|
|
|
|
|
|
|
|
|
|
|
|
|
|
|
|
|
|
|
|
|
|
|
|
|
|
|
|
|
|
|
|
|
|
|
|
|
|
|
||||||||||
|
|
|
|
|
|
|
|
|
|
|
|
|
|
|
|
|
|
|
|
|
|
|
|
|
|
|
|
|
|
|
|
|
|
|
|
|
|
|
|
|
|
|
|
|
|
|
|
|
|
|
|
|
|
|
|
Цена на бензин 95 (MED, CIF) |
670 |
|
670 |
|
670 |
|
670 |
|
670 |
|
670 |
|
670 |
|
670 |
670 |
|
670 |
670 |
|
670 |
|
|
|
|
|
|
|
|
|
|
|
|
|
|
|
|
|
|
|
|||||||||||||
|
|
|
|
|
|
|
|
|
|
|
|
|
|
|
|
|
|
|
|
|
||||||||||||||||||||||||||||||||||
|
(-) экспортная пошлина |
|
|
-37 |
|
|
-37 |
|
|
-37 |
|
|
-37 |
|
|
-37 |
|
|
-37 |
|
|
-31 |
|
|
-25 |
|
-19 |
|
|
-12 |
|
-6 |
|
|
0 |
|
|
-6 |
|
|
-12 |
|
|
-19 |
|
|
-25 |
|
|
-31 |
|
|
-37 |
|
|
|
|
|
|
|
|
|
|
|
|
|
|
|
|
|
|
|
|
|
|
|
|
|
|
|
|
|
|
|
|
|
|
|
|
|
|
|
|
|
|
|
|
|
|
|
|
|
|
|
|
|
|
|
|
|
% от экспортной пошлины на нефть |
30% |
30% |
30% |
30% |
30% |
30% |
30% |
30% |
30% |
30% |
30% |
30% |
|
|
|
|
|
|
|
|
|
|
|
|
|
|
|
|
|
|
|||||||||||||||||||||||
|
|
|
|
|
|
|
|
|
|
|
|
|
|
|
|
|
|
|
|
|
|
|
|
|
|
|
|
|
|
|
|
|||||||||||||||||||||||
|
(-) транспортные затраты |
|
|
-60 |
|
|
-60 |
|
|
-60 |
|
|
-60 |
|
|
-60 |
|
|
-60 |
|
|
-60 |
|
|
-60 |
|
-60 |
|
|
-60 |
|
-60 |
|
|
-60 |
|
|
|
|
|
|
|
|
|
|
|
|
|
|
|
|
|
|
|
|
|
|
|
|
|
|
|
|
|
|
|
|
|
|
|
|
|
|
|
|
|
|
|
|
|
|
|
|
|
|
|
|
|
|
|
|
|
|
|
|
|
|
|
|
|
|
|
|
|
|
|
|
|
|
|
Экспортный нетбэк на бензин |
573 |
|
573 |
|
573 |
|
573 |
|
573 |
|
573 |
|
579 |
|
585 |
591 |
|
598 |
604 |
|
610 |
|
+6 |
|
+12 |
|
+19 |
|
+25 |
|
+31 |
|
+37 |
|
|||||||||||||||||||
|
|
|
|
|
|
|
|
|
|
|
|
|
|
|
|
|
|
|
|
|
|
|
|
|
|
|
|
|
|
|
|
|
|
|
|
|
|
|
|
|
|
|||||||||||||
|
Цена на нафту (ARA, CIF) |
|
|
580 |
|
|
580 |
|
|
580 |
|
|
580 |
|
|
580 |
|
|
580 |
|
|
580 |
|
|
580 |
|
580 |
|
|
580 |
|
580 |
|
|
580 |
|
|
|
|
|
|
|
|
|
|
|
|
|
|
|
|
|
|
|
|
|
|
|
|
|
|
|
|
|
|
|
|
|
|
|
|
|
|
|
|
|
|
|
|
|
|
|
|
|
|
|
|
|
|
|
|
|
|
|
|
|
|
|
|
|
|
|
|
|
|
|
|
|
|
|
(-) экспортная пошлина |
-68 |
-68 |
-68 |
-68 |
-68 |
-68 |
-57 |
-46 |
-34 |
-23 |
-11 |
0 |
|
-11 |
-23 |
-34 |
-46 |
-57 |
-68 |
||||||||||||||||||||||||||||||||||
|
|
|
|
|
|
|
|
|
|
|
|
|
|
|
|
|
|
|
|
|
|
|
|
|
|
|
|
|
|
|
|
|||||||||||||||||||||||
|
% от экспортной пошлины на нефть |
|
|
55% |
|
|
55% |
|
|
55% |
|
|
55% |
|
|
55% |
|
|
55% |
|
|
55% |
|
|
55% |
|
55% |
|
|
55% |
|
55% |
|
|
55% |
|
|
|
|
|
|
|
|
|
|
|
|
|
|
|
|
|
|
|
|
|
|
|
|
|
|
|
|
|
|
|
|
|
|
|
|
|
|
|
|
|
|
|
|
|
|
|
|
|
|
|
|
|
|
|
|
|
|
|
|
|
|
|
|
|
|
|
|
|
|
|
|
|
|
|
(-) транспортные затраты |
-60 |
-60 |
-60 |
-60 |
-60 |
-60 |
-60 |
-60 |
-60 |
-60 |
-60 |
-60 |
|
|
|
|
|
|
|
|
|
|
|
|
|
|
|
|
|
|
|||||||||||||||||||||||
|
|
|
|
|
|
|
|
|
|
|
|
|
|
|
|
|
|
|
|
|
|
|
|
|
|
|
|
|
|
|
|
|
|
|
|
|||||||||||||||||||
|
Экспортный нетбэк на нафту |
|
|
452 |
|
|
452 |
|
|
452 |
|
|
452 |
|
|
452 |
|
|
452 |
|
|
463 |
|
|
474 |
|
486 |
|
|
497 |
|
509 |
|
|
520 |
|
|
+11 |
|
|
+23 |
|
|
+34 |
|
|
+46 |
|
|
+57 |
|
|
+68 |
|
|
|
|
|
|
|
|
|
|
|
|
|
|
|
|
|
|
|
|
|
|
|
|
|
|
|
|
|
|
|
|
|
|
|
|
|
|
|
|
|
|
|
|
|
|
|
|
|
|
|
|
|
|
|
|
|
Цена на дизтопливо 10ppm (NWE, CIF) |
630 |
|
630 |
|
630 |
|
630 |
|
630 |
|
630 |
|
630 |
|
630 |
630 |
|
630 |
630 |
|
630 |
|
|
|
|
|
|
|
|
|
|
|
|
|
|
|
|
|
|
|
|||||||||||||
|
|
|
|
|
|
|
|
|
|
|
|
|
|
|
|
|
|
|
|
|
||||||||||||||||||||||||||||||||||
|
(-) экспортная пошлина |
|
|
-37 |
|
|
-37 |
|
|
-37 |
|
|
-37 |
|
|
-37 |
|
|
-37 |
|
|
-31 |
|
|
-25 |
|
-19 |
|
|
-12 |
|
-6 |
|
|
0 |
|
|
-6 |
|
|
-12 |
|
|
-19 |
|
|
-25 |
|
|
-31 |
|
|
-37 |
|
|
|
|
|
|
|
|
|
|
|
|
|
|
|
|
|
|
|
|
|
|
|
|
|
|
|
|
|
|
|
|
|
|
|
|
|
|
|
|
|
|
|
|
|
|
|
|
|
|
|
|
|
|
|
|
|
% от экспортной пошлины на нефть |
30% |
30% |
30% |
30% |
30% |
30% |
30% |
30% |
30% |
30% |
30% |
30% |
|
|
|
|
|
|
|
|
|
|
|
|
|
|
|
|
|
|
|||||||||||||||||||||||
|
|
|
|
|
|
|
|
|
|
|
|
|
|
|
|
|
|
|
|
|
|
|
|
|
|
|
|
|
|
|
|
|||||||||||||||||||||||
|
(-) транспортные затраты |
|
|
-70 |
|
|
-70 |
|
|
-70 |
|
|
-70 |
|
|
-70 |
|
|
-70 |
|
|
-70 |
|
|
-70 |
|
-70 |
|
|
-70 |
|
-70 |
|
|
-70 |
|
|
|
|
|
|
|
|
|
|
|
|
|
|
|
|
|
|
|
|
Экспортный нетбэк на дизтопливо |
523 |
|
523 |
|
523 |
|
523 |
|
523 |
|
523 |
|
529 |
|
535 |
541 |
|
548 |
554 |
|
560 |
|
+6 |
|
+12 |
|
+19 |
|
+25 |
|
+31 |
|
+37 |
|
|||||||||||||||||||
|
|
|
|
|
|
|
|
|
|
|
|
|
|
|
|
|
|
|
|
|
|
|
|
|
|
|
|
|
|
|
|
|
|
|
|
|
|
|
|
|
|
|||||||||||||
|
Цена на мазут 3,5% (NWE, CIF) |
|
|
400 |
|
|
400 |
|
|
400 |
|
|
400 |
|
|
400 |
|
|
400 |
|
|
400 |
|
|
400 |
|
400 |
|
|
400 |
|
400 |
|
|
400 |
|
|
|
|
|
|
|
|
|
|
|
|
|
|
|
|
|
|
|
|
(-) экспортная пошлина |
-124 |
-124 |
-124 |
-124 |
-124 |
-124 |
-104 |
-83 |
-62 |
-41 |
-21 |
0 |
|
-21 |
-41 |
-62 |
-83 |
-104 |
-124 |
||||||||||||||||||||||||||||||||||
|
|
|
|
|
|
|
|
|
|
|
|
|
|
|
|
|
|
|
|
|
|
|
|
|
|
|
|
|
|
|
|
|||||||||||||||||||||||
|
% от экспортной пошлины на нефть |
|
|
100% |
|
|
100% |
|
|
100% |
|
|
100% |
|
|
100% |
|
|
100% |
|
|
100% |
|
|
100% |
|
100% |
|
|
100% |
|
100% |
|
|
100% |
|
|
|
|
|
|
|
|
|
|
|
|
|
|
|
|
|
|
|
|
(-) транспортные затраты |
-90 |
-90 |
-90 |
-90 |
-90 |
-90 |
-90 |
-90 |
-90 |
-90 |
-90 |
-90 |
|
|
|
|
|
|
|
|
|
|
|
|
|
|
|
|
|
|
|||||||||||||||||||||||
|
|
|
|
|
|
|
|
|
|
|
|
|
|
|
|
|
|
|
|
|
|
|
|
|
|
|
|
|
|
|
|
|
|
|
|
|||||||||||||||||||
|
Экспортный нетбэк на мазут |
|
|
186 |
|
|
186 |
|
|
186 |
|
|
186 |
|
|
186 |
|
|
186 |
|
|
206 |
|
|
227 |
|
248 |
|
|
269 |
|
289 |
|
|
310 |
|
|
+21 |
|
|
+41 |
|
|
+62 |
|
|
+83 |
|
|
+104 |
|
|
+124 |
|
|
ЧИСТОЕ ИЗМЕНЕНИЕ НАЛОГОВОЙ НАГРУЗКИ: |
|
|
|
|
|
|
|
|
|
|
|
|
|
|
|
|
|
|
|
|
|
|
|
|
|
|
|
|
|
|
|
|
|
|
|
|
|
|
|
|
|
|
|
|
|
|
|
|
|
||||
|
|
|
|
|
|
|
|
|
|
|
|
|
|
|
|
|
|
|
|
|
|
|
|
|
|
|
|
|
|
|
|
|
|
|
|
|
|
|
|
|
|
|
|
|
|
|
|
|
|
|
|
|
|
|
|
Цена корзины нефтепродуктов |
586 |
|
586 |
|
586 |
|
586 |
|
586 |
|
586 |
|
586 |
|
586 |
586 |
|
586 |
586 |
|
586 |
|
|
|
|
|
|
|
|
|
|
|
|
|
|
|
|
|
|
|
|||||||||||||
|
|
|
|
|
|
|
|
|
|
|
|
|
|
|
|
|
|
|
|
|
||||||||||||||||||||||||||||||||||
|
(-) экспортная пошлина |
|
|
-59 |
|
|
-59 |
|
|
-59 |
|
|
-59 |
|
|
-59 |
|
|
-59 |
|
|
-49 |
|
|
-39 |
|
-29 |
|
|
-20 |
|
-10 |
|
|
0 |
|
|
-10 |
|
|
-20 |
|
|
-29 |
|
|
-39 |
|
|
-49 |
|
|
-59 |
|
|
|
|
|
|
|
|
|
|
|
|
|
|
|
|
|
|
|
|
|
|
|
|
|
|
|
|
|
|
|
|
|
|
|
|
|
|
|
|
|
|
|
|
|
|
|
|
|
|
|
|
|
|
|
|
|
(-) транспортные затраты |
-71 |
-71 |
-71 |
-71 |
-71 |
-71 |
-71 |
-71 |
-71 |
-71 |
-71 |
-71 |
|
|
|
|
|
|
|
|
|
|
|
|
|
|
|
|
|
|
|||||||||||||||||||||||
|
|
|
|
|
|
|
|
|
|
|
|
|
|
|
|
|
|
|
|
|
|
|
|
|
|
|
|
|
|
|
|
|
|
|
|
|||||||||||||||||||
|
Экспортный нетбэк корзины |
|
|
456 |
|
|
456 |
|
|
456 |
|
|
456 |
|
|
456 |
|
|
456 |
|
|
465 |
|
|
475 |
|
485 |
|
|
495 |
|
505 |
|
|
514 |
|
|
+10 |
|
|
+20 |
|
|
+29 |
|
|
+39 |
|
|
+49 |
|
|
+59 |
|
|
|
|
|
|
|
|
|
|
|
|
|
|
|
|
|
|
|
|
|
|
|
|
|
|
|
|
|
|
|
|
|
|
|
|
|
|
|
|
|
|
|
|
|
|
|
|
|
|
|
|
|
|
|
|
|
(-) затраты на сырье (нефть) |
-363 |
-363 |
-363 |
-363 |
-363 |
-363 |
-384 |
-405 |
-425 |
-446 |
-467 |
-488 |
-21 |
-41 |
-62 |
-83 |
-104 |
-124 |
|||||||||||||||||||||||||||||||||||
|
|
|
|
|
|
|
|
|
|
|
|
|
|
|
|
|
|
|
|
|
|
|
|
|
|
|
|
|
|
|
|
|
|
|
|
|
|
|
|
|
|
|
|
|
|
|
|
|
|
|
|
|
|
|
Примечание: оценка при цене на нефть Brent 70,0 долл./барр. и среднем курсе RUB/USD 65,0.
Источник: Консультант Плюс, данные компании, расчеты Газпромбанка
http://new.guap.ru/i04/contacts 4

vk.com/id446425943
4 ФЕВРАЛЯ 2019 Г. |
РОССИЯ > РЫНОК АКЦИЙ > НЕФТЕГАЗОВЫЙ СЕКТОР |
|
|
Диаграмма 3. Эффект завершения «налогового маневра» на сегмент downstream российского нефтяного сектора без учета субсидии и акцизов в удельном выражении (иллюстративный пример – Омский НПЗ Газпром нефти), $/т
|
|
|
При старом налогообложении |
|
|
|
|
|
|
При новом налогообложении |
|
|
|
|
|
||||||||
|
0 |
100 |
200 |
300 |
400 |
|
|
500 |
600 |
0 |
100 |
200 |
300 |
400 |
500 |
600 |
|||||||
|
|
|
|
|
|
|
|
|
|
|
|
|
|
|
|
|
|
|
|
|
|
|
|
ЦЕНА КОРЗИНЫ |
|
|
|
|
|
|
|
|
|
|
|
|
ЦЕНА КОРЗИНЫ |
|
|
|
|
|
|
|
|
|
|
|
|
|
|
586 |
|
|
|
|
|
|
|
|
|
586 |
|
|
|
|
|
|
|||
НЕФТЕПРОДУКТОВ |
|
|
|
|
|
|
|
|
|
|
|
НЕФТЕПРОДУКТОВ |
|
|
|
|
|
|
|
|
|||
|
|
|
|
|
|
|
|
|
|
|
|
|
|
|
|
|
|
|
|
|
|||
ЭКСПОРТНАЯ |
|
|
|
|
|
|
|
|
|
|
|
|
ЭКСПОРТНАЯ |
|
|
|
|
|
|
|
|
|
|
|
|
|
|
|
|
|
|
|
-59 |
|
|
|
|
|
|
|
|
0 |
|
||||
ПОШЛИНА |
|
|
|
|
|
|
|
|
|
|
|
ПОШЛИНА |
|
|
|
|
|
|
|
||||
|
|
|
|
|
|
|
|
|
|
|
|
|
|
|
|
|
|
|
|
|
|||
ТРАНСПОРТНЫЕ |
|
|
|
|
|
|
|
|
|
|
|
|
ТРАНСПОРТНЫЕ |
|
|
|
|
|
|
|
|
|
|
|
|
|
|
|
|
|
|
-71 |
|
|
|
|
|
|
|
|
|
-71 |
|
|
|||
ЗАТРАТЫ |
|
|
|
|
|
|
|
|
|
|
|
ЗАТРАТЫ |
|
|
|
|
|
|
|
|
|||
|
|
|
|
|
|
|
|
|
|
|
|
|
|
|
|
|
|
|
|
|
|||
ЭКСПОРТНЫЙ |
|
|
|
|
|
|
|
|
|
|
|
|
ЭКСПОРТНЫЙ |
|
|
|
|
|
|
|
|
|
|
|
|
|
456 |
|
|
|
|
|
|
|
|
|
514 |
|
|
|
|
|
|
||||
НЕТБЭК КОРЗИНЫ |
|
|
|
|
|
|
|
|
|
|
НЕТБЭК КОРЗИНЫ |
|
|
|
|
|
|
|
|
||||
|
|
|
|
|
|
|
|
|
|
|
|
|
|
|
|
|
|
|
|
|
|||
ЗАТРАТЫ НА |
|
|
|
|
|
-15 |
|
|
|
|
|
|
ЗАТРАТЫ НА |
|
|
|
|
-15 |
|
|
|
|
|
|
|
|
|
|
|
|
|
|
|
|
|
|
|
|
|
|
|
|
|||||
ПЕРЕРАБОТКУ |
|
|
|
|
|
|
|
|
|
|
|
ПЕРЕРАБОТКУ |
|
|
|
|
|
|
|
|
|||
|
|
|
|
|
|
|
|
|
|
|
|
|
|
|
|
|
|
|
|
|
|||
СТОИМОСТЬ |
|
|
|
|
|
|
|
|
|
|
|
|
СТОИМОСТЬ |
|
|
|
|
|
|
|
|
|
|
СЫРЬЯ |
|
|
|
|
-363 |
|
|
|
|
|
|
|
СЫРЬЯ |
|
|
-488 |
|
|
|
|
|
|
|
(НЕФТИ) |
|
|
рентаб-ть по EBITDA: 13% |
|
|
|
|
|
|
|
(НЕФТИ) |
12 рентаб-ть по EBITDA: 2% |
|
|
|
|
|
|
|||||
EBITDA (ОЦЕНКА) |
|
|
|
|
|
|
|
|
|
EBITDA (ОЦЕНКА) |
|
|
|
|
|
|
|||||||
|
78 |
|
|
|
|
|
|
|
|
|
|
|
|
|
|||||||||
|
|
|
|
|
|
|
|
|
|
|
|
|
|
|
|
|
|
|
|
|
|
|
|
Примечание: оценка при цене на нефть Brent 70,0 долл./барр. и среднем курсе RUB/USD 65,0.
Источник: Bloomberg, данные компании, Консультант Плюс, расчеты Газпромбанка
Российская нефтепереработка будет субсидироваться за счет отрицательного (обратного) акциза на нефтяное сырье
С целью компенсации удорожания сырья для российских НПЗ с 2019 г. вводится отрицательный (обратный) акциз на нефтяное сырье, применяемый к объему перерабатываемой нефти (Таблица 4).
Первый компонент формулы – акциз на нефтяное сырье – определяется произведением трех элементов:
i. |
экспортная пошлина на нефть с повышающим коэффициентом |
|
(как в новой формуле НДПИ); |
ii.коэффициент СПЮ, отражающий структуру корзины нефтепродуктов НПЗ;
iii.коэффициент KРЕГ, характеризующий логистическую удаленность НПЗ (выше для НПЗ, расположенных вдали от рынков сбыта/инфраструктуры). По нашим оценкам, коэффициент KРЕГ дает прибавку в 30-35 долл./т для наиболее отдаленных НПЗ, что соответствует дополнительному транспортному «плечу».
Второй компонент формулы – вычет по акцизу на нефтяное сырье (отрицательный акциз) – является суммой двух элементов:
i.акциз на нефтяное сырье (первый компонент), умноженный на 2,0x, и
ii.коэффициент KДЕМП (демпфер), представляющий собой компенсацию/ выплату за отклонение внутренних цен на бензин/дизтопливо от экспортного бенчмарка (см. следующий раздел).
Согласно нашим расчетам на примере Омского НПЗ Газпром нефти (Таблица 5 и Диаграмма 4), отрицательный акциз на нефтяное сырье (без учета демпфера) по сути компенсирует упомянутую выше существующую разницу между размером экспортных пошлин на нефть и нефтепродукты, с поправкой на структуру корзины продуктов и географическую удаленность каждого конкретного НПЗ.
http://new.guap.ru/i04/contacts 5

vk.com/id446425943
4 ФЕВРАЛЯ 2019 Г. |
РОССИЯ > РЫНОК АКЦИЙ > НЕФТЕГАЗОВЫЙ СЕКТОР |
|
|
Таблица 4. Формула отрицательного (обратного) акциза на нефтяное сырье для российских НПЗ
ИЗМЕНЕНИЕ
Введение акциза на нефтяное сырье
Введение вычета по акцизу на нефтяное сырье
ФОРМУЛА
Акциз на нефтяное сырье ($/т) = [Экспортная пошлина на нефть x Повышающий коэффициент] x СПЮ x KРЕГ
Вычет по акцизу на нефтяное сырье ($/т) = [Акциз на нефтяное сырье x 2,0] + КДЕМП
СОСТАВЛЯЮЩИЕ ФОРМУЛЫ
Экспортная пошлина на нефть ($/т) (ЭПНЕФТЬ) =
[Цена нефти Urals ($/барр.) x 7,3 – 182,5] x 0,3 + 29,2
Повышающий коэффициент (ККОРР) =
0,167 в 2019 г.,
0,333 в 2020 г.,
0,500 в 2021 г.,
0,667 в 2022 г.,
0,833 в 2023 г.,
1,000 в 2024 г.
Коэффициент, характеризующий структуру корзины нефтепродуктов НПЗ (СПЮ) = 1 – (55% x доля нафты) –
(30% х доля светлых и средних нефтепродуктов) –
(6,5% x доля кокса) –
(100% x доля темных нефтепродуктов)
Примечание: 55%, 30%, 6,5% и 100% – это действующие уровни экспортных пошлин на соответствующие нефтепродукты (% от экспортной пошлины на нефть).
Совокупная доля нафты, кокса, легких, средних и тяжелых нефтепродуктов должна быть не менее 75% от объема переработки.
Коэффициент, характеризующий логистическую удаленность НПЗ (КРЕГ) = 1,5 – Республика Хакасия и Красноярский край; 1,4 – Республика Тыва и Иркутская обл.;
1,3 – Ямало-Ненецкий АО, Ненецкий АО, Республики Коми, Саха (Якутия), Бурятия; 1,1 – Тюменская, Новосибирская, Томская, Кемеровская обл., Забайкальский край, Ханты-Мансийский АО; 1,05 – Омская обл., Алтайский край и Республика Алтай; 1,0 – прочие регионы.
Компенсация (+) /выплата (-) за отклонение внутренних цен на нефтепродукты от экспортного
бенчмарка (КДЕМП) = [(Премия/дисконт экспортного бенчмарка на бензин + 5 600 (при премии))
x Объем продаж бензина на внутреннем рынке +
(Премия/дисконт экспортного бенчмарка на дизтопливо + 5 000 (при премии)) x Объем продаж дизтоплива на внутреннем рынке]
x KКОМП
где:
oПремия/дисконт экспортного бенчмарка =
[(Экспортный бенчмарк + Акциз) x (1 + НДС)] – Индикативная внутренняя цена
Экспортный бенчмарк рассчитывается на основе единой для всех НПЗ стоимости фрахта и перевалки в морских портах, которая определяется как среднеарифметическое для маршрутов до Роттердама из портов Усть-Луга, Высоцк, Калининград для бензина и из портов Приморск, Высоцк, Санкт-Петербург для дизтоплива, и НЕ включает транспортное «плечо» от НПЗ до морских портов.
Индикативные внутренние цены на бензин класса 5 (за тонну) устанавливаются на уровне: 56 000 руб. в 2019 г., 58 800 руб. в 2020 г. и 61 740 руб. в 2021 г., на дизтопливо класса 5 (за тонну): 50 000 руб. в 2019 г., 52 500 руб. в 2020 г. и 55 125 руб. в 2021 г.
Примечание: KДЕМП = 0, если фактические оптовые цены на бензин/дизтопливо превышают на 10%
соответствующие индикативные внутренние цены o ККОМП = 0,6 в 2019 г. и 0,5 с 2020 г.
Источник: Консультант Плюс
http://new.guap.ru/i04/contacts 6

vk.com/id446425943
4 ФЕВРАЛЯ 2019 Г. |
РОССИЯ > РЫНОК АКЦИЙ > НЕФТЕГАЗОВЫЙ СЕКТОР |
|
|
Таблица 5. Эффект введения отрицательного (обратного) акциза на нефтяное сырье для российских НПЗ без учета демпфера в удельном выражении (иллюстративный пример – Омский НПЗ Газпром нефти), долл./т
|
|
|
|
|
|
|
СТАРОЕ НАЛОГООБЛОЖЕНИЕ |
|
|
|
|
|
|
|
НОВОЕ НАЛОГООБЛОЖЕНИЕ |
|
|
|
|
|
|
|
|
|
ИЗМЕНЕНИЕ CAH |
|
|
|
|
|
|
|||||||||||||||||||||||||
|
|
|
|
|
|
|
|
|
|
|
|
|
|
|
|
|
|
|
|
|
|
|
|
|
|
|
||||||||||||||||||||||||||||||
|
|
|
|
|
|
|
|
|
|
|
|
|
|
|
|
|
|
|
|
|
|
|
|
|
|
|
|
|
|
|
|
|
|
|
|
|
|
|
|
|
|
|
|
|
|
|
|
|
|
|
|
|
|
|
|
|
|
|
|
|
2019 |
|
|
2020 |
|
|
2021 |
|
|
2022 |
|
|
2023 |
|
|
2024 |
|
|
2019 |
|
|
2020 |
|
|
2021 |
|
|
2022 |
|
|
2023 |
|
|
2024 |
|
|
2019 |
|
|
2020 |
|
|
2021 |
|
|
2022 |
|
|
2023 |
|
|
2024 |
|
|
|
|
|
|
|
|
|
|
|
|
|
|
|
|
|
|
|
|
|
|
|
|
|
|
|
|
|
|
|
|
|
|
|
|
|
|
|
|
|
|
|
|
|
|
|
|
|
|
|
|
|
|
|
|
|
|
|
РАСЧЕТ АКЦИЗА НА НЕФТЯНОЕ СЫРЬЕ ДЛЯ НПЗ: |
|
|
|
|
|
|
|
|
|
|
|
|
|
|
|
|
|
|
|
|
|
|
|
|
|
|
|
|
|
|
|
|
|
|
|
|
|
|
|
|
|
|
|
|
|
|
|
|
|
|
|
||||
|
Акциз на нефтяное сырье, $/т |
|
|
|
|
|
|
|
|
|
|
|
|
|
|
|
|
|
|
12 |
|
23 |
35 |
|
47 |
58 |
|
70 |
|
|
|
|
|
|
|
|
|
|
|
|
|
|
|
|
|
|
|
|||||||||
|
|
|
|
|
|
|
|
|
|
|
|
|
|
|
|
|
|
|
|
|
|
|
|
|
|
|
|
|
|
|
|
|
|
|
|
|
|
|
|
|
|
|
|
|
|
|
|
|
|
|
|
|
|
|
|
|
|
стандартная экспортная пошлина |
|
|
- |
|
|
- |
|
|
- |
|
|
- |
|
|
- |
|
|
- |
|
|
17,1 |
|
|
17,1 |
|
|
17,1 |
|
|
17,1 |
|
|
17,1 |
|
|
17,1 |
|
|
|
|
|
|
|
|
|
|
|
|
|
|
|
|
|
|
|
|
на нефть, $/барр. |
|
|
|
|
|
|
|
|
|
|
|
|
|
|
|
|
|
|
|
|
|
|
|
|
|
|
|
|
|
|
|
|
|
|
|
|
|
|
|
|
|
|
|
||||||||||||
|
|
|
|
|
|
|
|
|
|
|
|
|
|
|
|
|
|
|
|
|
|
|
|
|
|
|
|
|
|
|
|
|
|
|
|
|
|
|
|
|
|
|
|
|
|
|
|
|
|
|
|
|
|
|
|
|
|
(х) повышающий коэф-т (ККОРР) |
- |
- |
|
- |
- |
|
- |
- |
|
0,167 |
|
0,333 |
0,500 |
|
0,667 |
0,833 |
|
1,000 |
|
|
|
|
|
|
|
|
|
|
|
|
|
|
|
|
|
|
|
||||||||||||||||||
|
|
|
|
|
|
|
|
|
|
|
|
|
|
|
|
|
|
|
|
|
|
|
|
|
|
|
|
|
|
|
|
|
|
|
|
|
|
|
|
|
|
|
|
|
|
|
|
|
|
|
|
|
|
|
|
|
|
(х) коэф-т СПЮ, характеризующий |
|
|
- |
|
|
- |
|
|
- |
|
|
- |
|
|
- |
|
|
- |
|
|
0,536 |
|
|
0,536 |
|
|
0,536 |
|
|
0,536 |
|
|
0,536 |
|
|
0,536 |
|
|
|
|
|
|
|
|
|
|
|
|
|
|
|
|
|
|
|
|
корзину нефтепродуктов НПЗ |
|
|
|
|
|
|
|
|
|
|
|
|
|
|
|
|
|
|
|
|
|
|
|
|
|
|
|
|
|
|
|
|
|
|
|
|
|
|
|
|
|
|
|
||||||||||||
|
|
|
|
|
|
|
|
|
|
|
|
|
|
|
|
|
|
|
|
|
|
|
|
|
|
|
|
|
|
|
|
|
|
|
|
|
|
|
|
|
|
|
|
|
|
|
|
|
|
|
|
|
|
|
|
|
|
для нафты |
- |
- |
|
- |
- |
|
- |
- |
|
0,550 |
|
0,550 |
0,550 |
|
0,550 |
0,550 |
|
0,550 |
|
|
|
|
|
|
|
|
|
|
|
|
|
|
|
|
|
|
|
||||||||||||||||||
|
|
|
|
|
|
|
|
|
|
|
|
|
|
|
|
|
|
|
|
|
|
|
|
|
|
|
|
|
|
|
|
|
|
|
|
|
|
|
||||||||||||||||||
|
для легких и средних НП |
|
|
- |
|
|
- |
|
|
- |
|
|
- |
|
|
- |
|
|
- |
|
|
0,300 |
|
|
0,300 |
|
|
0,300 |
|
|
0,300 |
|
|
0,300 |
|
|
0,300 |
|
|
|
|
|
|
|
|
|
|
|
|
|
|
|
|
|
|
|
|
для кокса |
- |
- |
|
- |
- |
|
- |
- |
|
0,065 |
|
0,065 |
0,065 |
|
0,065 |
0,065 |
|
0,065 |
|
|
|
|
|
|
|
|
|
|
|
|
|
|
|
|
|
|
|
||||||||||||||||||
|
|
|
|
|
|
|
|
|
|
|
|
|
|
|
|
|
|
|
|
|
|
|
|
|
|
|
|
|
|
|
|
|
|
|
|
|
|
|
||||||||||||||||||
|
для тяжелых НП |
|
|
- |
|
|
- |
|
|
- |
|
|
- |
|
|
- |
|
|
- |
|
|
1,000 |
|
|
1,000 |
|
|
1,000 |
|
|
1,000 |
|
|
1,000 |
|
|
1,000 |
|
|
|
|
|
|
|
|
|
|
|
|
|
|
|
|
|
|
|
|
|
|
|
|
|
|
|
|
|
|
|
|
|
|
|
|
|
|
|
|
|
|
|
|
|
|
|
|
|
|
|
|
|
|
|
|
|
|
|
|
|
|
|
|
|
|
|
|
|
|
|
|
|
|
|
|
|
(х) коэф-т KРЕГ, характеризующий |
- |
- |
|
- |
- |
|
- |
- |
|
1,05 |
|
1,05 |
1,05 |
|
1,05 |
1,05 |
|
1,05 |
|
|
|
|
|
|
|
|
|
|
|
|
|
|
|
|
|
|
|
||||||||||||||||||
|
логистическую удаленность НПЗ |
|
|
|
|
|
|
|
|
|
|
|
|
|
|
|
|
|
|
|
|
|
|
|
|
|
||||||||||||||||||||||||||||||
|
|
|
|
|
|
|
|
|
|
|
|
|
|
|
|
|
|
|
|
|
|
|
|
|
|
|
|
|
|
|
|
|
|
|
|
|
|
|
|
|
|
|
|
|
|
|
|
|
|
|
|
|
|
|
||
|
ЧИСТОЕ ИЗМЕНЕНИЕ НАЛОГОВОЙ НАГРУЗКИ: |
|
|
|
|
|
|
|
|
|
|
|
|
|
|
|
|
|
|
|
|
|
|
|
|
|
|
|
|
|
|
|
|
|
|
|
|
|
|
|
|
|
|
|
|
|
|
|
|
|
|
|
||||
|
|
|
|
|
|
|
|
|
|
|
|
|
|
|
|
|
|
|
|
|
|
|
|
|
|
|
|
|
|
|
|
|
|
|
|
|
|
|
|
|
|
|
|
|
|
|
|
|
|
|
|
|
|
|
|
|
|
Цена корзины нефтепродуктов |
586 |
586 |
|
586 |
586 |
|
586 |
586 |
|
586 |
|
586 |
586 |
|
586 |
586 |
|
586 |
|
|
|
|
|
|
|
|
|
|
|
|
|
|
|
|
|
|
|
||||||||||||||||||
|
|
|
|
|
|
|
|
|
|
|
|
|
|
|
|
|
|
|
|
|
||||||||||||||||||||||||||||||||||||
|
(-) экспортная пошлина |
|
|
-59 |
|
|
-59 |
|
|
-59 |
|
|
-59 |
|
|
-59 |
|
|
-59 |
|
|
-49 |
|
|
-39 |
|
|
-29 |
|
|
-20 |
|
|
-10 |
|
|
0 |
|
|
-10 |
|
|
-20 |
|
|
-29 |
|
|
-39 |
|
|
-49 |
|
|
-59 |
|
|
|
|
|
|
|
|
|
|
|
|
|
|
|
|
|
|
|
|
|
|
|
|
|
|
|
|
|
|
|
|
|
|
|
|
|
|
|
|
|
|
|
|
|
|
|
|
|
|
|
|
|
|
|
|
|
|
|
(-) транспортные затраты |
-71 |
-71 |
-71 |
-71 |
-71 |
-71 |
-71 |
-71 |
-71 |
-71 |
-71 |
-71 |
|
|
|
|
|
|
|
|
|
|
|
|
|
|
|
|
|
|
|||||||||||||||||||||||||
|
|
|
|
|
|
|
|
|
|
|
|
|
|
|
|
|
|
|
|
|
|
|
|
|
|
|
|
|
||||||||||||||||||||||||||||
|
Экспортный нетбэк корзины |
|
|
456 |
|
|
456 |
|
|
456 |
|
|
456 |
|
|
456 |
|
|
456 |
|
|
465 |
|
|
475 |
|
|
485 |
|
|
495 |
|
|
505 |
|
|
514 |
|
|
+10 |
|
|
+20 |
|
|
+29 |
|
|
+39 |
|
|
+49 |
|
|
+59 |
|
|
|
|
|
|
|
|
|
|
|
|
|
|
|
|
|
|
|
|
|
|
|
|
|
|
|
|
|
|
|
|
|
|
|
|
|
|
|
|
|
|
|
|
|
|
|
|
|
|
|
|
|
|
|
|
|
|
|
(-) затраты на сырье (нефть) |
-363 |
-363 |
-363 |
-363 |
-363 |
-363 |
-384 |
-405 |
-425 |
-446 |
-467 |
-488 |
-21 |
-41 |
-62 |
-83 |
-104 |
-124 |
|||||||||||||||||||||||||||||||||||||
|
|
|
|
|
|
|
|
|
|
|
|
|
|
|
|
|
|
|
|
|
|
|
|
|
|
|
|
|
|
|
|
|
|
|
|
|
|
|
|
|
|
|
|
|
|
|
|
|
|
|
|
|
|
|
|
|
|
(+) отрицательный акциз на |
|
|
- |
|
|
- |
|
|
- |
|
|
- |
|
|
- |
|
|
- |
|
|
12 |
|
|
23 |
|
|
35 |
|
|
47 |
|
|
58 |
|
|
70 |
|
|
+12 |
|
|
+23 |
|
|
+35 |
|
|
+47 |
|
|
+58 |
|
|
+70 |
|
|
нефтяное сырье* (субсидия) |
|
|
|
|
|
|
|
|
|
|
|
|
|
|
|
|
|
|
|
|
|
|
|
|
|
|
|
|
|
|
|
|
|
|
|
|
|
||||||||||||||||||
|
|
|
|
|
|
|
|
|
|
|
|
|
|
|
|
|
|
|
|
|
|
|
|
|
|
|
|
|
|
|
|
|
|
|
|
|
|
|
|
|
|
|
|
|
|
|
|
|
|
|
|
|
|
|
|
|
|
Чистый эффект |
|
|
|
|
|
|
|
|
|
|
|
|
|
|
|
|
|
|
|
|
|
|
|
|
|
|
|
|
|
|
|
|
|
|
|
|
+1 |
+1 |
+2 |
+3 |
|
+4 |
+4 |
|
|||||||||||
|
|
|
|
|
|
|
|
|
|
|
|
|
|
|
|
|
|
|
|
|
|
|
|
|
|
|
|
|
|
|
|
|
|
|
|
|
|
|
|
|
|
|
|
|
|
|
|
|
|
|
|
|
|
|
|
|
Примечание: оценка при цене на нефть Brent 70,0 долл./барр. и среднем курсе RUB/USD 65,0. * не включая КДЕМП.
Источник: Bloomberg, ИнфоТЭК, Консультант Плюс, данные компании, расчеты Газпромбанка
Диаграмма 4. Эффект введения отрицательного (обратного) акциза на нефтяное сырье для российских НПЗ без учета демпфера в удельном выражении, 2024П (иллюстративный пример – Омский НПЗ Газпром нефти), долл./т
|
|
|
При старом налогообложении |
|
|
|
|
|
|
|
При новом налогообложении |
|
|
|
|
|
||||||||
|
0 |
100 |
200 |
300 |
400 |
|
|
500 |
|
600 |
0 |
100 |
200 |
300 |
400 |
500 |
600 |
|||||||
ЦЕНА КОРЗИНЫ |
|
|
|
|
|
|
|
|
|
|
|
|
ЦЕНА КОРЗИНЫ |
|
|
|
|
|
|
|
|
|
|
|
|
|
|
|
|
|
|
|
|
|
|
|
|
|
|
|
|
|
|
|
|
|
|
||
|
|
|
|
586 |
|
|
|
|
|
|
|
|
|
|
|
586 |
|
|
|
|
|
|
||
|
|
|
|
|
|
|
|
|
|
|
НЕФТЕПРОДУКТОВ |
|
|
|
|
|
|
|
|
|
|
|||
НЕФТЕПРОДУКТОВ |
|
|
|
|
|
|
|
|
|
|
|
|
|
|
|
|
|
|
|
|
|
|||
|
|
|
|
|
|
|
|
|
|
|
|
|
|
|
|
|
|
|
|
|
|
|
||
|
|
|
|
|
|
|
|
|
|
|
|
ЭКСПОРТНАЯ |
|
|
|
|
|
|
|
|
0 |
|
||
ЭКСПОРТНАЯ |
|
|
|
|
|
|
|
|
|
|
|
|
|
|
|
|
|
|
|
|
|
|||
|
|
|
|
|
|
|
|
|
-59 |
|
|
ПОШЛИНА |
|
|
|
|
|
|
|
|
|
|||
ПОШЛИНА |
|
|
|
|
|
|
|
|
|
|
|
|
|
|
|
|
|
|
|
|
|
|
||
|
|
|
|
|
|
|
|
|
|
|
|
|
|
|
|
|
|
|
|
|
|
|
||
|
|
|
|
|
|
|
|
|
|
|
|
ТРАНСПОРТНЫЕ |
|
|
|
|
|
|
|
|
|
|
|
|
|
|
|
|
|
|
|
|
|
|
|
|
|
|
|
|
|
|
|
|
|
|
|
|
|
|
|
|
|
|
|
|
|
|
|
|
|
|
|
|
|
|
|
|
|
|
-71 |
|
|
|
ТРАНСПОРТНЫЕ |
|
|
|
|
|
|
|
|
|
|
|
|
ЗАТРАТЫ |
|
|
|
|
|
|
|
|
|
|
|
|
|
|
|
|
|
|
|
-71 |
|
|
|
|
|
|
|
|
|
|
|
|
|
|
||
ЗАТРАТЫ |
|
|
|
|
|
|
|
|
|
|
|
|
|
|
|
|
|
|
|
|
|
|
|
|
|
|
|
|
|
|
|
|
|
|
|
|
ЭКСПОРТНЫЙ |
|
|
|
|
|
|
|
|
|
|
|
|
|
|
|
|
|
|
|
|
|
|
|
|
|
|
|
|
|
|
|
|
|
|
|
|
|
|
|
|
|
|
|
|
|
|
|
|
|
|
|
|
|
|
514 |
|
|
|
|
|
|
|
|
|
|
|
|
|
|
|
|
|
|
|
|
НЕТБЭК КОРЗИНЫ |
|
|
|
|
|
|
|
|
|
|
|
ЭКСПОРТНЫЙ |
|
|
|
|
|
|
|
|
|
|
|
|
|
|
|
|
|
|
|
|
|
|
|
|
|
|
|
456 |
|
|
|
|
|
|
|
|
|
|
|
|
|
|
|
|
|
|
|
||
НЕТБЭК КОРЗИНЫ |
|
|
|
|
|
|
|
|
|
|
|
|
|
|
|
|
|
|
|
|
|
|
||
|
|
|
|
|
|
|
|
|
|
|
|
ЗАТРАТЫ НА |
|
|
|
|
|
|
-15 |
|
|
|
|
|
|
|
|
|
|
|
|
|
|
|
|
|
|
|
|
|
|
|
|
|
|
|
|
||
|
|
|
|
|
|
|
|
|
|
|
|
|
ПЕРЕРАБОТКУ |
|
|
|
|
|
|
|
|
|
|
|
ЗАТРАТЫ НА |
|
|
|
|
|
-15 |
|
|
|
|
|
|
|
|
|
|
|
|
|
|
|
|
|
|
|
|
|
|
|
|
|
|
|
|
|
СТОИМОСТЬ |
|
|
|
|
|
|
|
|
|
|
|
||
|
|
|
|
|
|
|
|
|
|
|
|
|
|
|
|
|
|
|
|
|
|
|||
ПЕРЕРАБОТКУ |
|
|
|
|
|
|
|
|
|
|
|
|
|
|
|
|
|
|
|
|
|
|
||
|
|
|
|
|
|
|
|
|
|
|
|
|
СЫРЬЯ |
|
|
|
|
-488 |
|
|
|
|
|
|
СТОИМОСТЬ |
|
|
|
|
|
|
|
|
|
|
|
|
(НЕФТИ) |
|
|
|
|
|
|
|
|
|
|
|
|
|
|
|
|
|
|
|
|
|
|
|
ОТРИЦ. АКЦИЗ |
|
|
|
|
|
|
|
|
|
|
|
|
СЫРЬЯ |
|
|
|
|
-363 |
|
|
|
|
|
|
|
|
|
|
|
|
|
|
|
|
|
|
|
|
|
|
|
|
|
|
|
|
|
|
НА НЕФТЯНОЕ |
|
+70 |
|
|
|
|
|
|
|
|
|
||
(НЕФТИ) |
|
|
|
|
|
|
|
|
|
|
|
|
|
|
|
|
|
|
|
|
|
|
||
|
|
|
|
|
|
|
|
|
|
|
|
|
СЫРЬЕ |
|
|
|
|
|
|
|
|
|
|
|
EBITDA (ОЦЕНКА) |
|
|
рентаб-ть по EBITDA: 13% |
|
|
|
|
|
|
|
|
|
|
|
|
|
|
|
|
|
|
|
||
|
78 |
|
|
|
|
|
|
|
EBITDA (ОЦЕНКА) |
|
|
рентаб-ть по EBITDA: 14% |
|
|
|
|
|
|
||||||
|
|
|
|
|
|
|
|
|
82 |
|
|
|
|
|
|
|||||||||
|
|
|
|
|
|
|
|
|
|
|
|
|
|
|
|
|
|
|
|
|
|
|
|
|
Примечание: оценка при цене на нефть Brent $70,0/барр. и среднем курсе RUB/USD 65,0.
Источник: Bloomberg, данные компании, Консультант Плюс, расчеты Газпромбанка
http://new.guap.ru/i04/contacts 7

vk.com/id446425943
4 ФЕВРАЛЯ 2019 Г. |
РОССИЯ > РЫНОК АКЦИЙ > НЕФТЕГАЗОВЫЙ СЕКТОР |
|
|
Российские нефтяные компании также могут получить компенсацию за отклонение внутренних цен на топливо от экспортного бенчмарка
В формулу отрицательного акциза на нефтяное сырье также включен коэффициент KДЕМП (демпфер), представляющий собой компенсацию/выплату за отклонение от экспортного бенчмарка внутренних цен на бензин/дизтопливо в размере половины (60% в 2019 г.) от премии/дисконта экспортного бенчмарка (Таблица 6).
Так, если экспортный бенчмарк выше внутренней цены, то KДЕМП представляет собой компенсацию для нефтяных компаний и увеличивает размер отрицательного акциза на нефтяное сырье. Если экспортный бенчмарк ниже внутренней цены, то KДЕМП представляет собой выплату для компаний и уменьшает размер отрицательного акциза на нефтяное сырье.
Отметим, что, по формуле KДЕМП, во-первых, экспортные бенчмарки на бензин/ дизтопливо едины для всех НПЗ и по сути не являются экспортными паритетами, т.к. в части затрат на транспортировку учитывают только стоимость перевалки в портах и фрахт до Роттердама, но не включают затраты на транспортировку нефтепродуктов от российских НПЗ до портов (основное транспортное «плечо»).
Таблица 6. Эффект введения коэффициента KДЕМП на российские НПЗ
|
|
|
|
БЕНЗИН КЛАССА 5 |
|
|
|
ДИЗТОПЛИВО КЛАССА 5 |
|
||||||||||
|
|
|
|
|
|
|
|
||||||||||||
|
|
|
|
|
|
|
|
|
|
|
|
|
|
|
|
|
|
|
|
|
|
|
|
2019 |
|
|
2020 |
|
2021 |
|
|
2019 |
|
|
2020 |
|
|
2021 |
|
|
|
|
|
|
|
|
|
|
|
|
|
|
|
|
|
|
|
|
|
|
$/Т |
|
|
|
|
|
|
|
|
|
|
|
|
|
|
|
|
|
|
|
|
|
|
|
|
|
|
|
|
|
|
|
|
|
|
|
|
|
|
|
Цена на в Европе |
670 |
|
670 |
|
670 |
|
630 |
630 |
|
630 |
|
|||||||
|
|
|
|
|
|
|
|
|
|
|
|
|
|||||||
|
(-) экспортная пошлина |
|
|
-31 |
|
|
-25 |
|
-19 |
|
|
-31 |
|
|
-25 |
|
|
-19 |
|
|
(-) стоимость перевалки в порту РФ и фрахта |
-25 |
|
-25 |
|
-25 |
|
-25 |
-25 |
|
-25 |
|
|||||||
|
|
|
|
|
|
|
|
|
|
|
|
|
|||||||
|
Экспортный бенчмарк |
|
|
614 |
|
|
620 |
|
626 |
|
|
574 |
|
|
580 |
|
|
586 |
|
|
РУБ./Т |
|
|
|
|
|
|
|
|
|
|
|
|
|
|
|
|
|
|
|
|
|
|
|
|
|
|
|
|
|
|
|
|
|
|
|
|
|
|
|
Экспортный бенчмарк |
39 903 |
|
40 306 |
|
40 711 |
|
37 303 |
37 706 |
|
38 111 |
|
|||||||
|
|
|
|
|
|
|
|
|
|
|
|
|
|||||||
|
(+) акциз на нефтепродукт |
|
|
12 314 |
|
|
12 752 |
|
13 262 |
|
|
8 541 |
|
|
8 835 |
|
|
9 188 |
|
|
(+) НДС (20%) |
10 443 |
|
10 612 |
|
10 795 |
|
9 169 |
9 308 |
|
9 460 |
|
|||||||
|
|
|
|
|
|
|
|
|
|
|
|
|
|||||||
|
Экспортный бенчмарк (включая НДС) |
|
|
62 661 |
|
|
63 670 |
|
64 768 |
|
|
55 013 |
|
|
55 849 |
|
|
56 759 |
|
|
(-) Индикативная внутренняя цена |
56 000 |
|
58 800 |
|
61 740 |
|
50 000 |
52 500 |
|
55 125 |
|
|||||||
|
|
|
|
|
|
|
|
|
|
|
|
|
|
|
|
|
|
|
|
|
Премия (+)/дисконт (-) экспортного бенчмарка |
|
|
6 661 |
|
|
4 870 |
|
3 028 |
|
|
5 013 |
|
|
3 349 |
|
|
1 634 |
|
|
к внутренней цене |
|
|
|
|
|
|
|
|
|
|
|
|
||||||
|
|
|
|
|
|
|
|
|
|
|
|
|
|
|
|
|
|
|
|
|
(+) Компенсационная надбавка |
5 600 |
|
5 600 |
|
5 600 |
|
5 000 |
5 000 |
|
5 000 |
|
|||||||
|
|
|
|
|
|
|
|
|
|
|
|
|
|||||||
|
Итого |
|
|
12 261 |
|
|
10 470 |
|
8 628 |
|
|
10 013 |
|
|
8 349 |
|
|
6 634 |
|
|
(x) коэф-т KКОМП |
0,6 |
|
0,5 |
|
0,5 |
|
|
0,5 |
|
0,5 |
|
|||||||
|
|
|
|
0,6 |
|
|
|||||||||||||
|
|
|
|
|
|
|
|
|
|
|
|
|
|||||||
|
Чистая компенсация (+)/выплата (-) |
|
|
7 356 |
|
|
5 235 |
|
4 314 |
|
|
6 008 |
|
|
4 175 |
|
|
3 317 |
|
|
|
|
|
|
|
|
|
|
|
|
|
|
|
|
|
|
|
|
|
Примечание: оценка при цене на нефть Brent 70,0 долл./барр. и среднем курсе RUB/USD 65,0.
Источник: Bloomberg, ИнфоТЭК, Консультант Плюс, данные компании, расчеты Газпромбанка
Во-вторых, в формуле KДЕМП предполагается фиксированный рост индикативных внутренних цен на бензин/дизтопливо (в рублях) на 5% в год в 2019-2021 гг., в то время как макро- и ценовая конъюнктура могут меняться.
Так, например, при ослаблении цен на нефть и укреплении рубля экспортные бенчмарки на нефтепродукты могут оказаться ниже индикативных внутренних цен, а коэффициент KДЕМП станет выплатой (вместо компенсации), уменьшая размер отрицательного акциза на нефтяное сырье для нефтяных компаний (Таблица 7).
В-третьих, как мы обсуждали выше, положительный эффект от KДЕМП частично нивелируется включением в новую формулу НДПИ на нефть коэффициента КАБДТ, увеличивающего ставку НДПИ в случае, если экспортные бенчмарки на бензин/ дизтопливо превышают внутренние цены на них (Таблица 1).
http://new.guap.ru/i04/contacts 8
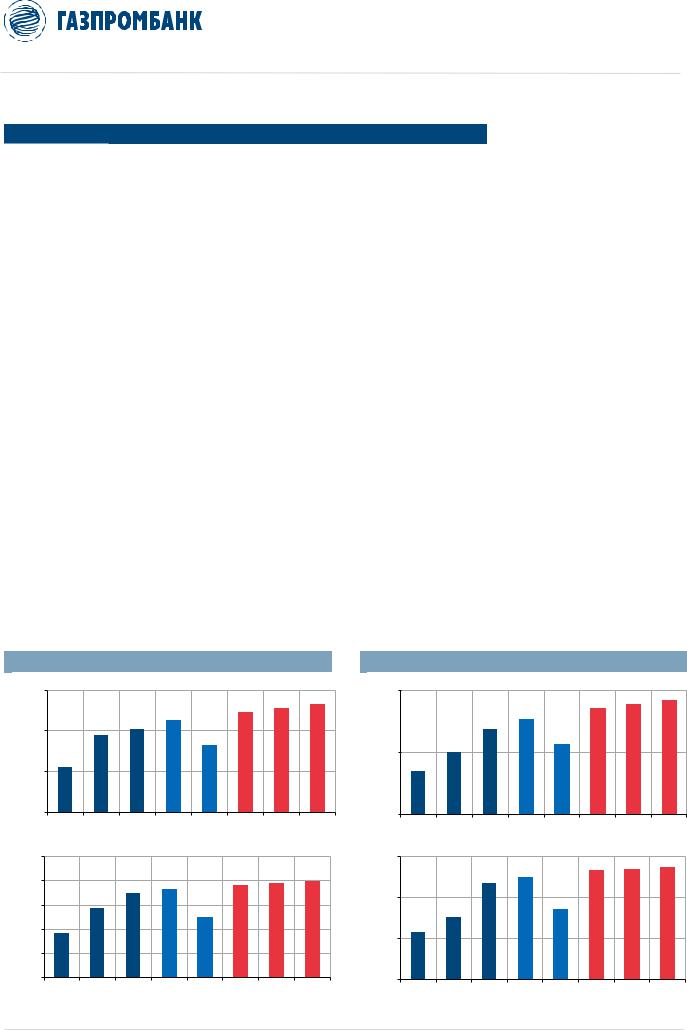
vk.com/id446425943
4 ФЕВРАЛЯ 2019 Г. |
РОССИЯ > РЫНОК АКЦИЙ > НЕФТЕГАЗОВЫЙ СЕКТОР |
|
|
Таблица 7. Чувствительность коэффициента KДЕМП в к цене на нефть и курсу рубля (оценка), руб./т
БЕНЗИН
|
|
|
|
|
|
|
|
|
|
ЦЕНА НА НЕФТЬ BRENT, ДОЛЛ./БАРР. |
|
|
|
|
|||||||||
|
|
|
|
|
|
|
|
|
|
|
|
|
|
|
|
|
|
|
|
|
|
|
|
|
|
|
|
|
|
|
|
$60 |
|
$65 |
|
|
|
$70 |
|
|
|
$75 |
|
|
$80 |
|
|
|
|
|
|
|
|
|
|
|
|
|
|
|
|
|
|
|
|
|
|
|
|
|
|
|
СРЕДНИЙКУРС |
|
|
|
75 |
|
6,903 |
9,340 |
|
|
|
11,776 |
|
|
14,213 |
|
16,650 |
|
|
||||
|
RUB/USD |
|
|
|
|
|
|
|
|
|
|
|
|
|
|
|
|
|
|
|
|
|
|
|
|
|
70 |
|
5,018 |
7,292 |
|
|
|
9,566 |
|
11,841 |
|
14,115 |
|
|
|||||||
|
|
|
65 |
|
|
|
|
|
|
|
|
|
|
|
|
|
|
|
|
|
|
||
|
|
|
|
|
-227 |
|
5,245 |
|
|
|
7,356 |
|
|
|
9,468 |
|
|
11,580 |
|
|
|||
|
|
|
|
|
60 |
|
-2,112 |
-163 |
|
|
|
5,146 |
|
7,096 |
|
9,045 |
|
|
|||||
|
|
|
|
|
|
|
|
|
|
|
|
|
|
|
|
|
|
|
|
|
|
|
|
|
|
|
|
|
55 |
|
-3,997 |
-2,210 |
|
|
|
-424 |
|
4,723 |
|
6,510 |
|
|
|||||
|
|
|
|
|
|
|
|
|
|
|
|
|
|
|
|
|
|
|
|
|
|
|
|
|
|
|
|
|
|
|
|
|
|
ДИЗТОПЛИВО |
|
|
|
|
|
|
|
|
|
|
|||
|
|
|
|
|
|
|
|
|
|
|
|
|
|
|
|
|
|
|
|
|
|
|
|
|
|
|
|
|
|
|
|
|
|
ЦЕНА НА НЕФТЬ BRENT, ДОЛЛ./БАРР. |
|
|
|
|
|||||||||
|
|
|
|
|
|
|
|
|
|
|
|
|
|
|
|
|
|
|
|
|
|
|
|
|
|
|
|
|
|
|
|
$60 |
|
$65 |
|
|
|
$70 |
|
|
$75 |
|
|
$80 |
|
|
|
|
|
|
|
|
|
|
|
|
|
|
|
|
|
|
|
|
|
|
|
|
|
|
|
|
СРЕДНИЙКУРС |
|
|
|
75 |
|
5,575 |
7,858 |
|
|
|
10,140 |
|
|
12,422 |
|
14,704 |
|
|
||||
|
RUB/USD |
|
|
|
|
|
|
|
|
|
|
|
|
|
|
|
|
|
|
|
|
|
|
|
|
|
70 |
|
3,814 |
5,944 |
|
|
|
8,074 |
|
10,204 |
|
12,334 |
|
|
|||||||
|
|
|
65 |
|
|
|
|
|
|
|
|
|
|
|
|
|
|
|
|
|
|
||
|
|
|
|
|
-948 |
|
4,030 |
|
|
|
6,008 |
|
|
|
7,986 |
|
|
9,964 |
|
|
|||
|
|
|
|
|
60 |
|
-2,710 |
-884 |
|
|
|
3,942 |
|
5,768 |
|
7,593 |
|
|
|||||
|
|
|
|
|
|
|
|
|
|
|
|
|
|
|
|
|
|
|
|
|
|
|
|
|
|
|
|
|
55 |
|
-4,471 |
-2,798 |
|
|
|
-1,124 |
|
3,549 |
|
5,223 |
|
|
|||||
|
|
|
|
|
|
|
|
|
|
|
|
|
|
|
|
|
|
|
|
|
|
|
|
|
|
|
|
|
|
|
|
Источник: расчеты Газпромбанка |
|
|
|
|
|||
Демпфер позволит компенсировать российским нефтяным компаниям ожидаемое |
|
|
|
|
|||||||||||
сдерживание роста цен на нефтепродукты на внутреннем рынке |
|
|
|
|
|
|
|
||||||||
Мы полагаем, что коэффициент KДЕМП (демпфер) введен с целью компенсировать |
|
|
|
|
|||||||||||
российским нефтяным компаниям ожидаемое сдерживание регуляторами роста |
|
|
|
|
|||||||||||
внутренних цен на нефтепродукты, обусловленного отменой экспортных пошлин на |
|
|
|
|
|||||||||||
нефтепродукты, повышением акцизов, удорожанием нефти и другими факторами. |
|
|
|
|
|
||||||||||
Российским нефтяным компаниям предстоит переложить на внутреннего потребителя |
|
|
|
|
|||||||||||
не только рост цен на нефтепродукты в результате отмены экспортных пошлин в |
|
|
|
|
|||||||||||
рамках завершения «налогового маневра», но и существенное повышение акцизов в |
|
|
|
|
|||||||||||
2019 г. (в среднем на ~30-40 долл./т г/г) (Диаграмма 5). |
|
|
|
|
|
|
|
|
|||||||
Диаграмма 5. Эволюция ставок акцизов на бензин и дизтопливо в РФ |
|
|
|
|
|
|
|
||||||||
|
|
|
БЕНЗИН КЛАССА 5 |
|
|
|
|
|
|
ДИЗТОПЛИВО КЛАССА 5 |
|
|
|
||
15 000 |
|
|
|
РУБ./Т |
|
|
|
10 000 |
|
|
|
РУБ./Т |
|
|
9 188 |
|
|
|
|
|
12 752 |
13 262 |
|
|
|
|
8 541 |
8 835 |
|||
|
|
|
|
|
12 314 |
|
|
|
|
|
|
||||
|
|
|
|
|
|
|
|
|
|
|
|
|
|||
|
|
|
|
11 213 |
|
|
|
|
|
|
7 665 |
|
|
|
|
|
|
|
10 130 |
|
|
|
|
|
|
6 800 |
|
|
|
||
|
|
9 480 |
|
|
|
|
|
|
|
|
|
|
|
||
10 000 |
|
|
|
|
|
|
|
|
|
|
5 665 |
|
|
|
|
|
|
|
8 213 |
|
|
|
|
|
5 007 |
|
|
|
|
||
|
|
|
|
|
|
|
|
|
|
|
|
|
|
|
|
|
5 530 |
|
|
|
|
|
|
5 000 |
3 450 |
|
|
|
|
|
|
|
|
|
|
|
|
|
|
|
|
|
|
|
|
||
|
|
|
|
|
|
|
|
|
|
|
|
|
|
|
|
5 000 |
|
|
|
|
|
|
|
|
|
|
|
|
|
|
|
0 |
|
|
|
|
|
|
|
0 |
|
|
|
|
|
|
|
|
2015 |
2016 |
2017 |
1П18 2П18 |
2019П |
2020П |
2021П |
|
2015 |
2016 |
2017 |
1П18 2П18 2019П |
2020П |
2021П |
|
250,0 |
|
|
|
ДОЛЛ./Т |
|
|
|
150,0 |
|
|
|
ДОЛЛ./Т |
133 |
135 |
137 |
|
|
|
|
|
|
|
|
|
|
124 |
|||||
|
|
|
|
|
191 |
194 |
198 |
|
|
|
117 |
|
|
|
|
200,0 |
|
|
174 |
181 |
|
|
|
|
|
|
|
||||
|
|
|
|
|
|
|
|
|
|
|
|
|
|||
|
|
|
|
|
|
|
|
|
|
|
|
|
|
||
150,0 |
|
143 |
|
124 |
|
|
|
100,0 |
|
75 |
|
86 |
|
|
|
|
|
|
|
|
|
|
|
|
|
|
|
|
|||
100,0 |
91 |
|
|
|
|
|
|
|
57 |
|
|
|
|
|
|
|
|
|
|
|
|
|
|
|
|
|
|
|
|
|
|
|
|
|
|
|
|
|
|
50,0 |
|
|
|
|
|
|
|
50,0 |
|
|
|
|
|
|
|
|
|
|
|
|
|
|
|
0,0 |
|
|
|
|
|
|
|
0,0 |
|
|
|
|
|
|
|
|
2015 |
2016 2017 1П18 2П18 |
2019П |
2020П |
2021П |
|
2015 |
2016 |
2017 |
1П18 2П18 2019П |
2020П |
2021П |
|||
Примечание: оценка при среднем курсе RUB/USD 65,0 |
|
|
|
|
|
|
Источник: Консультант Плюс, расчеты Газпромбанка |
||||||||
http://new.guap.ru/i04/contacts |
|
|
|
9 |
|
|
|
|
|
|
|
||||
|
|
|
|
|
|
|
|
|
|
|
|||||

vk.com/id446425943
4 ФЕВРАЛЯ 2019 Г. |
РОССИЯ > РЫНОК АКЦИЙ > НЕФТЕГАЗОВЫЙ СЕКТОР |
|
|
Регуляторы неоднократно заявляли о намерении сдерживать рост цен на топливо на внутреннем рынке. В ноябре 2018 г. правительство РФ подписало с нефтяными компаниями соглашение о мерах по стабилизации и развитию внутреннего рынка нефтепродуктов, действующее в течение 1К19, которое предполагает, что:
темпы роста цен на топливо с 1 января 2019 г. не должны быть выше 1,7% (с учетом повышения ставки НДС), а с 1 февраля – не выше прогнозного среднегодового уровня инфляции;
при реализации в мелком опте компании должны обеспечить цены, не превышающие индикативные значения, определенные для каждого региона (в среднем по РФ – 53 501 руб./т для бензина АИ-92, 56 649 руб./т – для бензина АИ-95 и 51 201 руб./т для бензина АИ-95, включая НДС);
компании обязаны увеличить объем реализации топлива по всем каналам не менее чем на 3% по сравнению с соответствующим месяцем 2017 г.1
При высоких ценах на нефть демпфер компенсирует компаниям и общее увеличение налоговой нагрузки вследствие завершения «налогового маневра», и негативный эффект от сдерживания роста внутренних цен на нефтепродукты
На примере Газпром нефти мы провели анализ эффекта от всех изменений в налогообложении российского нефтяного сектора в совокупности (Таблица 8). Газпром нефть имеет наибольшее присутствие в сегменте downstream в РФ: у компании коэффициент соотношения нефтепереработки к добыче нефти превышает 60% и большая доля продаж нефтепродуктов на внутреннем рынке.
Так, расширение налогооблагаемой базы в рамках завершения «налогового маневра» в сегменте upstream (переход на НДПИ) приводит к увеличению налоговой нагрузки Газпром нефти на порядка 600 млн долл. в 2019 г. при сценарии цен на нефть в 70 долл./барр.
В сегменте downstream сокращение экспортных пошлин в рамках завершения «налогового маневра» приводит к удорожанию сырья для российских НПЗ Газпром нефти на ~800 млн долл. в 2019 г., в то время как рост цен (нетбэков) на нефтепродукты компенсирует примерно половину этого. Чистый негативный эффект от сокращения экспортных пошлин составляет ~400 млн долл., и отрицательный акциз на нефтяное сырье (субсидия) для НПЗ Газпром нефти, не включая демпфер (КДЕМП), полностью покрывает эту сумму (~400 млн долл.).
Таким образом, можно сделать вывод, что рост цен (нетбэков) на нефтепродукты в результате снижения экспортных пошлин, в совокупности с отрицательным акцизом на нефтяное сырье полностью компенсирует НПЗ удорожание сырья.
Чистый эффект от завершения «налогового маневра» и ввода отрицательного акциза на нефтяное сырье без учета демпфера будет отрицательным для российских нефтяных компаний из-за расширения налогооблагаемой базы в сегменте upstream. Для Газпром нефти он оценивается в ~600 млн долл. в 2019 г. (~6% от прогнозируемой EBITDA компании).
Однако при высоких ценах на нефть (70 долл./барр. в нашем сценарии) демпфер (KДЕМП) позволит компенсировать компаниям и общее увеличение налоговой нагрузки в результате завершения «налогового маневра», и негативный эффект от сдерживания регуляторами роста цен на нефтепродукты на внутреннем рынке.
Так, демпфер для НПЗ Газпром нефти оценивается в +1,7 млрд долл. в 2019 г. по сравнению с убытком от продаж бензина/дизтоплива на внутреннем рынке по регулируемой цене (ниже экспортного паритета) в примерно 840 млн долл.
При более слабых ценах на нефть демпфер вместо компенсации (субсидии) становится дополнительной выплатой для компаний, однако в этом случае компании будут выигрывать от более высоких установленных внутренних цен на нефтепродукты (по сравнению с экспортным паритетом).
1 Не распространяются на Хабаровский НПЗ («Нефтегазхолдинг»)
http://new.guap.ru/i04/contacts 10
vk.com/id446425943
4 ФЕВРАЛЯ 2019 Г. |
РОССИЯ > РЫНОК АКЦИЙ > НЕФТЕГАЗОВЫЙ СЕКТОР |
|
|
Так, при цене на нефть в 50 долл./барр., демпфер Газпром нефти оценивается в -1,2 млрд долл. в 2019 г. (становится дополнительной выплатой), но компенсируется прибылью от продаж бензина/дизтоплива на внутреннем рынке по регулируемой цене, которая оказывается выше экспортного паритета.
Таблица 8. Совокупный эффект всех изменений в налогообложении и регулировании российского нефтяного сектора, 2019 г. (иллюстративный пример – Газпром нефть)
ЭФФЕКТ ОТ ЗАВЕРШЕНИЯ «НАЛОГОВОГО МАНЕВРА» (СНИЖЕНИЯ ЭКСПОРТНЫХ ПОШЛИН В 2019 Г.) НА СЕКТОР UPSTREAM ГАЗПРОМ НЕФТИ
|
|
НДПИ на нефть |
|
|
Экспорт |
|
Добыча |
|
|
|
|
Доля |
|
|
|
|
|
нефти |
||
нефти |
|
|
|
|
экспорта |
|
Старая |
Новая |
|
|
из РФ, |
||
в РФ |
|
|
нефти |
|||
ставка |
ставка |
|
Изм. |
2019П |
||
|
|
|
||||
|
налога |
налога |
|
|
|
|
млн. т |
$/т |
$/т |
$/т |
$ млн |
% |
млн. т |
60,7 |
195,0 |
215,7 |
20,8 |
1 261 |
39% |
18,6 |
Экспортная пошлина на нефть |
Увеличение |
||||
налоговой нагрузки |
|||||
|
|
|
|
||
|
|
|
|
в результате |
|
Старая |
Новая |
|
|
завершения |
|
ставка |
ставка |
|
Изм. |
«налогового |
|
налога |
налога |
|
|
маневра» |
|
$/т |
$/т |
$/т |
$ млн |
$ млн |
|
124,5 |
103,7 |
-20,8 |
-387 |
387 |
|
|
|
ИТОГО – |
|
Повышение |
|||
|
УВЕЛИЧЕНИЕ |
||
НДПИ на нефть |
|
||
|
НАЛОГОВОЙ |
||
при КДЕМП > 0 |
|
||
|
НАГРУЗКИ |
||
|
|
||
|
|
|
$/т |
$ млн |
$ млн |
% |
|
EBITDA |
||||
|
|
|
||
3,6 |
219 |
607 |
5,8% |
ЭФФЕКТ ОТ ЗАВЕРШЕНИЯ «НАЛОГОВОГО МАНЕВРА» (СНИЖЕНИЯ ЭКСПОРТНЫХ ПОШЛИН В 2019 Г.) НА НЕФТЕПЕРЕРАБОТКУ ГАЗПРОМ НЕФТИ |
|
|||||||||||
|
Удорожание |
|
Структура корзины НПЗ |
|
Рост нетбэков на нефтепродукты в результате |
ИТОГО – |
||||||
|
сырья (нефти) в |
|
|
|
снижения экспортных пошлин |
|
ЧИСТЫЙ |
|||||
Объем |
|
|
|
|
|
|
||||||
результате |
|
|
|
|
|
|
|
|
|
ЭФФЕКТ ОТ |
||
переработки |
|
|
|
|
|
|
|
|
|
|||
снижения |
|
Светлые/ |
|
|
|
Светлые/ |
|
|
|
СНИЖЕНИЯ |
||
нефти в РФ |
|
|
Темные |
|
|
Темные |
|
|||||
экспортных |
Нафта |
средние |
Кокс |
Нафта |
средние |
Кокс |
ИТОГО |
ЭКСПОРТНЫХ |
||||
|
НП |
НП |
||||||||||
|
пошлин |
|
НП |
|
|
НП |
|
|
ПОШЛИН |
|||
|
|
|
|
|
|
|
|
|||||
|
млн т |
$/т |
|
$ млн |
|
|
|
млн т |
|
|
|
$/т |
|
|
$ млн |
|
|
$ млн |
|
|
% |
|
|
|
|
|
|
|
|
|
|
|
|
|
|
||||||||||
|
|
|
|
|
|
|
|
|
|
|
|
|
|
EBITDA |
|
|||||||
|
|
|
|
|
|
|
|
|
|
|
|
|
|
|
|
|
|
|
|
|
|
|
Омский НПЗ |
21,0 |
|
|
-436 |
|
1,3 |
14,1 |
0,1 |
4,4 |
|
|
|
|
|
195 |
|
|
-241 |
|
|
-2,3% |
|
|
|
|
|
|
|
|
|
|
|
|
|
|
|
|
|
|||||||
|
|
|
|
|
|
|
|
|
|
|
|
|
|
|
|
|||||||
Московский НПЗ |
10,5 |
20,8 |
|
-218 |
|
0,0 |
5,8 |
0,0 |
4,4 |
11,4 |
6,2 |
1,4 |
20,8 |
|
127 |
|
|
-92 |
|
|
-0,9% |
|
|
|
|
|
|
|
|
|
|
|
|
|
|
|
|
|
|
|
|
|
|
|
|
|
|
|
|
|
|
|
|
|
|
|
|
|
|
|
|
|||||||
Ярославский НПЗ (50%) |
7,9 |
|
|
-163 |
|
0,2 |
4,3 |
0,0 |
3,0 |
|
|
|
|
|
91 |
|
|
-72 |
|
|
-0,7% |
|
|
|
|
|
|
|
|
|
|
|
|
|
|
|
|
|
|
|
|
|
|
|
|
|
|
|
|
|
|
|
|
|
|
|
|
|
|
|
|
|||||||
ИТОГО |
39,4 |
|
|
-818 |
|
|
|
|
|
|
|
|
|
|
413 |
|
|
-405 |
|
|
-3,8% |
|
|
|
|
|
|
|
|
|
|
|
|
|
|
|
|
|
|
|
|
|
|
|
|
|
|
|
|
|
|
|
|
|
|
|
|
|
|
|
|
|
|
|
|
|
|
|
ЭФФЕКТ ОТ ВВЕДНИЯ ОБРАТНОГО АКЦИЗА НА НЕФТЯНОЕ СЫРЬЕ (СУБСИДИИ) ДЛЯ НПЗ ГАЗПРОМ НЕФТИ
|
|
|
|
|
|
Структура корзины НПЗ, % |
|
|
Коэф-т, |
|
|
Коэф-т, |
|
|
Новая |
|
|
|
|
|
|
|
||||||
|
|
|
|
|
|
|
|
|
|
|
|
|
|
|
|
|
||||||||||||
|
|
Объем |
|
|
|
|
|
|
|
|
|
ставка |
|
|
|
|
|
|
|
|||||||||
|
|
|
|
|
|
|
|
|
|
|
|
|
|
характеризующий |
|
|
характеризующий |
|
|
|
|
|
ОБРАТНЫЙ АКЦИЗ НА |
|
||||
|
|
переработки |
|
|
|
|
Светлые/ |
|
|
|
|
|
|
|
структуру |
|
|
логистическую |
|
|
экспортной |
|
|
|
НЕФТЯНОЕ СЫРЬЕ |
|
||
|
|
нефти в РФ, |
|
|
|
|
|
|
|
|
Темные |
|
|
|
|
|
|
пошлины |
|
|
|
|
||||||
|
|
|
|
Нафта |
|
средние |
|
Кокс |
|
|
|
|
корзины НПЗ |
|
|
удаленность |
|
|
|
|
(НАЛОГОВАЯ СУБСИДИЯ) |
|
||||||
|
|
2018 |
|
|
|
|
|
|
НП |
|
|
|
|
|
|
на нефть |
|
|
|
|||||||||
|
|
|
|
|
|
НП |
|
|
|
|
|
|
(СПЮ) |
|
|
НПЗ (КРЕГ) |
|
|
|
|
|
|
|
|
|
|||
|
|
|
|
|
|
|
|
|
|
|
|
|
|
|
|
|
|
х ККОР |
|
|
|
|
|
|
|
|||
|
|
|
|
|
|
|
|
|
|
|
|
|
|
|
|
|
|
|
|
|
|
|
|
|
|
|
|
|
|
|
млн т |
|
|
% |
|
|
|
|
|
|
- |
|
- |
|
|
$/т |
|
$/т |
|
$ млн |
% EBITDA |
|
|||||
|
|
|
|
|
|
|
|
|
|
|
|
|
|
|
|
|
|
|
|
|
|
|
|
|
|
|
|
|
Омский НПЗ |
21,0 |
|
6,6% |
70,6% |
0,7% |
22,2% |
|
0,53 |
|
1,05 |
|
|
|
|
11,6 |
|
243 |
2,3% |
|
|||||||||
Московский НПЗ |
10,5 |
|
0,0% |
57,1% |
0,0% |
42,9% |
|
0,40 |
|
1,00 |
|
20,8 |
|
8,3 |
|
87 |
0,8% |
|
||||||||||
Ярославский НПЗ (50%) |
7,9 |
|
2,6% |
57,0% |
0,0% |
40,3% |
|
0,41 |
|
1,00 |
|
|
|
|
8,5 |
|
67 |
0,6% |
|
|||||||||
|
|
|
|
|
|
|
|
|
|
|
|
|
|
|
|
|
|
|
|
|
|
|
|
|
|
|
|
|
ИТОГО |
39,4 |
|
|
|
|
|
|
|
|
|
|
|
|
|
|
|
|
|
|
|
|
|
|
|
397 |
3,8% |
|
|
|
|
|
|
|
|
|
|
|
|
|
|
|
|
|
|
|
|
|
|
|
|
|
|
|
|
|
|
|
http://new.guap.ru/i04/contacts 11

vk.com/id446425943
4 ФЕВРАЛЯ 2019 Г. |
РОССИЯ > РЫНОК АКЦИЙ > НЕФТЕГАЗОВЫЙ СЕКТОР |
|
|
ЭФФЕКТ ОТ ПРОДАЖ НЕФТЕПРОДУКТОВ НА ВНУТРЕННЕМ РЫНКЕ ПО РЕГУЛИРУЕМЫМ ЦЕНАМ ДЛЯ НПЗ ГАЗПРОМ НЕФТИ
|
|
Объем |
|
|
Рыночная |
|
|
|
|
|
Экспортный паритет |
|
|
|
|
Индикативная |
|
|
Убыток от реализации |
|
|||||
|
|
|
|
|
|
|
|
|
|
|
|
|
|
|
|
||||||||||
|
|
|
|
|
|
|
|
|
|
|
|
|
|
|
|
|
|
|
|
||||||
|
|
продаж |
|
|
внутренняя цена |
|
|
|
|
|
|
|
|
|
|
|
|
|
|
|
нефтепродуктов |
|
|||
|
|
|
|
|
|
|
|
|
(-) |
|
(-) |
|
|
|
|
|
внутренняя |
|
|
|
|||||
|
|
нефтепродуктов |
|
|
(по экспортному |
|
|
|
Цена |
|
|
|
|
(+) |
|
|
|
|
по регулируемым |
|
|||||
|
|
|
|
|
|
|
|
|
|
|
|
|
цена на 1К19* |
|
|
|
|||||||||
|
|
в РФ, 2018 |
|
|
паритету) |
|
|
|
|
экспортная |
|
транспорт. |
|
|
|
|
|
|
ценам |
|
|
||||
|
|
|
|
|
|
|
в Европе |
|
|
|
|
акциз |
|
|
|
|
|
|
|
||||||
|
|
|
|
|
|
|
|
|
|
пошлина |
|
затраты |
|
|
|
|
|
|
|
|
|
|
|
||
|
|
|
|
|
|
|
|
|
|
|
|
|
|
|
|
|
|
|
|
|
|
|
|
||
|
|
млн т |
|
$/т |
|
|
$/т |
|
$/т |
|
$/т |
|
|
$/т |
|
|
$/т |
|
$/т |
|
$ млн |
|
|||
|
|
|
|
|
|
|
|
|
|
|
|
|
|
|
|
|
|
|
|
|
|
|
|
|
|
Омский НПЗ |
|
|
|
|
|
|
|
|
|
|
|
|
|
|
|
|
|
|
|
|
|
|
|
|
|
|
|
|
|
|
|
|
|
|
|
|
|
|
|
|
|
|
|
|
|
|
|
|
|
|
|
Бензин АИ-95 |
4.6 |
768 |
|
|
670 |
|
-31 |
|
-60 |
|
|
189 |
|
692 |
-76 |
|
-349 |
|
|||||||
|
|
|
|
|
|
|
|
|
|
|
|
||||||||||||||
|
|
|
|
|
|
|
|
|
|
|
|
||||||||||||||
Дизтопливо лет. |
4.2 |
660 |
|
|
630 |
|
-31 |
|
-70 |
|
|
131 |
|
648 |
-12 |
|
-53 |
|
|||||||
|
|
|
|
|
|
|
|
|
|
|
|
|
|
|
|
|
|
|
|
|
|
|
|
|
|
Московский НПЗ |
|
|
|
|
|
|
|
|
|
|
|
|
|
|
|
|
|
|
|
|
|
|
|
|
|
Бензин АИ-95 |
2.5 |
793 |
|
|
670 |
|
-31 |
|
-35 |
|
|
189 |
|
738 |
-56 |
|
-142 |
|
|||||||
|
|
|
|
|
|
|
|
|
|
|
|
||||||||||||||
|
|
|
|
|
|
|
|
|
|
|
|
||||||||||||||
Дизтопливо лет. |
2.1 |
685 |
|
|
630 |
|
-31 |
|
-45 |
|
|
131 |
|
648 |
-37 |
|
-79 |
|
|||||||
|
|
|
|
|
|
|
|
|
|
|
|
|
|
|
|
|
|
|
|
|
|
|
|
|
|
Ярославский НПЗ (50%) |
|
|
|
|
|
|
|
|
|
|
|
|
|
|
|
|
|
|
|
|
|
|
|
|
|
Бензин АИ-95 |
1.2 |
778 |
|
|
670 |
|
-31 |
|
-50 |
|
|
189 |
|
696 |
-83 |
|
-102 |
|
|||||||
|
|
|
|
|
|
|
|
|
|
|
|
|
|
|
|
|
|
|
|
|
|
|
|
|
|
|
|
|
|
|
|
|
|
|
|
|
|
|
|
|
|
|
|
|
|
|
|
|
|
|
|
|
|
|
|
|
|
|
|
|
|
|
|
||||||||||||||
Дизтопливо лет. |
2.0 |
690 |
|
|
630 |
|
-31 |
|
-40 |
|
|
131 |
|
631 |
-59 |
|
-118 |
|
|||||||
|
|
|
|
|
|
|
|
|
|
|
|
|
|
|
|
|
|
|
|
|
|
|
|
|
|
|
|
|
|
|
|
|
|
|
|
|
|
|
|
|
|
|
|
|
|
|
|
|
|
|
|
ИТОГО |
|
|
|
|
|
|
|
|
|
|
|
|
|
|
|
|
|
|
|
|
|
|
|
-843 |
|
|
|
|
|
|
|
|
|
|
|
|
|
|
|
|
|
|
|
|
|
|
|
|
|
|
|
|
|
|
|
|
|
|
|
|
|
|
|
|
|
|
|
|
|
|
|
|
|
|
|
|
|
ЭФФЕКТ ОТ ВВЕДНИЯ ДЕМПФЕРА (КДЕМП) ДЛЯ НПЗ ГАЗПРОМ НЕФТИ
|
|
|
|
|
|
|
Экспортный бенчмарк |
|
|
Экспортный |
|
|
Индикативная |
|
|
Премия |
|
|
|
|
|
Демпфер |
|
|
|||||
|
|
|
|
|
|
|
|
|
|
|
|
|
|
|
|
|
|
|
|
||||||||||
|
|
|
|
|
|
|
|
|
|
|
|
|
|
|
|
|
|
|
|
|
|
|
|
|
|||||
|
|
|
|
Экспортный |
|
|
|
|
|
|
(-) |
|
|
бенчмарк |
|
|
|
|
|
|
|
|
|
(60% от премии |
|
||||
|
|
|
|
|
|
|
|
(-) |
|
|
|
|
|
внутренняя |
|
|
экспортного |
|
|
Надбавка |
|
|
|
||||||
|
|
|
|
бенчмарк |
|
|
|
|
|
|
|
+ акциз |
|
|
|
|
|
|
|
|
экспортного бенчмарка |
|
|||||||
|
|
|
|
|
|
Цена |
|
|
стоимость |
|
|
|
|
цена** |
|
|
бенчмарка |
|
|
|
|
|
|
||||||
|
|
|
|
|
|
|
|
экспортная |
|
|
|
(вкл. НДС) |
|
|
|
|
|
|
|
|
|
+ надбавка) |
|
||||||
|
|
|
|
|
|
|
в Европе |
|
|
перевалки |
|
|
|
|
|
|
|
|
|
|
|
|
|
|
|||||
|
|
|
|
|
|
|
|
пошлина |
|
|
|
|
|
|
|
|
|
|
|
|
|
|
|
|
|
|
|
||
|
|
|
|
|
|
|
|
|
|
и фрахта |
|
|
|
|
|
|
|
|
|
|
|
|
|
|
|
|
|
|
|
|
|
|
|
|
|
|
|
|
|
|
|
|
|
|
|
|
|
|
|
|
|
|
|
|
|
|
|
|
|
|
|
|
|
$/т |
|
$/т |
|
$/т |
|
$/т |
|
|
$/т |
|
$/т |
|
$/т |
|
$/т |
|
$/т |
|
$ млн. |
|
|||||
|
|
|
|
|
|
|
|
|
|
|
|
|
|
|
|
|
|
|
|
|
|
|
|
|
|
|
|
|
|
|
Омский НПЗ |
|
|
|
|
|
|
|
|
|
|
|
|
|
|
|
|
|
|
|
|
|
|
|
|
|
|
|
|
|
Бензин АИ-95 |
614 |
|
|
670 |
|
-31 |
|
-25 |
|
964 |
862 |
102 |
86 |
113 |
|
517 |
|
|||||||||||
|
|
|
|
|
|
|
|
|
|
|
|
|
|
|
|
|
|
|
|
|
|
|
|
|
|
|
|
|
|
|
|
|
|
|
|
|
|
|
|
|
|
|
|
|
|||||||||||||||
|
Дизтопливо лет. |
574 |
|
|
630 |
|
-31 |
|
-25 |
|
846 |
769 |
77 |
77 |
92 |
|
390 |
|
|||||||||||
|
|
|
|
|
|
|
|
|
|
|
|
|
|
|
|
|
|
|
|
|
|
|
|
|
|
|
|
|
|
|
Московский НПЗ |
|
|
|
|
|
|
|
|
|
|
|
|
|
|
|
|
|
|
|
|
|
|
|
|
|
|
|
|
|
Бензин АИ-95 |
614 |
|
|
670 |
|
-31 |
|
-25 |
|
964 |
862 |
102 |
86 |
113 |
|
289 |
|
|||||||||||
|
|
|
|
|
|
|
|
|
|
|
|
|
|
|
|
|
|
|
|
|
|
|
|
|
|
|
|
|
|
|
|
|
|
|
|
|
|
|
|
|
|
|
|
|
|||||||||||||||
|
Дизтопливо лет. |
574 |
|
|
630 |
|
-31 |
|
-25 |
|
846 |
769 |
77 |
77 |
92 |
|
198 |
|
|||||||||||
|
|
|
|
|
|
|
|
|
|
|
|
|
|
|
|
|
|
|
|
|
|
|
|
|
|
|
|
|
|
|
Ярославский НПЗ (50%) |
|
|
|
|
|
|
|
|
|
|
|
|
|
|
|
|
|
|
|
|
|
|
|
|
|
|
|
|
|
Бензин АИ-95 |
614 |
|
|
670 |
|
-31 |
|
-25 |
|
964 |
862 |
102 |
86 |
113 |
|
140 |
|
|||||||||||
|
|
|
|
|
|
|
|
|
|
|
|
|
|
|
|||||||||||||||
|
|
|
|
|
|
|
|
|
|
|
|
|
|
|
|||||||||||||||
|
Дизтопливо лет. |
574 |
|
|
630 |
|
-31 |
|
-25 |
|
846 |
769 |
77 |
77 |
92 |
|
183 |
|
|||||||||||
|
|
|
|
|
|
|
|
|
|
|
|
|
|
|
|
|
|
|
|
|
|
|
|
|
|
|
|
|
|
|
|
|
|
|
|
|
|
|
|
|
|
|
|
|
|
|
|
|
|
|
|
|
|
|
|
|
|
||
|
ИТОГО |
|
|
|
|
|
|
|
|
|
|
|
|
|
|
|
|
|
|
|
|
|
|
|
|
|
1,716 |
|
|
|
|
|
|
|
|
|
|
|
|
|
|
|
|
|
|
|
|
|
|
|
|
|
|
|
|
|
|
|
|
|
|
|
|
|
|
|
|
|
|
|
|
|
|
|
|
|
|
|
|
|
|
|
|
|
|
|
|
|
|
ЧИСТЫЙ СОВОКУПНЫЙ ЭФФЕКТ ИЗМЕНЕНИЙ В НАЛОГООБЛОЖЕНИИ И РЕГУЛИРОВАНИИ НЕФЯТНОГО СЕКТОРА НА ГАЗПРОМ НЕФТЬ В РАЗЛИЧНЫХ СЦЕНАРИЯХ ЦЕН НА НЕФТЬ В 2019 Г., МЛН ДОЛЛ.
|
|
|
|
СРЕДНЯЯ ЦЕНА НЕФТИ BRENT, $/БАРР. |
|
|
|||||
|
|
|
|
|
|
|
|
|
|
|
|
|
|
|
|
$50 |
|
|
$60 |
|
|
$70 |
|
|
|
|
|
|
|
|
|
|
|
|
|
|
Сегмент upstream - ИТОГО |
|
|
-470 |
|
|
-539 |
|
|
-607 |
|
|
|
|
|
|
|
|
|
|
|
|
|
|
Повышение НДПИ (расширение налогооблагаемой базы) |
|
|
-470 |
|
|
-539 |
|
|
-607 |
|
|
|
|
|
|
|
|
|
|
|
|
|
|
Сегмент downstream - ИТОГО |
|
|
-5 |
|
|
-6 |
|
|
-8 |
|
|
|
|
|
|
|
|
|
|
|
|
|
|
Повышение стоимости сырья для НПЗ |
|
|
-262 |
|
|
-334 |
|
|
-405 |
|
|
|
|
|
|
|
|
|
|
|
|
|
|
Отрицательный акциз на нефтяное сырье (субсидия) |
|
|
257 |
|
|
327 |
|
|
397 |
|
|
|
|
|
|
|
|
|
|
|
|
|
|
ИТОГО |
|
|
-475 |
|
|
-545 |
|
|
-614 |
|
|
|
|
|
|
|
|
|
|
|
|
|
|
Прибыль (+)/убыток (-) от реализации нефтепродуктов |
2,074 |
616 |
|
-843 |
|
|||||
|
по регулируемым ценам на внутреннем рынке |
|
|
||||||||
|
|
|
|
|
|
|
|
|
|
||
|
Демпфер (компенсация (+)/выплата (-)) |
|
|
-1,201 |
|
|
-151 |
|
|
1,716 |
|
|
|
|
|
|
|
|
|
|
|
|
|
|
ИТОГО |
|
|
398 |
|
|
-80 |
|
|
259 |
|
|
|
|
|
|
|
|
|
|
|
|
|
Примечание: оценка при цене на нефть Brent 70,0 долл./барр. и среднем курсе RUB/USD 65,0.
* Установлена на 1К19 в рамках соглашения с нефтяными компаниями от ноября 2019 г. ** В формуле KДЕМП – 56 000 руб. на бензин и 50 000 на дизтопливо в 2019 г.
Источник: Bloomberg, ИнфоТЭК, Консультант Плюс, данные компании, расчеты Газпромбанка
http://new.guap.ru/i04/contacts 12

vk.com/id446425943
4 ФЕВРАЛЯ 2019 Г. |
РОССИЯ > РЫНОК АКЦИЙ > НЕФТЕГАЗОВЫЙ СЕКТОР |
|
|
Не все НПЗ смогут получить субсидии
Новое законодательство устанавливает требования к НПЗ для получения субсидии (отрицательного акциза на нефтяное сырье):
доля бензина/нафты/ароматики – 10% и более от объема нефтепереработки и внутренние продажи данных продуктов в объеме не менее 5 тыс. тонн в течение трех налоговых периодов; или
финансовые санкции в отношении компании, действующие по состоянию на 1 января 2018 г.; или
для НПЗ с мощностью переработки более 660 тыс. тонн в год – обязательство либо провести модернизацию, в результате которой объем производства автомобильного бензина класса 5 составит не менее 10% от объема нефтепереработки НПЗ, либо инвестировать в модернизацию не менее 60 млрд руб. в период с 2015 по 2024 гг.
http://new.guap.ru/i04/contacts 13

vk.com/id446425943
4 ФЕВРАЛЯ 2019 Г. |
РОССИЯ > РЫНОК АКЦИЙ > НЕФТЕГАЗОВЫЙ СЕКТОР |
|
|
Таблица 9. Оценка соответствия российских НПЗ требованиям для получения отрицательного (обратного) акциза на нефтяное сырье
|
|
|
|
ФИН. САНКЦИИ В ОТНОШЕНИИ |
|
|
ОБЪЕМ ВЫПУСКА И ПРОДАЖИ |
|
ПРОГРАММА МОДЕРНИЗАЦИИ |
|
|
ПРАВО НА НАЛОГОВЫЙ |
|
|
|
|
|
|
|
|
|
|
|
||||
|
|
|
|
|
|
НП СООТВЕТСТВУЮТ |
|
СООТВЕТСТВУЕТ |
|
|
|
||
|
|
|
|
СОБСТВЕННИКОВ |
|
|
|
|
|
ВЫЧЕТ |
|
||
|
|
|
|
|
|
УСЛОВИЮ |
|
УСЛОВИЮ |
|
|
|
||
|
|
|
|
|
|
|
|
|
|
|
|
||
|
РОСНЕФТЬ |
|
|
|
|
|
|
|
|
|
|
|
|
|
Ангарская НХК |
+ |
|
+ |
|
|
|
+ |
|
||||
|
|
|
|
|
|
|
|
|
|||||
|
Ачинский НПЗ |
|
|
+ |
|
|
+ |
|
+ |
|
|
+ |
|
|
Комсомольский НПЗ |
+ |
|
|
|
|
|
|
+ |
|
|||
|
Красноленинский НПЗ |
|
|
+ |
|
|
|
|
|
|
|
+ |
|
|
Куйбышевский НПЗ |
+ |
|
+ |
|
|
|
+ |
|
||||
|
|
|
|
|
|
|
|
|
|
|
|||
|
Нижневартовское НПО |
|
|
+ |
|
|
|
|
|
|
|
+ |
|
|
Новокуйбышевский НПЗ |
+ |
|
+ |
+ |
|
+ |
|
|||||
|
|
|
|
|
|
|
|
|
|
||||
|
Рязанский НПЗ |
|
|
+ |
|
|
+ |
|
|
|
|
+ |
|
|
Саратовский НПЗ |
+ |
|
+ |
|
|
|
+ |
|
||||
|
Стрежевской НПЗ |
|
|
+ |
|
|
+ |
|
|
|
|
+ |
|
|
Сызранский НПЗ |
+ |
|
+ |
|
|
|
+ |
|
||||
|
|
|
|
|
|
|
|
|
|
||||
|
Туапсинский НПЗ |
|
|
+ |
|
|
|
|
+ |
|
|
+ |
|
|
БАШНЕФТЬ |
|
|
|
|
|
|
|
|
|
|
|
|
|
Ново-Уфимский НПЗ |
+ |
|
+ |
|
|
|
+ |
|
||||
|
|
|
|
|
|
|
|
|
|
||||
|
Уфанефтехим |
|
|
+ |
|
|
+ |
|
|
|
|
+ |
|
|
Уфимский НПЗ |
+ |
|
+ |
|
|
|
+ |
|
||||
|
|
|
|
|
|
|
|
|
|
|
|
|
|
|
ЛУКОЙЛ |
|
|
|
|
|
|
|
|
|
|
|
|
|
Волгоградский НПЗ |
+ |
|
+ |
|
|
|
+ |
|
||||
|
Нижегородский НПЗ |
|
|
+ |
|
|
+ |
|
|
|
|
+ |
|
|
Пермский НПЗ |
+ |
|
+ |
|
|
|
+ |
|
||||
|
|
|
|
|
|
|
|
|
|
||||
|
Ухтинский НПЗ |
|
|
+ |
|
|
+ |
|
|
|
|
+ |
|
|
Мини-НПЗ в Урае |
+ |
|
+ |
|
|
|
+ |
|
||||
|
|
|
|
|
|
|
|
|
|
||||
|
Мини-НПЗ в Когалыме |
|
|
+ |
|
|
+ |
|
|
|
|
+ |
|
|
ГАЗПРОМ НЕФТЬ |
|
|
|
|
|
|
|
|
|
|
|
|
|
Московский НПЗ |
+ |
|
+ |
+ |
|
+ |
|
|||||
|
|
|
|
|
|
|
|
|
|||||
|
Омский НПЗ |
|
|
+ |
|
|
+ |
|
+ |
|
|
+ |
|
|
СЛАВНЕФТЬ |
|
|
|
|
|
|
|
|
|
|
|
|
|
Ярославский НПЗ |
+ |
|
+ |
|
|
|
+ |
|
||||
|
|
|
|
|
|
|
|
|
|
|
|
|
|
|
СУРГУТНЕФТЕГАЗ |
|
|
|
|
|
|
|
|
|
|
|
|
|
Киришский НПЗ |
+ |
|
+ |
|
|
|
+ |
|
||||
|
ТАТНЕФТЬ |
|
|
|
|
|
|
|
|
|
|
|
|
|
Кичуйский НПЗ |
|
|
|
+ |
|
|
|
+ |
|
|||
|
|
|
|
|
|
|
|
|
|
|
|||
|
ТАНЕКО |
|
|
|
|
|
|
|
+ |
|
|
+ |
|
|
ННК |
|
|
|
|
|
|
|
|
|
|
|
|
|
Хабаровский НПЗ |
+ |
|
+ |
|
|
|
+ |
|
||||
|
|
|
|
|
|
|
|
|
|
|
|
|
|
|
НОВЫЙ ПОТОК |
|
|
|
|
|
|
|
|
|
|
|
|
|
Антипинский НПЗ |
|
|
|
|
|
+ |
|
+ |
|
|||
|
|
|
|
|
|
|
|
|
|
|
|||
|
Афипский НПЗ |
|
|
|
|
|
|
|
+ |
|
|
+ |
|
|
Марийский НПЗ |
|
|
|
|
|
+ |
|
+ |
|
|||
|
ПРОЧИЕ |
|
|
|
|
|
|
|
|
|
|
|
|
|
Анжерская НГК |
|
|
|
|
|
|
|
|
- |
|
||
|
|
|
|
|
|
|
|
|
|
|
|
||
|
ВПК-Ойл |
|
|
|
|
|
|
|
|
|
|
- |
|
|
Ильский НПЗ |
|
|
|
|
|
+ |
|
+ |
|
|||
|
|
|
|
|
|
|
|
|
|
|
|
||
|
Краснодарэконефть |
|
|
|
|
|
|
|
|
|
|
- |
|
|
Новошахтинский НПЗ |
|
|
|
|
|
+ |
|
+ |
|
|||
|
Орскнефтеоргсинтез |
|
|
|
|
|
+ |
|
+ |
|
|
+ |
|
|
Первый завод |
|
|
|
|
|
|
|
|
- |
|
||
|
|
|
|
|
|
|
|
|
|
|
|||
|
Славянск ЭКО |
|
|
|
|
|
|
|
+ |
|
|
+ |
|
|
ТАИФ-НК |
|
|
|
+ |
+ |
|
+ |
|
||||
|
|
|
|
|
|
|
|
|
|
|
|
||
|
Томскнефтепереработка |
|
|
|
|
|
|
|
|
|
|
- |
|
|
Трансбункер |
|
|
|
|
|
|
|
|
- |
|
||
|
Яйский НПЗ |
|
|
|
|
|
|
|
+ |
|
|
+ |
|
|
|
|
|
|
|
|
|
|
|
|
|
|
|
Источник: Петромаркет, Интерфакс
http://new.guap.ru/i04/contacts 14
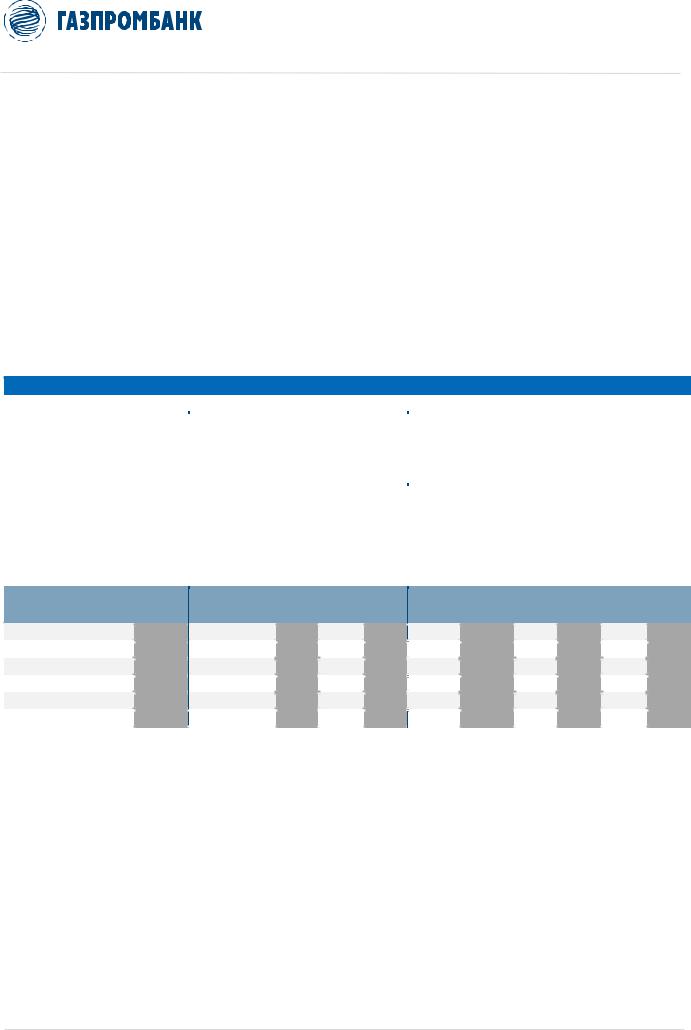
vk.com/id446425943
4 ФЕВРАЛЯ 2019 Г. |
РОССИЯ > РЫНОК АКЦИЙ > НЕФТЕГАЗОВЫЙ СЕКТОР |
|
|
Наибольшее присутствие в сегменте downstream в РФ – у Башнефти и Газпром нефти
Учитывая высокую сложность нового механизма субсидирования, мы полагаем, что первое время регуляторы будут мониторить налоговую нагрузку на нефтяные компании и поступления в бюджет и отслеживать искажения в ту или иную сторону, и ожидаем в будущем новых изменений в системе и формулах налогов.
В этом контексте российские нефтяные компании с наибольшей интеграцией в российский сегмент downstream (который субсидируется налоговой системой), на наш взгляд, находятся в зоне риска.
По нашим оценкам, среди российских нефтяных компаний наибольшее присутствие в сегменте downstream в РФ (высокий коэффициент соотношения нефтепереработки к добыче нефти, большая доля продаж нефтепродуктов на внутреннем рынке) – у Башнефти и Газпром нефти, а наименьшее – у Сургутнефтегаза и Татнефти (Таблица 10).
Таблица 10. Российские нефтяные компании – оценка присутствия в сегменте downstream в РФ
9 МЕСЯЦЕВ 2018 Г.
|
|
|
|
|
|
|
|
|
|
|
|
|
|
|
|
|
|
|
|
|
|
|
|
|
|
|
|
|
|
|
|
|
|
|
|
|
|
|
|
|
|
|
|
|
|
|
|
|
|
|
|
ВЫПУСК НЕФТЕПРОДУКТОВ В РФ, МЛН Т |
|
|
|
ПРОДАЖИ НЕФТЕПРОДУКТОВ НА ВНУТРЕННЕМ РЫНКЕ, МЛН Т |
|
|
|||||||||||||||||||||||
|
|
|
|
|
|
|
|
|
|
|
|
|
|
|
|
|
|
|
|
|
|
|
|
|
|
|
|
|
|
|
|
|
|
|
|
|
|
|
|
|
|
|
|
|
НЕФТЕПЕ- |
|
|
НЕФТЕПЕРЕ |
|
|
|
|
|
|
|
% ОТ |
|
|
|
|
|
% ОТ |
|
|
|
|
|
ДОЛЯ |
|
|
|
|
|
% ОТ |
|
|
|
|
|
% ОТ |
|
|
|
|
|
РЕРАБОТКА |
|
|
РАБОТКА К |
|
|
ИТОГО |
|
АВТО. |
|
|
|
|
ДИЗ. |
|
|
|
|
ВНУТР. |
|
|
|
|
АВТО. |
|
|
|
|
ДИЗ. |
|
|
|
|||||
|
|
|
|
|
|
|
|
|
|
|
ОБЪЕМА |
|
|
|
|
ОБЪЕМА |
|
|
|
|
ВНУТР. |
|
|
|
|
ВНУТР. |
|
|
|
|
ВНУТР. |
|
||||||||
|
|
|
|
В РФ*, |
|
|
ДОБЫЧЕ В |
|
|
ВЫПУСК |
|
БЕНЗИН |
|
|
|
|
ТОПЛИВО |
|
|
|
|
ПРОДАЖИ |
|
|
|
|
БЕНЗИН |
|
|
|
|
ТОПЛИВО |
|
|
|
|||||
|
|
|
|
|
|
|
|
|
|
|
ПР-ВА |
|
|
|
|
ПР-ВА |
|
|
|
|
ПРОДАЖ |
|
|
|
|
ПРОДАЖ |
|
|
|
|
ПРОДАЖ |
|
||||||||
|
|
|
|
МЛН Т |
|
|
РФ*, % |
|
|
|
|
|
|
|
|
|
|
|
|
|
|
|
|
|
|
|
|
|
|
|
|
|
|
|
|
|||||
|
|
|
|
|
|
|
|
|
|
|
|
|
|
|
|
|
|
|
|
|
|
|
|
|
|
|
|
|
|
|
|
|
|
|
|
|
|
|
||
|
Роснефть |
|
|
76,6 |
|
|
45% |
|
|
73,9 |
|
11,2 |
|
|
15% |
|
|
25,2 |
|
|
34% |
|
|
29,6 |
|
|
40% |
|
|
10,6 |
|
|
36% |
|
|
10,2 |
|
|
34% |
|
|
вкл. Башнефть |
13,6 |
|
|
96% |
|
12,6 |
3,5 |
|
|
28% |
|
5,3 |
|
|
42% |
|
6,6 |
|
|
52% |
|
2,9 |
|
|
44% |
|
1,4 |
|
|
21% |
|
||||||||
|
|
|
|
|
|
|
|
|
|
|
|
|
|
|
|
|
|
|
|
|
|
|
|
|
|
|
|
|
|
|
|
|
|
|
|
|
|
|
|
|
|
ЛУКОЙЛ |
|
|
32,3 |
|
|
53% |
|
|
30,5 |
|
6,1 |
|
|
20% |
|
|
12,1 |
|
|
40% |
|
|
19,1 |
|
|
63% |
|
|
5,9 |
|
|
31% |
|
|
4,5 |
|
|
23% |
|
|
Газпром нефть |
29,3 |
|
|
65% |
|
25,2 |
5,9 |
|
|
23% |
|
7,3 |
|
|
29% |
|
22,3 |
|
|
88% |
|
7,0 |
|
|
31% |
|
6,5 |
|
|
29% |
|
||||||||
|
|
|
|
|
|
|
|
|
|
|
|
|
|
|
|
|
|
|
|
|
|
|
|
|
|
|
|
|
|
|
|
|
|
|
|
|
|
|
|
|
|
Сургутнефтегаз |
|
|
13,4 |
|
|
30% |
|
|
12,8 |
|
1,8 |
|
|
14% |
|
|
5,2 |
|
|
40% |
|
|
2,6 |
|
|
20% |
|
|
0,8 |
|
|
33% |
|
|
1,0 |
|
|
40% |
|
|
Татнефть |
6,9 |
|
|
32% |
|
6,7 |
0,7 |
|
|
10% |
|
1,5 |
|
|
22% |
|
3,9 |
|
|
58% |
|
0,7 |
|
|
18% |
|
1,3 |
|
|
33% |
|
||||||||
|
|
|
|
|
|
|
|
|
|
|
|
|
|
|
|
|
|
|
|
|
|
|
|
|
|
|
|
|
|
|
|
|
|
|
|
|
|
|
|
|
|
|
|
|
|
|
|
|
|
|
|
|
|
|
|
|
|
|
2017 Г. |
|
|
|
|
|
|
|
|
|
|
|
|
|
|
|
|
|
|
|
|
||
|
|
|
|
|
|
|
|
|
|
|
|
|
|
|
|
|
|
|
|
|
|
|
|
|
|
|
|
|
|
|
|
|
|
|
|
|
|
|
|
|
|
|
|
|
|
|
|
|
|
|
|
ВЫПУСК НЕФТЕПРОДУКТОВ В РФ, МЛН Т |
|
|
|
ПРОДАЖИ НЕФТЕПРОДУКТОВ НА ВНУТРЕННЕМ РЫНКЕ, МЛН Т |
|
|
|||||||||||||||||||||||
|
|
|
|
|
|
|
|
|
|
|
|
|
|
|
|
|
|
|
|
|
|
|
|
|
|
|
|
|
|
|
|
|
|
|
|
|
|
|
|
|
|
|
|
|
НЕФТЕПЕ- |
|
|
НЕФТЕПЕРЕ |
|
|
|
|
|
|
|
|
|
|
|
|
|
|
|
|
|
|
|
|
|
|
|
|
|
|
|
|
|
|
|
|
|
|
|
|
|
|
|
|
|
|
|
|
|
|
% ОТ |
|
|
|
|
|
% ОТ |
|
|
|
|
|
ДОЛЯ |
|
|
|
|
|
% ОТ |
|
|
|
|
|
% ОТ |
|
||
|
|
|
|
РЕРАБОТКА |
|
|
РАБОТКА К |
|
|
ИТОГО |
|
АВТО. |
|
|
|
|
ДИЗ. |
|
|
|
|
ВНУТР. |
|
|
|
|
АВТО. |
|
|
|
|
ДИЗ. |
|
|
|
|||||
|
|
|
|
|
|
|
|
|
|
|
ОБЪЕМА |
|
|
|
ОБЪЕМА |
|
|
|
|
ВНУТР. |
|
|
|
|
ВНУТР. |
|
|
|
ВНУТР. |
|
||||||||||
|
|
|
|
В РФ*, |
|
|
ДОБЫЧЕ В |
|
|
ВЫПУСК |
|
БЕНЗИН |
|
|
|
|
ТОПЛИВО |
|
|
|
|
ПРОДАЖИ |
|
|
|
|
БЕНЗИН |
|
|
|
|
ТОПЛИВО |
|
|
|
|||||
|
|
|
|
|
|
|
|
|
|
|
ПР-ВА |
|
|
|
ПР-ВА |
|
|
|
|
ПРОДАЖ |
|
|
|
|
ПРОДАЖ |
|
|
|
ПРОДАЖ |
|
||||||||||
|
|
|
|
МЛН Т |
|
|
РФ*, % |
|
|
|
|
|
|
|
|
|
|
|
|
|
|
|
|
|
|
|
|
|
|
|
|
|
|
|
|
|||||
|
|
|
|
|
|
|
|
|
|
|
|
|
|
|
|
|
|
|
|
|
|
|
|
|
|
|
|
|
|
|
|
|
|
|
|
|
|
|
||
|
|
|
|
|
|
|
|
|
|
|
|
|
|
|
|
|
|
|
|
|
|
|
|
|
|
|
|
|
|
|
|
|
|
|
|
|
|
|
|
|
Роснефть |
100,6 |
45% |
96,9 |
15,2 |
16% |
33,0 |
34% |
38,7 |
40% |
15,3 |
40% |
11,8 |
30% |
вкл. Башнефть |
18,9 |
92% |
17,5 |
4,9 |
28% |
7,3 |
42% |
9,2 |
52% |
4,0 |
44% |
1,9 |
21% |
ЛУКОЙЛ |
43,1 |
53% |
40,7 |
8,1 |
20% |
15,8 |
39% |
24,8 |
61% |
7,8 |
31% |
5,7 |
23% |
Газпром нефть |
41,0 |
61% |
31,7 |
7,4 |
23% |
9,0 |
28% |
28,0 |
71% |
9,2 |
33% |
8,4 |
30% |
Сургутнефтегаз |
18,2 |
30% |
17,3 |
2,5 |
15% |
6,5 |
38% |
3,5 |
20% |
1,2 |
34% |
1,3 |
38% |
Татнефть |
8,4 |
29% |
8,5 |
1,0 |
11% |
1,5 |
18% |
5,5 |
65% |
1,0 |
17% |
1,5 |
27% |
* включая СП |
|
|
|
|
|
|
|
Источник: ИнфоТЭК, данные компаний, расчеты Газпромбанка |
|||||
http://new.guap.ru/i04/contacts 15

vk.com/id446425943
4 ФЕВРАЛЯ 2019 Г. |
РОССИЯ > РЫНОК АКЦИЙ > НЕФТЕГАЗОВЫЙ СЕКТОР |
|
|
Правительство оставляет за собой возможность вводить заградительные экспортные пошлины на нефть и нефтепродукты
Отметим, что в рамках новых изменений в налогообложении российского нефтегазового сектора правительство РФ оставляет за собой возможность вводить заградительные экспортные пошлины на нефтепродукты для стабилизации ситуации на внутреннем рынке.
Так, в Закон «О таможенном тарифе» внесены изменения, позволяющие правительству устанавливать заградительные ставки экспортных пошлин на нефтепродукты в размере 60% от экспортной пошлины на нефть при условии изменения цены на нефть на 15% или более в рублевом выражении относительно среднего уровня за предшествующие 3 месяца.
При этом в формуле экспортной пошлины на нефть (к которой привязаны экспортные пошлины на нефтепродукты) коэффициент 0,3 может быть повышен до 0,45:
Экспортная пошлина на нефть ($/т) (ЭПНЕФТЬ) =
[Цена нефти Urals ($/барр.) x 7,3 – 182,5] x 0,45 + 29,2
По нашим оценкам, при росте цены на нефть Brent с текущего уровня (~62 долл./барр.) на 15% до ~71 долл./барр. экспортная пошлина на нефть возрастет с 14,7 долл./барр. до 17,4 долл./барр., а заградительная пошлина на бензин составит около $76/т, т.е. более чем в два раза выше стандартной ставки.
Вместе с тем для сегмента upstream новые изменения в законодательстве предусматривают в случае введения заградительных экспортных пошлин на нефть компенсирующее снижение НДПИ. Так, в новую формулу НДПИ на нефть включен коэффициент ФМ, представляющий собой разницу между введенной заградительной экспортной пошлиной на нефть и стандартной ставкой:
KМАН = ЭПНЕФТЬ x сред. курс RUB/USD x ККОРР – ФМ
где:
ФМ = [П – ЭПНЕФТЬ x (1 – ККОРР)] x сред. курс RUB/USD
где:
П – заградительная экспортная пошлина нефть (в случае форс-мажора) ЭПНЕФТЬ – стандартная ставка экспортной пошлины
http://new.guap.ru/i04/contacts 16

vk.com/id446425943
117420, г. Москва, ул. Наметкина, 16, стр. 1. |
Офис: ул. Коровий вал, 7 |
|
|
Департамент анализа рыночной конъюнктуры |
|
|
|
+7 (495) 983 18 00 |
|
|
|
ПРОДАЖА ИНСТРУМЕНТОВ ФОНДОВОГО РЫНКА |
ПРОДАЖА ДОЛГОВЫХ ИНСТРУМЕНТОВ |
|
|
+7 (495) 988 24 10 |
+7 (495) 980 41 82 |
Copyright © 2003 – 2019. Газпромбанк (Акционерное общество). Все права защищены
Ограничение ответственности
Настоящий документ подготовлен Департаментом анализа рыночной конъюнктуры Газпромбанка (Акционерное общество) (далее – «Газпромбанк» или «мы»), зарегистрированного в Москве, Россия, и имеющего лицензию, выданную Центральным банком Российской Федерации. Если в настоящем документе присутствует обращение к «вам», то такое обращение адресовано к вам или вашей организации.
Настоящий документ является инвестиционной рекомендацией согласно положениям Директивы ЕС «О рынках финансовых инструментов» 2014/65 и Регламента ЕС «О злоупотреблениях на рынке» (MAR) 2014/596, и был подготовлен в соответствии с указанными документами, а также с политиками, процедурами и внутренними правилами Газпромбанка в части регулирования конфликтов интересов.
Настоящий документ не является индивидуальной инвестиционной рекомендацией в соответствии с Федеральным законом от 22.04.1996 № 39-ФЗ «О рынке ценных бумаг».
Настоящий документ содержит независимую оценку вопросов, содержащихся в нем, и не должен рассматриваться в качестве инвестиционного совета / индивидуальной инвестиционной рекомендации. В настоящем документе не учитывается целесообразность инвестиций, порядка действий или сопутствующих рисков для адресата. Настоящий документ не предназначен для предоставления индивидуальных инвестиционных советов и не учитывает конкретные инвестиционные цели, финансовое положение и индивидуальные потребности любого конкретного лица, которое может получить настоящий документ. Адресатам следует получать независимые профессиональные финансовые советы относительно юридических, финансовых, налоговых и регуляторных последствий любой транзакции, а также целесообразности и/или уместности инвестирования или осуществления любых инвестиционных стратегий, рассматриваемых в настоящем документе, а также принимать во внимание, что представленные в настоящем документе прогнозы могут не осуществиться. Любая информация и мнения, содержащиеся в настоящем документе, публикуются в качестве помощи адресатам, но не должны считаться неоспоримыми или заменять самостоятельное суждение адресата, могут быть изменены без предварительного уведомления и не могут служить единственным основанием для осуществления любой оценки рассматриваемых в настоящем документе инструментов. Инвесторам следует учитывать, что финансовые инструменты и иные инвестиционные инструменты, номинированные в иностранной валюте, подвержены колебаниям обменного курса, что может отрицательно повлиять на их стоимость.
Настоящий документ основан на информации, полученной из публичных источников, которые, по мнению Газпромбанка, являются надежными, однако мы не осуществляем проверку их точности и полноты, и они не должны восприниматься таковыми. За исключением информации, непосредственно связанной с Газпромбанком, Газпромбанк не несет ответственность за точность или полноту любой информации, представленной в настоящем документе.
В настоящем документе мы подтверждаем, что (i) мнения, изложенные в настоящем документе, отражают только наши взгляды в отношении конкретных компании или компаний и ее или их ценных бумаг, и (ii) никакая часть вознаграждения аналитика не связана в настоящее время, не была или не будет связана прямо или косвенно с конкретными рекомендациями или мнениями, изложенными в настоящем документе. Мнение Газпромбанка может отличаться от мнения аналитиков. Все мнения и оценки приведены по состоянию на дату публикации настоящего документа и могут быть изменены без предварительного уведомления. Все представленные в настоящем документе мнения являются личным мнением аналитиков в отношении событий и ситуаций, описанных и проанализированных в настоящем документе, и могут отличаться от или противоречить мнениям, выраженным инвестиционными и бизнес-подразделениями Газпромбанка вследствие использования ими иных подходов или предположений.
Настоящий документ может содержать прогнозы, предположения и/или целевые цены, которые представляют собой текущую оценку автора по состоянию на дату публикации настоящего документа.
Газпромбанк не обязан обновлять или изменять настоящий документ или в иных случаях уведомлять кого-либо о таких изменениях. Указанные в настоящем документе финансовые инструменты могут быть неподходящими инструментами инвестирования для инвесторов определенных категорий. Настоящий документ предназначен для Профессиональных клиентов.
Газпромбанк и связанные с ним физические лица (исключая любых финансовых аналитиков или иных сотрудников, участвующих в составлении настоящего документа) могут (в различном качестве) иметь позиции или заключать сделки, в том числе с ценными бумагами (или соответствующими деривативами), идентичными или подобными описанным в настоящем документе. Газпромбанк и/или его аффилированные лица могут также владеть ценными бумагами эмитентов, находящихся под его аналитическим покрытием.
Газпромбанк и/или его аффилированное (-ые) лицо (-а) могут влиять на рынок (выступать маркетмейкером) и/или предоставлять ликвидность по инструментам, указанным в настоящем документе.
Газпромбанк уважает конфиденциальность информации, которую он получает о своих клиентах, и соблюдает все применимые законы в отношении обработки такой информации. Газпромбанк ввел эффективные внутренние процедуры в отношении информационных барьеров (включая создание «китайских стен»), которые направлены на ограничение потоков информации между различными подразделениями Газпромбанка.
Для получения дополнительной информации, пожалуйста, используйте ссылку: https://www.gazprombank.ru.
Оплата труда сотрудников частично зависит от доходности Газпромбанка и его аффилированных лиц, которая включает в себя доходы от инвестиционно-банковских услуг.
В максимально возможной степени, разрешенной законом, Газпромбанк не принимает на себя какую-либо ответственность за какие-либо убытки, ущерб или расходы, возникшие прямо или косвенно (включая, но не ограничиваясь, специальные, случайные, сопутствующие, штрафные убытки или любые убытки, ущерб или расходы возникшие в результате в числе прочего любых искажений, ошибок, неполноты, упущений, заблуждений или неточностей, содержащихся в настоящем документе или любых сопутствующих услугах, или возникших в результате недоступности настоящего документа или любой его части или связанных с ним услуг) вследствие использования любой информации, содержащейся в настоящем документе или на веб-сайте Газпромбанка, включая любую информацию, которая может представлять собой инвестиционную рекомендацию/инвестиционное исследование.
Любая информация, содержащаяся в настоящем документе или в приложениях к настоящему документу, не может толковаться как предложение или склонение к покупке или продаже или подписке на какие-либо ценные бумаги или финансовые инструменты, как оферта или реклама, если иное прямо не указано в настоящем документе или приложениях к нему. Предыдущие результаты не являются гарантией будущих результатов. Оценки будущих результатов основаны на предположениях, которые могут не осуществиться.
Раскрытие конфликта интересов, если таковое имеется, может быть найдено в разделе раскрытия информации касательно настоящего документа.
Настоящий документ не был раскрыт эмитенту и не был впоследствии изменен.
Более подробную информацию о ценных бумагах, указанных в настоящем документе, можно получить по запросу в Газпромбанк.
Повторное распространение или воспроизведение полностью или частично настоящего документа запрещено без предварительного письменного разрешения Газпромбанка.
Адресатам следует самостоятельно определять, нет ли у них запрета на получение конкретной Инвестиционной рекомендации/конкретного Инвестиционного исследования в рамках MiFID II. Если MiFID II вам предписано получать настоящий документ на платной основе, или вы в иных случаях желаете заплатить за него, мы заключим отдельное письменное соглашение, в котором будут указаны условия, на которых вам будет предоставляться материал, включая оплату за его получение.
Для резидентов Гонконга: Исследования, содержащиеся в настоящем документе и имеющие отношение к «ценным бумагам» (согласно Положению о Ценных бумагах и Фьючерсах (Глава 571 Свода законов Гонконга)), публикуются в Гонконге самим GPB Financial Services Hong Kong Limited (GPBFSHK) или от его имени и по его поручению, и он берет на себя ответственность за их содержание. Информация, содержащаяся в настоящем документе, не должна толковаться как подразумевающая какие-либо отношения, консультативные или иные, между GPBFSHK и адресатом или пользователем настоящего документа, если это напрямую не согласовано с GPBFSHK. GPBFSHK не действует и не считается действующим как «фидуциар» или «инвестиционный менеджер» или «инвестиционный консультант» по отношению к любому адресату или пользователю этой информации, если это напрямую не согласовано с GPBFSHK. GPBFSHK регулируется Гонконгской Комиссией по Ценным бумагам и Фьючерсам. Пожалуйста, свяжитесь с [г-н Шон Ансел (+852 2867 1883) или г-н Джозеф Чу (+852 2867 1812)] в GPBFSHK, если у вас возникли какие-либо вопросы, связанные с настоящим документом.
Для GPB - Financial Services Ltd: Настоящий документ был подготовлен в соответствии с Директивой 2014/65/TU (MiFID II). Информация, содержащаяся в настоящем документе, предоставляется исключительно в информационных целях и не является маркетинговым сообщением, инвестиционным советом или личной рекомендацией, как это определено MiFID II. Данная информация не должна использоваться или рассматриваться как предложение или склонение к покупке или продаже или подписке на ценные бумаги или иные финансовые инструменты. Компания GPB-Financial Services Ltd регулируется Комиссией по Ценным бумагам и Биржам Кипра, номер лицензии 113/10.
http://new.guap.ru/i04/contacts
vk.com/id446425943
News Release
MARKET SENSITIVE INFORMATION
EMBARGOED UNTIL: 1100 (New York) / 1600 (UTC) February 1st 2019
J.P.Morgan Global Manufacturing PMI™
Produced by J.P.Morgan and IHS Markit in association with ISM and IFPSM
Global PMI sinks to near two-and-a-half year low at start of 2019
Growth of the global manufacturing sector slowed closer to stagnation in January. At 50.7, the J.P.Morgan Global Manufacturing PMI™ – a composite index1 produced by J.P.Morgan and IHS Markit in association with ISM and IFPSM – fell for the ninth straight month to its lowest reading since August 2016.
Due to a later-than-usual release date, data for the Malaysian Manufacturing PMI were not available to include in the global readings. Please also note that the back histories of the global manufacturing time series have been updated to reflect the annual review of the national weights applied to the data.
The US remained one of the stronger performing nations in January, with its PMI rising to buck the slowing trend seen at the global level. Moreover, if US data were excluded from the Global Manufacturing PMI calculation the reading would have been 50.0, a level signalling stagnation. The slowdown in China manufacturing was the main drag, as the China PMI fell to a near three-year low. The euro area and Japan PMIs fell to 50and 29-month lows respectively.
Sector data suggested that the consumer goods industry was the strongest performer, despite seeing its rate of expansion slow to a four-month low. The PMI for the intermediate goods sector fell to the stagnation mark of 50.0, while a slight contraction was signalled for investment goods producers.
The rate of expansion in global manufacturing production eased to a 31-month low in January. This mainly reflected a near-stalling in the rate of growth in new orders, as new business rose at the weakest pace during the current six-year sequence of expansion. New export work decreased for the fifth straight month and to the greatest extent since May 2016.
Better news was provided by the trends in employment and business confidence. Staffing levels rose for the twenty-ninth consecutive month, with the rate of job creation improving slightly. Meanwhile, manufacturers’ optimism regarding the one-year outlook for the sector rose to a four-month high.
Input cost inflation eased to a 19-month low in January, with rates of increase slowing (on average) in both developed and emerging markets. The pricing power of manufacturers held up comparatively well, with average output charges rising at a slightly quicker pace than before the turn of the year. Although average vendor lead-times lengthened again, it was to the least marked extent in almost two years.
JPMorgan Global Manufacturing PMI
DI, sa
60 |
|
|
|
|
|
|
|
|
55 |
|
|
|
|
|
|
|
|
50 |
|
|
|
|
|
|
|
|
45 |
|
|
|
|
|
|
|
|
2011 |
2012 |
2013 |
2014 |
2015 |
2016 |
2017 |
2018 |
2019 |
JPMorgan Global PMI Sectors: Manufacturing PMI
DI, sa
|
|
Investment Goods |
|
|
Intermediate Goods |
||||
60 |
|
|
|
(thick, dark line) |
|||||
|
(thin, dark line) |
|
|
||||||
|
|
|
|
|
|
||||
|
|
|
|
|
|
|
|||
55 |
|
|
|
|
|
|
|
|
|
50 |
|
|
|
|
|
|
|
|
|
45 |
Consumer Goods |
|
|
|
|
|
|
||
(thin, light line) |
|
|
|
|
|
|
|||
|
|
|
|
|
|
|
|||
40 |
|
|
|
|
|
|
|
|
|
|
2011 |
2012 |
2013 |
2014 |
2015 |
2016 |
2017 |
2018 |
2019 |
Global Manufacturing PMI™ Summary
50 = no change on prior month.
Index |
Dec. |
Jan. |
+/– |
Summary |
Global PMI |
51.4 |
50.7 |
– |
Rising, slower rate |
Output |
51.9 |
50.8 |
– |
Rising, slower rate |
New Orders |
51.1 |
50.1 |
– |
Rising, slower rate |
New Exports |
49.7 |
49.4 |
– |
Falling, faster rate |
Employment |
50.9 |
51.2 |
+ |
Rising, faster rate |
Input Prices |
55.3 |
54.2 |
– |
Rising, slower rate |
Output Prices |
51.4 |
51.5 |
+ |
Rising, faster rate |
Future Output |
58.8 |
60.7 |
+ |
Positive, greater extent |
Confidential | Copyright © 2019 IHS Markit Ltd |
Page 1 of 3 |
http://new.guap.ru/i04/contacts |
|

vk.com/id446425943
Contact Information:
For economics comments, data and technical queries, please call: |
|
|
IHS Markit |
IHS Markit Press Office |
J.P.Morgan Chase Bank |
Rob Dobson |
Joanna Vickers |
David Hensley |
Director |
Corporate Communications |
Director of Global Economics |
Telephone: +44-1491-461-095 |
Telephone: +44-207-260-2234 |
Coordination |
Mobile: +44-7826-913-863 |
|
Telephone: +1-212-834-5516 |
Email: rob.dobson@ihsmarkit.com |
Email: joanna.vickers@ihsmarkit.com |
Email: david.hensley@jpmorgan.com |
Notes to Editors:
The Global Report on Manufacturing is compiled by IHS Markit based on the results of surveys covering over 13,500 purchasing executives in over 40 countries. Together these countries account for an estimated 98% of global manufacturing output2. Questions are asked about real events and are not opinion based. Data are presented in the form of diffusion indices, where an index reading above 50.0 indicates an increase in the variable since the previous month and below 50.0 a decrease.
Data Sources:
|
% Share of |
|
|
|
Country |
global GDP2 |
Producer |
In association with |
Website |
United States1: |
21.6% |
|
|
|
After January 2010 |
|
IHS Markit |
– |
www.ihsmarkit.com/products/pmi.html |
Before Feb-2010 |
|
ISM |
– |
www.ism.ws |
China |
12.7% |
IHS Markit |
Caixin |
www.caixin.com |
Japan |
7.7% |
IHS Markit |
Nikkei |
www.nikkei.co.jp/nikkeiinfo/en/ |
Germany |
4.8% |
IHS Markit |
BME |
www.bme.de |
France |
3.6% |
IHS Markit |
– |
www.ihsmarkit.com/products/pmi.html |
United Kingdom |
3.5% |
IHS Markit |
CIPS |
www.cips.org |
India |
3.3% |
IHS Markit |
Nikkei |
www.nikkei.co.jp/nikkeiinfo/en/ |
Brazil |
2.8% |
IHS Markit |
– |
www.ihsmarkit.com/products/pmi.html |
Italy |
2.6% |
IHS Markit |
– |
www.ihsmarkit.com/products/pmi.html |
Canada |
2.4% |
IHS Markit |
SCMA |
www.scma.com |
Russia |
2.1% |
IHS Markit |
– |
www.ihsmarkit.com/products/pmi.html |
Spain |
1.9% |
IHS Markit |
AERCE |
www.aerce.org |
Australia |
1.7% |
IHS Markit |
Commonwealth Bank |
www.commbank.com.au |
South Korea |
1.7% |
IHS Markit |
Nikkei |
www.nikkei.co.jp/nikkeiinfo/en/ |
Mexico |
1.6% |
IHS Markit |
– |
www.ihsmarkit.com |
Turkey |
1.5% |
IHS Markit |
Istanbul Chamber of Industry |
www.ihsmarkit.com/products/pmi.html |
Indonesia |
1.4% |
IHS Markit |
Nikkei |
www.nikkei.co.jp/nikkeiinfo/en/ |
Netherlands (The) |
1.1% |
IHS Markit |
NEVI |
www.nevi.nl |
Saudi Arabia3 |
0.9% |
IHS Markit |
Emirates NBD |
www.emiratesnbd.com |
Switzerland |
0.8% |
procure.ch |
Credit Suisse |
www.procure.ch, www.credit-suisse.ch |
Poland |
0.7% |
IHS Markit |
– |
www.ihsmarkit.com/products/pmi.html |
Taiwan |
0.6% |
IHS Markit |
Nikkei |
www.nikkei.co.jp/nikkeiinfo/en/ |
Nigeria3 |
0.6% |
IHS Markit |
Stanbic IBTC Bank |
www.stanbicibtcbank.com/ |
Austria |
0.5% |
IHS Markit |
Unicredit Bank Austria |
www.bankaustria.at, www.opwz.com |
South Africa3 |
0.5% |
IHS Markit |
– |
www.ihsmarkit.com/products/pmi.html |
Thailand |
0.5% |
IHS Markit |
Nikkei |
www.nikkei.co.jp/nikkeiinfo/en/ |
UAE3 |
0.5% |
IHS Markit |
Emirates NBD |
www.emiratesnbd.com |
Colombia |
0.5% |
IHS Markit |
Davivienda |
www.davivienda.com |
Malaysia |
0.5% |
IHS Markit |
Nikkei |
www.nikkei.co.jp/nikkeiinfo/en/ |
Ireland |
0.4% |
IHS Markit |
– |
www.ihsmarkit.com/products/pmi.html |
Denmark |
0.4% |
DILF |
Kairoscommodities |
www.dilf.dk, www.kairoscommodities.com |
Singapore3 |
0.4% |
IHS Markit |
Nikkei |
www.nikkei.co.jp/nikkeiinfo/en/ |
Philippines (The) |
0.4% |
IHS Markit |
Nikkei |
www.nikkei.co.jp/nikkeiinfo/en/ |
Israel |
0.4% |
IPLMA |
Bank Hapoalim Ltd |
www.iplma.org.il, www.bankhapoalim.co.il |
Hong Kong3 |
0.4% |
IHS Markit |
Nikkei |
www.nikkei.co.jp/nikkeiinfo/en/ |
Egypt3 |
0.3% |
IHS Markit |
Emirates NBD |
www.emiratesnbd.com |
Greece |
0.3% |
IHS Markit |
HPI |
www.hellenicsupply.org |
Czech Republic |
0.3% |
IHS Markit |
– |
www.ihsmarkit.com/products/pmi.html |
New Zealand |
0.2% |
Business NZ |
Bank of New Zealand |
www.businessnz.org.nz, www.bnz.co.nz |
Vietnam |
0.2% |
IHS Markit |
Nikkei |
www.nikkei.co.jp/nikkeiinfo/en/ |
Hungary |
0.2% |
HALPIM |
– |
www.logisztika.hu |
Myanmar |
0.1% |
IHS Markit |
Nikkei |
www.nikkei.co.jp/nikkeiinfo/en/ |
Kenya3 |
0.1% |
IHS Markit |
Stanbic Bank |
www.stanbicbank.co.ke |
Lebanon3 |
0.1% |
IHS Markit |
BLOMINVEST Bank |
www.blominvestbank.com |
1Data from the IHS Markit survey of US manufacturing are included in the global manufacturing PMI composition from February 2010 onwards. Data prior to that date are based on the ISM US manufacturing survey.
2Source: World Bank World Development Indicators (2017 data, constant US$ measure).
3For these nations, manufacturing sector responses are extracted from whole economy PMI surveys for inclusion in the Global Manufacturing PMI
Confidential | Copyright © 2019 IHS Markit Ltd |
Page 2 of 3 |
http://new.guap.ru/i04/contacts |
|
vk.com/id446425943
Methodology: Global Manufacturing PMI™ Indices
The Global Manufacturing PMI™ indices are all seasonally adjusted. The seasonal adjustment is applied at the national level (as opposed to at the global aggregate level) in order to account for differing seasonal patterns in each of the nations included. Global Manufacturing PMI™ indices are weighted according to national contributions to global manufacturing gross value added. Weights for the global indices are derived from the latest available World Bank data on the gross value added of manufacturing for each of the nations covered. World Bank data on value added are in constant 2010 US$, with all national currencies converted to 2010 US$ by the World Bank using DEC alternative conversion factors.
JPMorgan Chase & Co.
JPMorgan Chase & Co. (NYSE: JPM) is a leading global financial services firm with assets of $2.3 trillion and operations in more than 60 countries. The firm is a leader in investment banking, financial services for consumers, small business and commercial banking, financial transaction processing, asset management and private equity. A component of the Dow Jones Industrial Average, JPMorgan Chase & Co. serves millions of consumers in the United States and many of the world's most prominent corporate, institutional and government clients under its J.P. Morgan and Chase brands. Information about JPMorgan Chase & Co. is available at www.jpmorganchase.com.
IHS Markit
IHS Markit (Nasdaq: INFO) is a world leader in critical information, analytics and solutions for the major industries and markets that drive economies worldwide. The company delivers next-generation information, analytics and solutions to customers in business, finance and government, improving their operational efficiency and providing deep insights that lead to well-informed, confident decisions. IHS Markit has more than 50,000 business and government customers, including 80 percent of the Fortune Global
500 and the world’s leading financial institutions. www.ihsmarkit.com
IHS Markit is a registered trademark of IHS Markit Ltd. and/or its affiliates. All other company and product names may be trademarks of their respective owners.
© 2019 IHS Markit Ltd. All rights reserved.
Institute for Supply Management™ (ISM)
Institute for Supply Management® (ISM®) serves supply management professionals in more than 90 countries. Its 50,000 members around the world manage about US$1 trillion in corporate and government supply chain procurement annually. Founded in 1915 as the first supply management institute in the world, ISM is committed to advancing the practice of supply management to drive value and competitive advantage for its members, contributing to a prosperous and sustainable world. ISM leads the profession through the ISM Report On Business®, its highly regarded certification programs and the ISM Mastery Model®. www.instituteforsupplymanagement.org
International Federation of Purchasing and Supply Management (IFPSM)
The International Federation of Purchasing and Supply Management (IFPSM) is the union of 48 National and Regional Purchasing Associations worldwide. Within this circle, about 250,000 Purchasing Professionals can be reached. IFPSM facilitates the development and distribution of knowledge to elevate and advance the procurement profession, thus favourably impacting the standard of living of citizens worldwide through improved business practices. The term procurement is taken to embrace purchasing, materials management, logistics, supply chain management and strategic sourcing. IFPSM is a non-political, independent and non-profit oriented International Organization. www.ifpsm.org
If you prefer not to receive news releases from IHS Markit, please email Joanna.Vickers@ihsmarkit.com.
To read our (IHS Markit) privacy policy, click here.
The intellectual property rights to the Global Manufacturing PMI™ provided herein are owned by or licensed to IHS Markit. Any unauthorised use, including but not limited to copying, distributing, transmitting or otherwise of any data appearing is not permitted without IHS Markit’s prior consent. IHS Markit shall not have any liability, duty or obligation for or relating to the content or information (“data”) contained herein, any errors, inaccuracies, omissions or delays in the data, or for any actions taken in reliance thereon. In no event shall IHS Markit be liable for any special, incidental, or consequential damages, arising out of the use of the data. Purchasing Managers' Index™ and PMI™ are either registered trade marks of Markit Economics Limited or licensed to Markit Economics Limited. IHS Markit is a registered trademark of IHS Markit Ltd. and/or its affiliates.
Confidential | Copyright © 2019 IHS Markit Ltd |
Page 3 of 3 |
http://new.guap.ru/i04/contacts |
|
vk.com/id446425943
News Release
MARKET SENSITIVE INFORMATION
EMBARGOED UNTIL: 1100 (New York) / 1600 (UTC) February 5th 2019
J.P.Morgan Global Services PMI™
Produced by J.P.Morgan and IHS Markit in association with ISM and IFPSM
Global services output growth eases to 28-month low in January
The start of 2019 saw a further slowing in the rate of expansion of global service sector output. The J.P.Morgan Global Services Business Activity Index – a composite index produced by J.P.Morgan and IHS Markit in association with ISM and IFPSM – fell to a 28-month low of 52.6 in January, down from 53.0 in December.
Please note that the back histories of the Global Services PMI time series have been updated to reflect the annual review of the national weights applied to the data.
The consumer services sector was the main drag on the global aggregate, as business activity contracted for the first time since August 2016. There was also a marked slowdown in the rate of output growth at financial services providers to a four-year low. The business services sector was the brightest spot, being the only sub-industry covered to register a faster pace of expansion.
January saw output growth ease (on average) in both developed and emerging nations, slipping to 28and three-month lows respectively. Service sector activity increased in all except two (France and Italy) nations. The US remained one of the strongest performers, despite seeing its rate of expansion slow slightly. China also saw a solid (albeit slower) increase in output. Rates of expansion were below the global average in the euro area, Japan, the UK, Australia, India and Brazil.
January saw global service sector new business rise to the weakest extent since September 2016. There was also a slight decrease in new export orders. Slower upturns in output and new work were reflected in the labour market, with the rate of job creation slipping to a 21-month low. Employment rose in the US, the euro area, China, Japan, India, Australia and Russia. In contrast, cuts were seen in the UK, Brazil and Italy.
Service providers maintained a positive outlook for the year ahead at the start of 2019, with business optimism improving to a three-month high. The news of the price front was mixed, with January seeing an acceleration of output charge inflation and a slower rate of increase in average costs.
Commenting on the survey, David Hensley, Director of Global Economic Coordination at J.P.Morgan, said:
“Output growth in the global service sector slowed further in January, as the rate of expansion in new business dipped to a 28-month low. This filtered through to the jobs market, with service sector staffing rising at the weakest pace since April 2017. There may be better news on the horizon, however, as companies’ improved outlook for the coming year may be an early sign that the slowdown is nearing its end.”
Service sector business activity
DI, sa
60 |
|
|
|
|
|
|
|
|
55 |
|
|
|
|
|
|
|
|
50 |
|
|
|
|
|
|
|
|
45 |
|
|
|
|
|
|
|
|
2011 |
2012 |
2013 |
2014 |
2015 |
2016 |
2017 |
2018 |
2019 |
JPMorgan Global PMI Sectors: Services Business Activity
DI, sa
60 |
|
Financial Services |
Business Services |
|
||||
|
|
(thin, dark line) |
(thick, dark line) |
|
||||
55 |
|
|
|
|
|
|
|
|
50 |
|
|
|
|
|
|
|
|
|
|
|
Consumer Services |
|
|
|
||
|
|
|
(thin, light line) |
|
|
|
||
45 |
|
|
|
|
|
|
|
|
2011 |
2012 |
2013 |
2014 |
2015 |
2016 |
2017 |
2018 |
2019 |
Global Services PMI™ Summary
50 = no change on prior month.
Index |
Dec. |
Jan. |
+/– |
Summary |
Output/Activity |
53.0 |
52.6 |
– |
Growth, slower rate |
New Business |
53.1 |
52.5 |
– |
Growth, slower rate |
New Export Business |
50.1 |
49.8 |
– |
Falling, from rising |
Backlogs of Work |
49.7 |
50.0 |
+ |
Unchanged, from falling |
Input Prices |
55.8 |
54.9 |
– |
Rising, slower rate |
Output Charges |
52.4 |
52.6 |
+ |
Rising, faster rate |
Employment |
52.3 |
51.9 |
– |
Rising, slower rate |
Future Activity |
62.1 |
63.1 |
+ |
Positive, greater extent |
Confidential | Copyright © 2019 IHS Markit Ltd |
Page 1 of 3 |
http://new.guap.ru/i04/contacts |
|

vk.com/id446425943
Contact Information: |
|
|
For economics comments, data and technical queries please call: |
|
|
IHS Markit |
IHS Markit Press Office |
J.P.Morgan Chase Bank |
Rob Dobson |
Joanna Vickers |
David Hensley |
Director |
Corporate Communications |
Director of Global Economics |
Telephone: +44-1491-461-095 |
Telephone: +44-207-260-2234 |
Coordination |
|
|
Telephone: +1-212-834-5516 |
Email: rob.dobson@ihsmarkit.com |
Email: joanna.vickers@ihsmarkit.com |
Email: david.hensley@jpmorgan.com |
Notes to Editors:
The Global Report on Services is based on the results of surveys covering over 7,000 executives carried out in the US by IHS Markit (after September 2009) and the ISM (before October 2009), and in China, Japan, Germany, France, the UK, India, Brazil, Italy, Russia, Spain, Australia, Saudi Arabia, Nigeria, South Africa, the UAE, Ireland, Singapore, Hong Kong, Egypt, Kenya and Lebanon by IHS Markit, and in New Zealand by Business NZ. These countries together account for an estimated 76% of global service sector gross value added (GVA)2.
For the US, data are taken from a combination of the IHS Markit US Services PMI™ and the ISM non-manufacturing survey. Global services PMI data points after September 2009 include data from the IHS Markit US services PMI survey in the calculation. For global services PMI data prior to October 2009, the calculation is based on data taken from the ISM nonmanufacturing survey. Where appropriate, month-on-month changes in the ISM data series have been applied to the IHS Markit series to form a proxy back history.
In addition to the service sector included in the other countries, the ISM non-manufacturing definition also includes agriculture, construction, mining, public administration, retail, utilities and wholesale sectors.
Questions are asked about real events and are not opinion based. Data are presented in the form of diffusion indices, where an index reading above 50.0 indicates an increase in the variable since the previous month and below 50.0 a decrease.
The services report is accompanied by a Global Report on Manufacturing and a Global Composite PMI™ Report.
Data Sources:
|
% Share of |
|
|
|
Country |
global GDP2 |
Producer |
In association with |
Website |
United States1: |
21.6% |
|
|
|
After Sep. 2009 |
|
IHS Markit |
– |
www.ihsmarkit.com/products/pmi.html |
Before Oct. 2009 |
|
ISM |
– |
www.ism.ws |
China |
12.7% |
IHS Markit |
Caixin |
www.caixin.com |
Japan |
7.7% |
IHS Markit |
Nikkei |
www.nikkei.co.jp/nikkeiinfo/en/ |
Germany |
4.8% |
IHS Markit |
– |
www.ihsmarkit.com/products/pmi.html |
France |
3.6% |
IHS Markit |
– |
www.ihsmarkit.com/products/pmi.html |
United Kingdom |
3.5% |
IHS Markit |
CIPS |
www.cips.org |
India |
3.3% |
IHS Markit |
Nikkei |
www.nikkei.co.jp/nikkeiinfo/en/ |
Brazil |
2.8% |
IHS Markit |
– |
www.ihsmarkit.com/products/pmi.html |
Italy |
2.6% |
IHS Markit |
– |
www.ihsmarkit.com/products/pmi.html |
Russia |
2.1% |
IHS Markit |
– |
www.ihsmarkit.com/products/pmi.html |
Spain |
1.9% |
IHS Markit |
AERCE |
www.aerce.org |
Australia |
1.7% |
IHS Markit |
Commonwealth Bank |
www.commbank.com.au |
Saudi Arabia3 |
0.9% |
IHS Markit |
Emirates NBD |
www.emiratesnbd.com |
Nigeria3 |
0.6% |
IHS Markit |
Stanbic IBTC Bank |
www.stanbicibtcbank.com/ |
South Africa3 |
0.5% |
IHS Markit |
– |
www.ihsmarkit.com/products/pmi.html |
UAE3 |
0.5% |
IHS Markit |
Emirates NBD |
www.emiratesnbd.com |
Ireland |
0.4% |
IHS Markit |
– |
www.ihsmarkit.com/products/pmi.html |
Singapore3 |
0.4% |
IHS Markit |
Nikkei |
www.nikkei.co.jp/nikkeiinfo/en/ |
Hong Kong3 |
0.4% |
IHS Markit |
Nikkei |
www.nikkei.co.jp/nikkeiinfo/en/ |
Egypt3 |
0.3% |
IHS Markit |
Emirates NBD |
www.emiratesnbd.com |
New Zealand |
0.2% |
Business NZ |
Bank of New Zealand |
www.businessnz.org.nz, www.bnz.co.nz |
Kenya3 |
0.1% |
IHS Markit |
Stanbic Bank |
www.stanbicbank.co.ke |
Lebanon3 |
0.1% |
IHS Markit |
BLOMINVEST Bank |
www.blominvestbank.com |
1Data from the IHS Markit survey of US services are included in the global services PMI composition from October 2009 onwards (including the October 2009 data point). Data prior to that date are based on the ISM US non-manufacturing survey.
2Source: World Bank World Development Indicators (2017 data, constant US$ measure).
3For these nations, service sector responses are extracted from whole economy PMI surveys for inclusion in the Global Services PMI.
Confidential | Copyright © 2019 IHS Markit Ltd |
Page 2 of 3 |
http://new.guap.ru/i04/contacts |
|
vk.com/id446425943
Methodology: Global Services PMI™ Indices
The Global Services PMI™ indices are all seasonally adjusted. The seasonal adjustment is applied at the national level (as opposed to at the global aggregate level) in order to account for differing seasonal patterns in each of the nations included. Global Services PMI™ indices are weighted according to national contributions to global services gross value added. Weights for the global indices are derived from the latest available World Bank data on the gross value added of services for each of the nations covered. World Bank data on value added are in constant US$, with all national currencies converted to US$ by the World Bank using DEC alternative conversion factors.
JPMorgan Chase & Co.
JPMorgan Chase & Co. (NYSE: JPM) is a leading global financial services firm with assets of $2.3 trillion and operations in more than 60 countries. The firm is a leader in investment banking, financial services for consumers, small business and commercial banking, financial transaction processing, asset management and private equity. A component of the Dow Jones Industrial Average, JPMorgan Chase & Co. serves millions of consumers in the United States and many of the world's most prominent corporate, institutional and government clients under its J.P. Morgan and Chase brands. Information about JPMorgan Chase & Co. is available at www.jpmorganchase.com.
IHS Markit
IHS Markit (Nasdaq: INFO) is a world leader in critical information, analytics and solutions for the major industries and markets that drive economies worldwide. The company delivers next-generation information, analytics and solutions to customers in business, finance and government, improving their operational efficiency and providing deep insights that lead to well-informed, confident decisions. IHS Markit has more than 50,000 business and government customers, including 80 percent of the Fortune Global
500 and the world’s leading financial institutions. www.ihsmarkit.com
IHS Markit is a registered trademark of IHS Markit Ltd. and/or its affiliates. All other company and product names may be trademarks of their respective owners.
© 2019 IHS Markit Ltd. All rights reserved.
Institute for Supply Management™ (ISM)
Institute for Supply Management® (ISM®) serves supply management professionals in more than 90 countries. Its 50,000 members around the world manage about US$1 trillion in corporate and government supply chain procurement annually. Founded in 1915 as the first supply management institute in the world, ISM is committed to advancing the practice of supply management to drive value and competitive advantage for its members, contributing to a prosperous and sustainable world. ISM leads the profession through the ISM Report On Business®, its highly regarded certification programs and the ISM Mastery Model®. www.instituteforsupplymanagement.org
International Federation of Purchasing and Supply Management (IFPSM)
The International Federation of Purchasing and Supply Management (IFPSM) is the union of 48 National and Regional Purchasing Associations worldwide. Within this circle, about 250,000 Purchasing Professionals can be reached. IFPSM facilitates the development and distribution of knowledge to elevate and advance the procurement profession, thus favourably impacting the standard of living of citizens worldwide through improved business practices. The term procurement is taken to embrace purchasing, materials management, logistics, supply chain management and strategic sourcing. IFPSM is a non-political, independent and non-profit oriented International Organization. www.ifpsm.org
If you prefer not to receive news releases from IHS Markit, please email Joanna.Vickers@ihsmarkit.com.
To read our (IHS Markit) privacy policy, click here.
The intellectual property rights to the Global Services PMI™ provided herein are owned by or licensed to IHS Markit. Any unauthorised use, including but not limited to copying, distributing, transmitting or otherwise of any data appearing is not permitted without IHS Markit’s prior consent. IHS Markit shall not have any liability, duty or obligation for or relating to the content or information (“data”) contained herein, any errors, inaccuracies, omissions or delays in the data, or for any actions taken in reliance thereon. In no event shall IHS Markit be liable for any special, incidental, or consequential damages, arising out of the use of the data. Purchasing Managers' Index™ and PMI™ are either registered trade marks of Markit Economics Limited or licensed to Markit Economics Limited. IHS Markit is a registered trademark of IHS Markit Ltd. and/or its affiliates.
Confidential | Copyright © 2019 IHS Markit Ltd |
Page 3 of 3 |
http://new.guap.ru/i04/contacts |
|

vk.com/id446425943
Metals & Mining
Results book – 2H18
This report contains a reporting schedule and results previews for the metals & mining companies under our coverage with a reporting period of December 2018.
Our neutral view on the miners
We believe the capital cycle favours rising medium-term returns for diversified miners as companies are not investing enough to maintain production over the medium-to- longer term. Management teams continue to focus on value-creation, rather than volume growth, which has been value-destructive historically. Efficiency and productivity enhancements and a recovery in commodity prices have resulted in strong cash-flow generation. Most balance sheets are now comfortable, in our view, and we forecast attractive dividends. However, we are cautious about a potential near-term economic slowdown and the negative impact it may have on commodity demand.
Expected key reporting trends in 2H18
We believe ‘value over volume’ will continue to be a key theme this reporting season. We forecast 8% YoY earnings growth for the sector in 2H18, despite volumes remaining flat, helped by weaker producer currencies and efficiency gains. We forecast a 17% decline in net debt due to strong FCF generation. We believe cash returns to shareholders may continue to improve due to comfortable balance sheets and strong cash generation; we forecast a 50% increase in dividends YoY. However, we forecast a 32% increase in capex from last year’s depressed base, to bring capex closer to the levels required to maintain production over the long term.
Minor earnings revisions
Figures 4 and 5 summarise changes to our earnings forecasts as we incorporate recently reported financial and production results and guidance changes. Our TPs and ratings are unchanged.
Key risks to our investment stance
Key risks to our investment stance include: 1) weaker-than-forecast commodity prices; 2) stronger-than-forecast producer currencies; 3) resumption of valuedestructive growth capex; 4) adverse regulatory changes in countries where the miners operate, which could erode FCF; and 5) sanctions. Conversely, if any of these key factors are more positive than we forecast, there could be upside risk to our earnings forecasts and valuations.
Sector update
Equity Research 6 February 2019
Metals & Mining Global
Johann Pretorius +27 (11) 750 1450
JPretorius2@rencap.com
Steven Friedman +27 (11) 750 1481
SFriedman@rencap.com
Kabelo Moshesha +27 (11) 750 1472
KMoshesha@rencap.com
Siphelele Mhlongo +27 (11) 750 1420
SMhlongo@rencap.com
Derick Deale
+27 (11) 750 1458 DDeale@rencap.com
Summary sector ratings and TPs (ranked by total potential 12M return, including estimated dividends)
Company |
TP |
Current |
Rating |
|
price* |
||||
|
|
|
||
Rusal, HKD |
6.0 |
3.3 |
BUY |
|
Evraz, GBp |
640.0 |
507.6 |
BUY |
|
PhosAgro, $ |
16.0 |
13.5 |
BUY |
|
Norilsk, $ |
24.0 |
20.8 |
BUY |
|
NLMK, $ |
27.0 |
24.0 |
BUY |
|
MMK, $ |
10.1 |
8.6 |
BUY |
|
Alrosa, RUB |
109.0 |
99.5 |
BUY |
|
Polyus, RUB |
6,300.0 |
5,521.5 |
BUY |
|
Rio Tinto, GBP |
48.0 |
42.3 |
BUY |
|
Exxaro, ZAR |
170.0 |
156.5 |
BUY |
|
ARM, ZAR |
160.0 |
147.3 |
BUY |
|
Impala, ZAR |
45.0 |
38.8 |
BUY |
|
AMSA, ZAR |
4.0 |
3.5 |
HOLD |
|
South32, ZAR |
37.0 |
33.9 |
HOLD |
|
BHP, ZAR |
315.0 |
297.3 |
HOLD |
|
Fortescue, AUD |
6.0 |
5.8 |
BUY |
|
Glencore, ZAR |
55.0 |
53.1 |
HOLD |
|
Vale, $ |
13.6 |
12.6 |
HOLD |
|
Polymetal, GBP |
8.6 |
8.6 |
HOLD |
|
Acron, RUB |
4,600.0 |
4,670.0 |
HOLD |
|
Anglo, ZAR |
340.0 |
345.2 |
HOLD |
|
Assore, ZAR |
320.0 |
346.8 |
HOLD |
|
Sibanye, ZAR |
11.1 |
12.1 |
HOLD |
|
Kumba, ZAR |
270.0 |
340.6 |
SELL |
|
RBPlats, ZAR |
25.0 |
28.8 |
SELL |
|
Amplats, ZAR |
540.0 |
636.0 |
HOLD |
|
Gold Fields, ZAR |
43.0 |
53.8 |
SELL |
|
Northam, ZAR |
40.0 |
48.5 |
SELL |
|
Harmony, ZAR |
21.0 |
26.9 |
SELL |
|
Lonmin, ZAR |
7.0 |
9.6 |
SELL |
|
AngloGold, ZAR |
110.0 |
190.0 |
SELL |
Note: Priced at market close on 1 February 2019.
Source: Thomson Reuters Datastream, Renaissance Capital estimates
Important disclosures are found at the Disclosures Appendix. Communicated by Renaissance Securities (Cyprus) Limited, regulated by the Cyprus Securities & Exchange
Commission, which together with non-US affiliates operates outside of the USA under the brand name of Renaissance Capital.
http://new.guap.ru/i04/contacts