

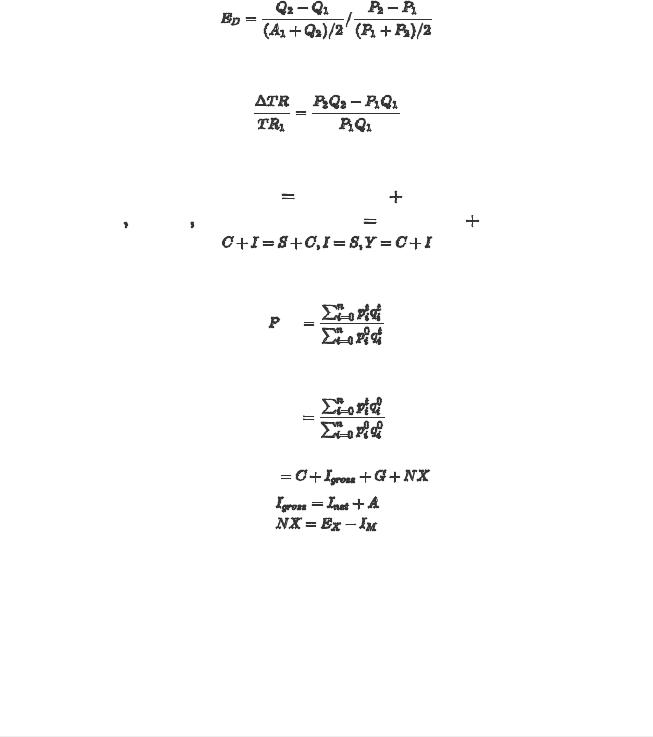
Изменение выручки фирмы в процентном выражении
Равенство доходов и расходов
Дефлятор ВВП
Индекс потребительских цен
ВНП = ВНП + ЧДФ ЧВП = ВВП - А ЧНП = ВНП - А НД = ЧНД - косвенные налоги ЛД = НД - Взносы на соц страхование - Налог на прибыль корпорации - Нераспределенная прибыль корпораций + Трансферты + Проценты, выплаченные государством по ценным бумагам - Проценты, выплаченные домохозяйствами = НД - Взносы на соц страхование - прибыль корпораций + Дивиденды + Трансферты + Проценты, выплаченные государством по ценным бумагам - Проценты, выплаченные домохозяйством
Основные графики
Production Possibilities Curve (ppc) |
Кривая производственных возмножностей |
|
|
|
|
|
|
|
|
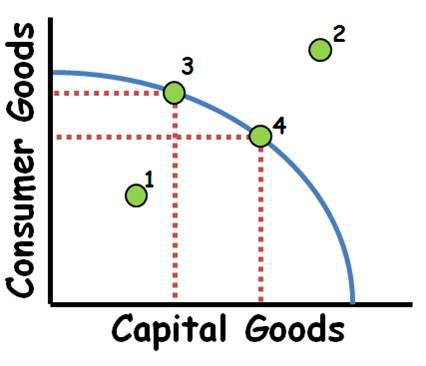
Production Possibilities Fr ontier/Curve
1. Ine cient use of resources, but it is possible to produce at this point.
2.Scarcity prevents this level of production without new resources. (trade may also make this point possible). 3 to 4 Increasing opportunity costs if PPC is concave. This is due to resources not being equally adaptable both products. For constant costs the PPC will be a straight line. •Increases in the quality or quantity of resources as well as technological improvements will shift the PPC outward. •Decreases in the quality or quantity of resources will shift the PPC inward.
Supply and Demand Shifts
Single Shifts •Demand ↑=P ↑ Q ↑: Point 1 to 2 •Demand ↓=P ↓ Q ↓: Point 1 to 8 •Supply ↑= P↓ Q↑: Point 1 to 6 •Supply ↓= P ↑ Q↓:Point 1 to 5 Double Shifts •When 1 axis shows an increase then decrease with each shift, that axis is indeterminate. •Demand ↓ Supply ↓ P Indeterminate Q ↓:Point 1 to 8 to 7. •Demand ↑ Supply ↑ P Indeterminate Q ↑: Point 1 to 2 to 4. •Demand ↑ Supply ↓ P ↑ Q Indeterminate: Point 1 to 2 to 3. •Demand ↓ Supply ↑ P ↓ Q Indeterminate: Point 1 to 8 to 9
Producer/Consumer Surplus
•Consumer surplus is the di erence between what consumers are willing to pay (the demand curve) and the price they actually pay. It is found by taking the price consumers pay from the y axis straight across to the demand curve or the quantity exchanged (which ever is less), then going up until you hit the demand curve. •Producer surplus is the di erence between the marginal cost of production and the price. It is found by taking the price producers receive from the y axis straight across to the supply curve or the quantity exchanged (which ever is less), then going down until you hit the supply curve. 1.Consumer Surplus
2.Producer Surplus 1+2= Economic Surplus
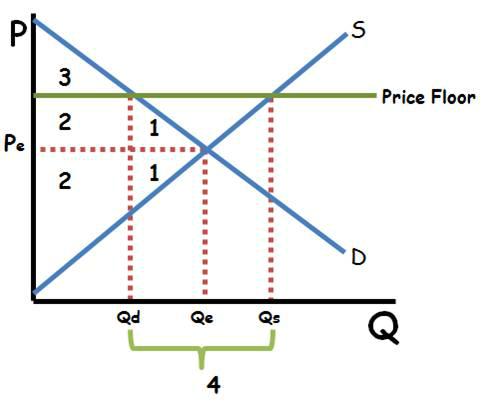
Price Floor
1.Triangle is dead weight loss 2.Producer surplus 3.Consumer Surplus 4.There is a surplus of products in the market (Qs>Qd) •The quantity that actually exchanges hands is Qd (there can be more sold than consumers are willing to buy at the current price.
Price Ceiling
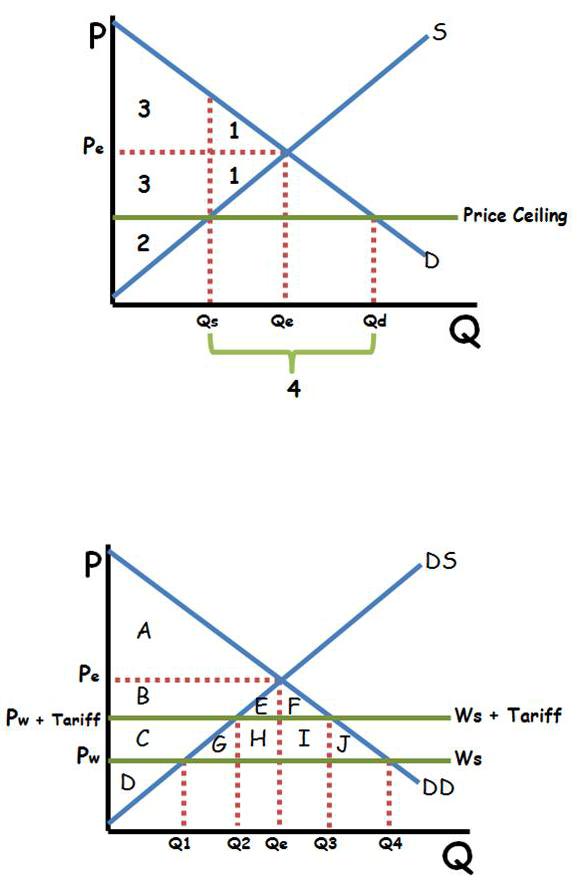
1.Triangle 1 is dead weight loss 2.Producer surplus 3.Consumer Surplus 4.There is a Shortage of products in the market (Qs<Qd) •The quantity that actually exchanges hands is Qs (there can be more sold than producers are willing to sell at the current price.
Per-Unit Tax with
no
Externalities