

2.2.2 Human Geography and Demographics
According to the US Census Bureau, the population estimate for 2005 was 295,734,134 and growing quite quickly, having increased nearly 15 million since 2000. The percentage of females was 50.9 %. Despite the post-war "Baby Boom" that has left most European countries with a high percentage of pensioners today, with the number rapidly increasing, over a quarter of Americans are under 18 as birth rates are still high. Immigration is still significant, with over 11 % of Americans born abroad.
Although many Americans are rich by any standards, 12.4 % live below the "poverty line". In 1999 the average per capita income was $21,587 and the median household income was $41,994.
Many such details may be read and digested on the US Census Bureau website, http://quickfacts.census.gov/qfd/states/00000.htrnl but perhaps the strangest is the fact that in 2000, just under 50m Americans had a registered disability; physical, mental or emotional.
Americans, in part due to categories decided by the U.S. government, generally describe themselves as being one of five ethnic groups:
White, (also called Caucasian); 68.0 %
African American, (also called Black); 12.9 %
Hispanic, (also called Latino); 13.4 %
Asian American and 4.2 %
Native American 1.5 %
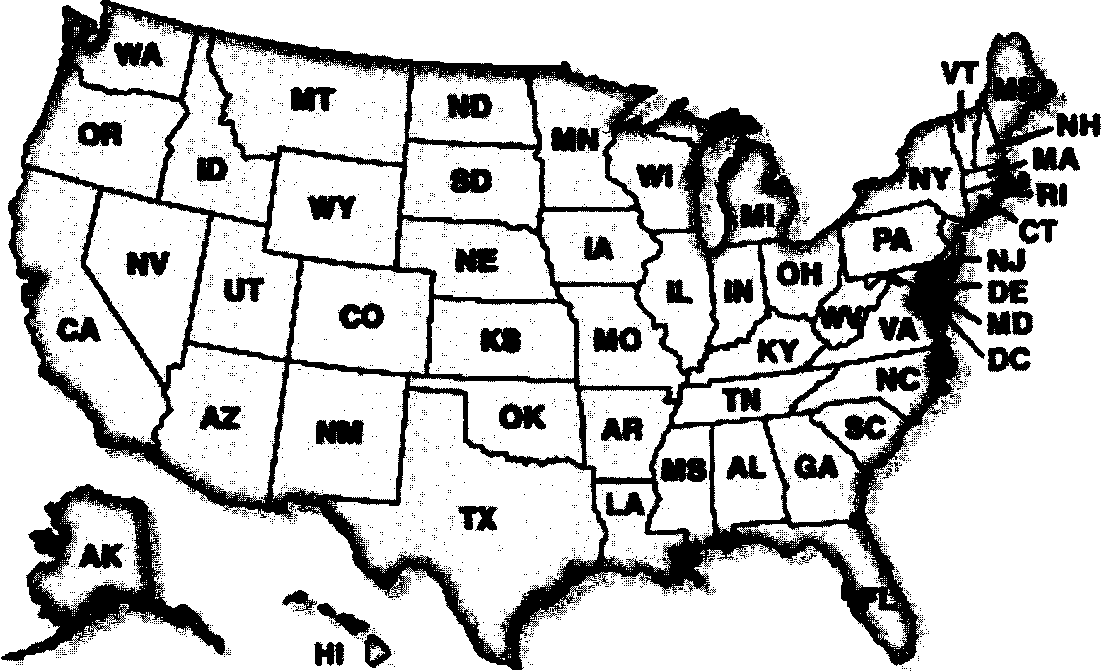
AL Ala. Alabama
AK Alaska Alaska
AZ Ariz. Arizona
AR Ark. Arkansas
CA Calif. California
Montgomery MT Mont.
Juneau NE Neb.
Phoenix NV Nev.
Little Rock NH N.H.
Sacramento NJ N.J.
Montana Helena
Nebraska Lincoln
Nevada Carson City
New Hampshire Concord New Jersey Trenton
NM
N.M. NY N.Y. NC N.C. ND N.D. OH Ohio
Colorado
Connecticut Delaware Florida Georgia
Hawaii
Hawaii
Honolulu
OK Okla. Oklahoma
Ore.
Pa.
R.I.
S.C.
S.D.
Tenn.
Texas
Utah
Vt.
Va.
Wash.
W.Va. Wis. Wyo.
CT Conn.
DE Del.
FL Fla.
HI
ID IL
Idaho 111.
IN Ind. IA Iowa KS Kan. KY Ky. LA La. ME Maine MD Md. MA Mass. MI Mich. MN Minn. MS Miss. MO Mo.
Idaho
Illinois
Indiana
Iowa
Kansas
Kentucky
Louisiana
Maine
Maryland
Massachusetts
Michigan
Minnesota
Mississippi
Missouri
Denver
Hartford
Dover
Tallahassee
OR
PA
RI
SC
SD
TN
Boise
Springfield Indianapolis Des Moines Topeka Frankfort
Baton Rouge TX Augusta UT Annapolis VT Boston VA
Lansing WA Saint Paul WV Jackso WI
Jefferson City WY
New Mexico New York North Carolina North Dakota Ohio
Oregon
Pennsylvania
Rhode Island
South Carolina
South Dakota
Tennessee
Texas
Utah
Vermont
Virginia
Washington
West Virginia
Wisconsin
Wyoming
Santa Fe
Albany
Raleigh
Bismarck
Columbus
Oklahoma
City
Salem
Harrisburg
Providence
Columbia
Pierre
Nashville
Austin
Salt Lake City
Montpelier
Richmond
Olympia
Charleston
Madison
Cheyenne
Much of American culture is strongly contrasted to Canadian culture. A key example is that Canadians see their country as a mosaic of unique immigrant cultures, a large picture made up of many distinct pieces, rather than a melting-pot, in the way that American like to describe their society and culture. The USA heavily stresses that its immigrants fuse their various cultural identities together in this 'melting pot', rather than retain ethnic groups with their own clear identities. Obviously this will not always be the case and many anthropologists and sociologists have invented theories that modify the official view to offer a compromise that is nearer to reality. Two of these many theories are the "salad bowl" culture theory and the "pizza" culture theory.