

11 ALGEBRA
.pdfEXAMPLE |
66 |
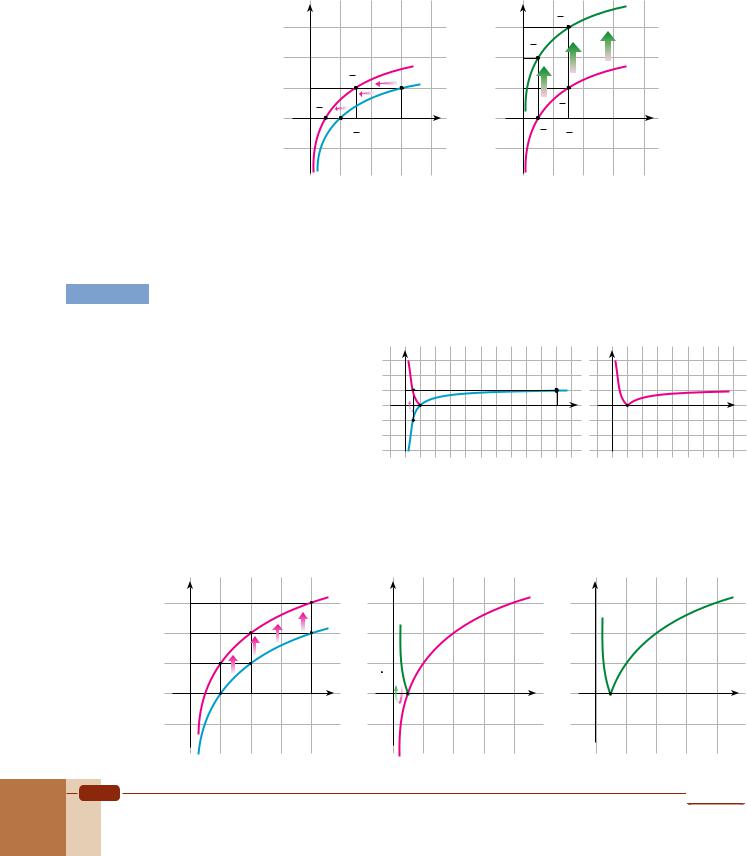
Sketch the graph y = log2(2 – x) and determine its domain, range and asymptote. |
|
Solution 1 We begin by sketching the basic function f(x) = log2 x, then reflect it in the y-axis as the
graph of g(x) = log2(–x). Since h(x) = log2(2 – x) = log2[–(x – 2)] = g(x – 2), we sketch y = g(x – 2) = log2(2 – x) by shifting the graph of g(x) two units to the right.
|
|
|
|
y |
|
|
|
|
g(x) = log2 |
(–x) |
|
|
|
f(x) = log2 |
x |
||
|
|
|
|
2 |
|
|
|
|
|
|
|
|
1 |
|
|
|
|
-4 |
-3 |
-2 |
-1 |
0 |
1 |
2 |
3 |
4 x |
|
|
|
|
-1 |
|
|
|
|
y |
x = 2 |
|
y = log2 (2 – x)
|
|
|
|
2 |
|
|
|
|
|
|
|
|
|
|
|
g(x) = log2 |
(–x) |
1 |
|
x |
|||
|
|
|
|
|
|
||
|
|
|
|
|
|
|
|
-4 |
-3 |
-2 |
-1 0 |
1 |
2 |
|
|
|
|
|
|
-1 |
|
|
|
As we can see in the final graph, the domain of h(x) = log2(2 – x) is (– , 2), the range is , and the graph has a vertical asymptote at x = 2.
Solution 2
EXAMPLE 67
We can write the function as y = log2[–(x – 2)] and then |
|
|
|
y |
|
x = 2 |
||||||
|
|
|
|
|||||||||
|
|
|
|
|||||||||
identify a = 2, c = 1, d = –1, p = –2 and k = 0. So two points |
|
|
|
|
|
|
|
|||||
|
|
|
2 |
|
|
|
||||||
on the graph are |
|
|
|
|
|
|
|
|||||
1 |
|
1 |
|
|
|
|
|
|
1 |
|
|
|
|
|
|
y = |
log2 (2 – x) |
|
x |
||||||
( d |
– p, k)=( –1 – (–2), 0)=(1, 0) and |
|
||||||||||
|
- |
2 -1 0 |
1 |
2 |
|
|||||||
|
|
|
|
|
|
|
||||||
a |
2 |
|
|
|
-1 |
|
|
|
||||
( d – p, c+ k)=( |
|
– (–2), 1+0)=(0, 1). |
|
|
|
|
|
|||||
–1 |
|
|
|
|
|
|
|
|||||
Using x = –p = 2 as the vertical asymptote, we draw the |
|
|
|
|
|
|
|
|||||
|
|
|
|
|
|
|
||||||
|
|
|
|
|
|
|
|
|
|
|
|
|
graph opposite. The domain of the function is (– , 2), the range is , and the graph has a vertical asymptote at x = 2.
Sketch the graph of f(x) = log3(2x) + 2.
Solution After sketching the graph of g(x) = log3 x, we shrink it by a factor of 21 to get the graph of h(x) = log3(2x) (can you see why?). Then we apply a vertical shift 2 units upward to obtain the graph of f(x) = log3(2x) + 2.
Exponential and Logarithmic Functions |
179 |
|
y |
|
|
|
|
3 |
|
|
|
|
|
2 |
|
|
h(x) = log3 (2x) |
||
|
|
( 3,1) |
|
|
|
1 |
|
2 |
|
|
|
|
|
|
(3,1) |
||
|
( 1,0) |
|
|
||
|
|
g(x) = log |
x |
||
|
2 |
|
|
3 |
|
0 |
1 |
3 |
2 |
3 |
x |
-1 |
|
2 |
|
|
|
|
|
|
|
|
|
|
y |
( 3,3) |
|
|
|
|
3 |
|
2 |
f(x) = log3 |
(2x)+2 |
||
( 1,2) |
|
|
||||
|
|
|
|
|
|
|
2 |
2 |
|
|
|
|
|
1 |
|
|
3,1) |
h(x) = log3 (2x) |
||
|
|
( |
|
|
|
|
|
|
|
2 |
|
|
|
0 |
( 1,0) |
3 |
2 |
3 |
x |
|
|
2 |
|
2 |
|
|
|
-1 |
|
|
|
|
|
|
|
|
|
|
|
|
|
EXAMPLE 68 Sketch each graph. |
|
a. y = |log x| |
b. y = |log2 x + 1| |
Solution a. We begin by sketching the graph of f(x) = log x, then we reflect the part of the curve below the x-axis in the x-axis. The result is the graph y = |log x|.
|
y |
|
|
|
|
|
|
|
|
2 |
|
|
|
|
|
|
|
|
|
1 |
|
|
|
|
|
|
|
|
x |
|
|
|
|
|
|
|
|
|
|
-1 |
1 |
2 |
3 |
4 |
5 |
6 |
7 |
8 |
9 10 |
|
|
|
|
|
|
|
|
|
|
-2 |
f(x) = log x |
|
|
|
|
|
|||
|
|
|
|
|
|
||||
|
y |
|
|
|
|
|
|
2 |
|
|
f(x) = |log x| |
||||
1 |
|
|
|||||
|
|
|
|
|
|
x |
|
|
|
|
|
|
|
|
|
-1 |
1 |
2 |
3 |
4 |
5 |
6 |
7 |
|
|
|
|
|
|
|
|
-2 |
|
|
|
|
|
|
|
b.Step 1: Graph f(x) = log2 x.
Step 2: Shift the graph 1 unit upward to obtain g(x) = log2 x + 1.
Step 3: Reflect the part of the curve below the x-axis in the x-axis to get y = |log2 x + 1|.
y |
|
|
g(x) = log2 x+1 |
|
3 |
|
|
|
|
2 |
|
|
|
|
1 |
|
|
f(x) = log2 x |
|
|
|
|
|
|
0 |
1 |
2 |
3 |
4 x |
-1 |
|
|
|
|
y |
|
|
|
g(x) = log2 x+1 |
||
3 |
|
|
|
|
|
|
2 |
|
|
|
|
|
|
1 |
|
|
|
|
|
|
0 |
1 |
1 |
2 |
3 |
4 |
x |
-1 |
2 |
|
|
|
|
|
|
|
|
|
|
|
|
y |
|
|
|
|
|
|
3 |
|
|
|
|
|
|
2 |
|
|
|
|
|
|
1 |
|
|
y = |log2 x+1| |
|
||
|
|
|
|
|
|
|
0 |
1 |
1 |
2 |
3 |
4 |
x |
-1 |
2 |
|
|
|
|
|
|
|
|
|
|
|
|
180 |
Algebra 11 |
EXAMPLE 69
Solution
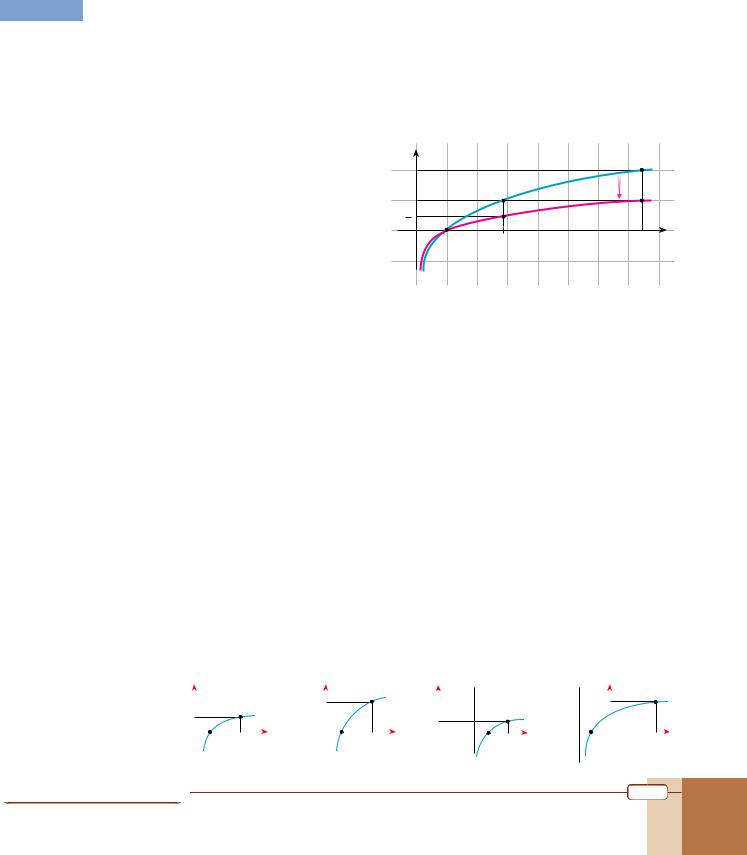
Sketch the graph y = ln ñx.
Since y = ln ñx is equivalent to y = 21 ln x, we can obtain the graph by shrinking the graph of f(x)=lnx towards the x-axis.
Since c = 21 and the points (1, 0), (e, 1) and (e2, 2) are all on the graph of f(x) = ln x, the
points (1, 0 21), (e, 1 21) and ( e2, 2 21) will be on the graph of f (x)= 21 ln x.
By plotting these points and joining them with a smooth curve, we obtain the graph shown opposite.
y |
|
|
|
|
|
|
|
2 |
|
f(x) = ln x |
|
|
|
|
|
|
|
|
|
|
|
||
1 |
|
|
|
|
|
|
|
1 |
|
|
|
y = ln ñx |
|
|
|
2 |
|
|
|
|
|
|
|
1 |
2 |
e 3 |
4 |
5 |
6 |
7 e2 |
x |
Check Yourself 13
1. |
Sketch each graph by translating the graph of a simple logarithmic function. |
|
|
|
|||||||||||||||||||||
|
a. y = log2 x – 3 |
|
|
|
|
|
|
|
|
|
b. |
y = 2+ log 1 x |
|
|
|
|
|
||||||||
2. |
Sketch each graph. |
|
|
|
|
|
|
|
|
3 |
|
|
|
|
|
|
|||||||||
|
|
|
|
|
|
|
|
|
|
|
|
|
|
|
|
|
|||||||||
|
a. |
y = log 1 (x – 2) |
|
|
|
|
|
|
|
|
|
b. y = log(x + 2) |
|
|
|
|
|
||||||||
3. |
|
3 |
|
|
|
|
|
|
|
|
|
|
|
|
|
|
|
|
|
|
|
|
|
||
Graph each function and determine its domain, range and asymptote. |
|
|
|
||||||||||||||||||||||
|
a. f(x) = log2(–x) |
|
|
b. |
f (x)= log 1 x |
c. f(x) = –|log x| |
d. f(x) = ln |x – 1| |
|
|
||||||||||||||||
|
|
|
|
|
|
|
|
|
|
|
|
|
|
3 |
|
|
|
|
|
|
|
|
|
|
|
4. |
Sketch each graph. |
|
|
|
|
|
|
|
|
|
|
|
|
|
|
|
|
|
|||||||
|
a. y = 3 log |
3 |
x |
|
|
|
|
|
b. y = log x3 |
|
|
|
|
c. y = log x2 – 1 |
|
|
|||||||||
|
|
2 |
|
|
|
|
|
|
|
|
|
|
2 |
|
|
|
|
|
|
|
|
|
|||
|
|
|
|
|
|
|
|
|
|
|
|
|
|
|
|
|
|
|
|
|
|
|
|||
5. |
Graph each function. |
|
|
|
|
|
|
|
|
|
|
|
|
|
|
|
|
||||||||
|
a. |
f (x)= log |
x |
|
b. |
f (x)= log |
|
(2x) |
c. f(x) = 2 ln x – 1 |
d. f(x) = 3 + log(–2x) |
|||||||||||||||
|
|
|
|
|
|
3 2 |
|
|
|
|
|
|
1 |
|
|
|
|
|
|
|
|
|
|
|
|
|
|
|
|
|
|
|
|
|
|
|
|
|
4 |
|
|
|
|
|
|
|
|
|
|
|
|
6. |
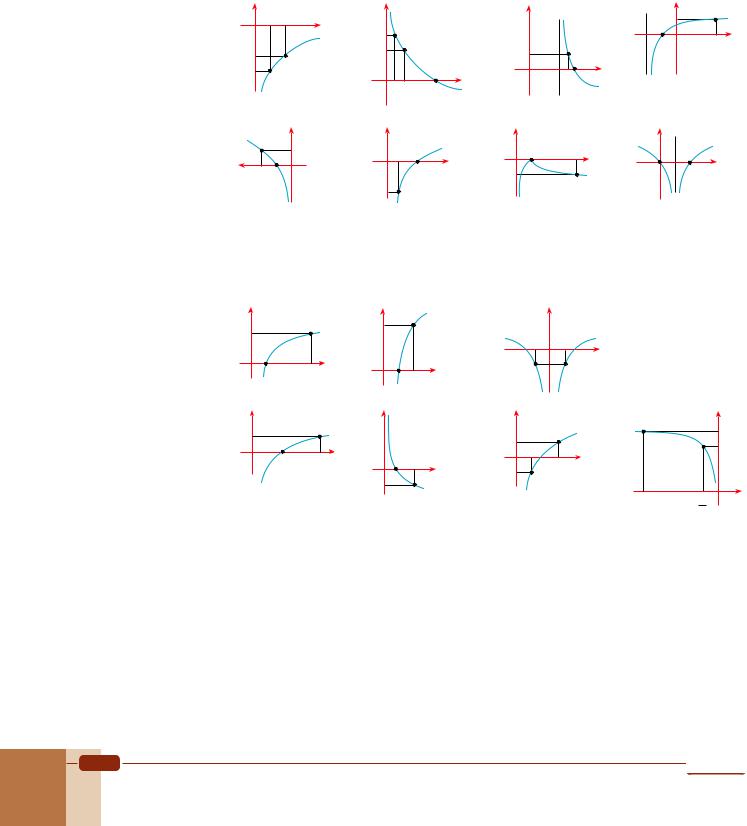
Write the equation of the logarithmic function shown in each graph. |
|
|
|
|||||||||||||||||||||
|
a. |
|
y |
|
|
|
|
|
b. |
1 |
y |
|
|
|
c. |
|
|
y |
d. |
y |
|
|
|||
|
|
|
|
|
|
|
|
|
|
|
|
|
|
|
|
|
|
|
3 |
|
|
|
|||
|
|
1 |
|
|
|
|
|
|
|
|
|
|
|
|
|
1 |
|
|
|
|
|
x |
|||
|
|
|
|
|
|
|
|
|
|
|
|
|
|
|
|
|
|
|
|
|
|
|
|
||
|
|
|
|
|
|
|
|
|
|
|
|
|
|
|
|
|
|
|
|
|
|
|
|
|
|
|
|
|
|
1 |
|
5 |
x |
|
|
|
1 |
|
e x |
|
|
|
7 8 9 x |
-3 -2 |
0 |
5 |
|
||||
|
|
|
|
|
|
|
|
|
|
|
|
|
|
|
|
|
|
|
|
|
|
|
|
|
|
|
|
|
|
|
|
|
|
|
|
|
|
|
|
|
|
|
|
|
|
|
|
|
|
|
|
Exponential and Logarithmic Functions |
181 |
Answers |
|
|
|
|
|
|
|
|
1. a. y |
b. y |
|
|
2. a. y |
|
b. x=–2 |
|
y |
1 2 |
x |
|
|
x=2 |
|
1 |
x |
|
|
3 |
|
|
|
|
|
|
|
|
|
|
|
|
–2 |
–1 |
8 |
|
|
2 |
|
|
1 |
|
|||
-2 |
|
|
|
x |
|
|
||
|
|
|
3 |
|
|
|||
-3 |
|
|
x |
|
|
|
||
|
|
2 |
7 |
|
|
|
||
|
1 |
1 |
9 |
|
3 |
|
|
|
|
|
|
|
|
|
|||
|
3 |
|
|
|
|
|
|
|
3. |
a. |
|
|
y |
|
b. |
y |
|
|
c. |
y |
|
d. |
y |
x=1 |
|
|
|
|
|
|
|
1 |
|
1 |
|
|
|
|
1 |
10 |
|
1 |
|
|
|
|
|
|
-1 |
|
3 |
|
|
|
|
|
|
|
||||
|
|
|
|
|
|
|
x |
|
|
|
x |
0 |
|
|
|||
|
|
|
-2 |
|
|
|
1 |
|
|
|
|
2 |
x |
||||
|
|
x |
|
|
|
|
|
-1 |
|
|
|||||||
|
|
|
|
|
|
|
|
|
|
||||||||
|
|
|
|
|
|
|
-1 |
|
|
|
|
|
|
|
|
|
|
|
|
domain |
|
: (– , 0) |
|
domain |
: (0, ) |
|
domain |
: (0, ) |
domain |
: – {1} |
|||||
|
|
range |
|
: |
|
range |
: |
|
range |
: (– , 0) |
range |
|
: |
|
|||
|
|
asymptote: x = 0 |
|
asymptote: x = 0 |
|
asymptote : x = 0 |
asymptote : x = 1 |
||||||||||
4. |
a. |
y |
|
|
|
b. |
y |
|
|
c. |
|
|
y |
|
|
|
|
|
|
3 |
|
|
|
|
3 |
|
|
|
|
|
|
|
|
|
|
|
|
|
|
|
|
|
|
|
|
|
-1 |
1 |
|
|
|
|
|
|
|
|
|
|
|
|
|
|
|
|
|
|
|
|
|
||
|
|
|
|
|
x |
|
|
|
x |
|
|
|
x |
|
|
|
|
|
|
|
1 |
|
9 |
|
|
|
|
|
|
-1 |
|
|
|
|
|
|
|
|
|
|
1 |
2 |
|
|
|
|
|
|
|
|
|||
|
|
|
|
|
|
|
|
|
|
|
|
|
|
|
|
||
5. |
a. |
y |
|
|
|
b. |
y |
|
|
c. |
|
y |
d. |
|
|
|
y |
|
|
1 |
|
|
|
|
|
|
|
|
1 |
|
|
|
|
|
4 |
|
|
|
|
x |
|
|
|
|
|
1 |
x |
|
|
|
3 |
||
|
|
|
|
|
|
1 |
|
|
|
|
|
|
|||||
|
|
|
|
2 |
6 |
|
2 |
x |
|
|
|
|
|
||||
|
|
|
|
|
2 |
|
-1 |
|
e |
|
|
|
|
||||
|
|
|
|
|
|
|
|
|
|
|
|
|
|
|
|
x |
|
|
|
|
|
|
|
|
-1 |
|
|
|
|
|
|
|
|
|
|
|
|
|
|
|
|
|
|
|
|
|
|
|
|
-5 |
|
– 1 |
|
|
|
|
|
|
|
|
|
|
|
|
|
|
|
|
|
2 |
|
6. a. y = log5 x |
b. y = ln x |
c. y = log2 (x – 7) |
d. y = log2 (x + 3) |
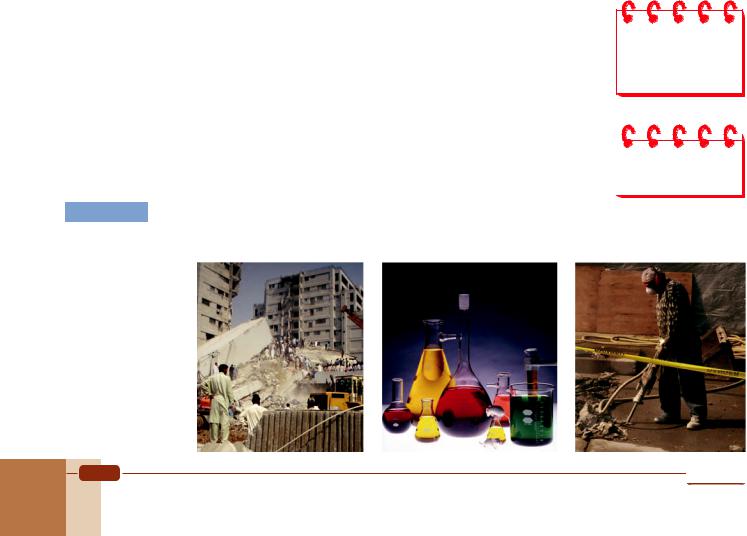
D. APPLICATIONS OF LOGARITHMIC FUNCTIONS
The concept of logarithm is not just an abstract mathematical idea. It has many practical uses. In the past, before the invention of scientific calculators, mathematicians performed complicated calculations by first reducing large numbers to logarithms, and then referring to a table of common logarithms. Although today we rarely use logarithms in this way, they still have many other practical uses in the modern world.
Let us look at some examples.
182 |
Algebra 11 |

Richter |
Earthquake effect |
|
magnitude |
||
|
||
< 3.5 |
Earthquake recorded |
|
but not felt. |
||
|
||
|
Rarely causes damage, |
|
3.5-5.4 |
but felt, especially on |
|
the upper floors of |
||
|
||
|
buildings. |
|
|
|
|
|
Slight damage possible |
|
|
to well-designed |
|
5.5-6.0 |
buildings but can cause |
|
major damage to poorly- |
||
|
||
|
constructed buildings |
|
|
near the epicenter. |
|
|
|
|
|
Destructive in areas up |
|
6.1-6.9 |
to 60 miles from the |
|
|
epicenter. |
|
|
|
|
7.0-7.9 |
Major earthquake causing |
|
serious damage. |
||
|
||
|
|
|
|
A ‘great earthquake’, |
|
> 8.0 |
which can cause severe |
|
damage in areas over |
||
|
||
|
hundreds of miles. |
|
|
|
1. The Richter Scale
The Richter scale is a scale which is used to measure ground movement. It is commonly used to measure the strength of an earthquake: a higher measurement on the Richter scale means a more violent earthquake. The scale is actually a mathematical formula developed in 1935 by the American geologist Charles Richter. The Richter number R of ground movement is given by the formula
R = logn I
I0
where I is the intensity of the earthquake and I0 is the minimum intensity that can be felt (called the reference intensity). Intensity is a measure of the shaking and damage caused by the earthquake, and this value changes from location to location.
EXAMPLE 70
Solution
Remark
The Chilean earthquake of 1960 measured 9.5 on the Richter scale. Compare its intensity with the intensity of the Marmara earthquake of 1999, which measured 7.4 on the Richter scale.
Let I1 and I2 be the intensities of the Chilean and Marmara earthquakes, respectively. Then by the formula we have
|
9.5 = log n |
|
I |
and |
7.4 = log |
I2 |
. |
|
|
||||||
|
|
1 |
|
|
|
|
|||||||||
|
|
I |
I |
|
|
||||||||||
|
|
|
|
|
|
|
|
|
|
|
|
|
|||
|
|
|
0 |
|
|
|
|
|
|
|
0 |
|
|
|
|
Consequently, |
|
|
|
|
|
|
|
|
|
|
|
|
|
||
|
I |
=109.5 |
|
|
|
|
I |
=107.4 |
I |
|
109.5 |
=102.1 |
126. |
||
|
1 |
and |
2 |
1 |
= |
|
|
||||||||
|
I |
|
I |
I |
107.4 |
||||||||||
|
|
|
|
|
|
|
|
|
|
|
|||||
0 |
|
|
|
|
0 |
|
|
2 |
|
|
|
|
|
||
|
1. |
Location |
Date |
Magnitude |
|
|
Chile |
1960 |
9.5 |
|
|
|
2. |
Alaska |
1964 |
9.2 |
|
|
3. |
Andreanof Islands, |
1957 |
9.1 |
|
|
|
Aleutian Islands |
|
|
|
|
4. |
Kamchatka |
1952 |
9.0 |
|
|
5. |
Off western coast of |
2004 |
8.8 |
|
|
|
Sumatra, Indonesia |
|
|
|
|
6. |
Off the coast of |
1906 |
8.7 |
|
|
Ecuador |
|
|||
|
|
|
|
|
|
|
7. |
Rat Islands, |
1955 |
8.7 |
|
|
Aleutian Islands |
|
|||
|
|
|
|
|
|
|
8. |
Northern Sumatra, |
2005 |
8.7 |
|
|
|
Indonesia |
|
|
|
|
9. |
Indo-Chinese border |
1950 |
8.6 |
|
|
10. |
Kamchatka |
1923 |
8.5 |
|
|
|
|
|
|
|
|
|
|
|
|
|
10 biggest earthquakes of the last century
So the Chilean earthquake was 126 times more intense then the Marmara earthquake.
An earthquake of magnitude 7 on the Richter scale is ten times stronger than an earthquake of magnitude 6.
Exponential and Logarithmic Functions |
183 |
Substance |
pH |
|
Battery acid |
<1.0 |
|
Gastric acid |
2.0 |
|
Lemon juice |
2.4 |
|
Cola |
2.5 |
|
Vinegar |
2.9 |
|
Orange or apple juice |
3.5 |
|
Beer |
4.5 |
|
Coffee |
5.0 |
|
Tea |
5.5 |
|
Acid rain |
<5.6 |
|
Human saliva in |
4.5-5.7 |
|
cancer patients |
||
|
||
Milk |
6.5 |
|
Pure water |
7.0 |
|
Human saliva |
6.5-7.4 |
|
Blood |
7.34-7.45 |
|
Sea water |
8.0 |
|
Hand soap |
8.0-10.0 |
|
Household ammonia |
11.5 |
|
Bleach |
12.5 |
|
Household lye |
13.5 |
2. The pH Scale
The pH (potential of hydrogen) scale is used in chemistry to determine the acidity or basicity of a solution. Solutions that are not very acidic are called basic. The pH scale has values ranging from zero (the most acidic) to 14 (the most basic).
As you can see from the table on the left, pure water has a pH value of 7. This value is considered neutral: it is neither acidic nor basic. The pH of pure rain is between 5.0 and 5.5, which is slightly acidic. However, when pure rain is combined with sulfur dioxide or nitrogen oxides produced by power plants and automobiles, the rain becomes much more acidic. Typical acid rain has a pH of 4.0.
A decrease of 1 in pH value means that the acidity of the solution becomes ten times greater. For example, cola (pH 2.5) is ten times more acidic than orange or apple juice (pH 3.5).
The pH scale is actually a logarithm of the form
pH = – log H+
where H+ is the concentration of hydrogen ions in an aqueous solution in moles per liter of the solution.
|
71 |
A solution of hydrochloric acid is 0.2 molar. Find its pH. |
EXAMPLE |
||
|
|
|
Solution Using the formula, pH = –log 0.2 = –(–0.698) = 0.7. |
||
|
72 |
Find the hydrogen concentration in beer if the pH of beer is 4.82. |
EXAMPLE |
||
|
|
|
It is simpler to use numbers (pH 4) than exponents
([H+] = 10–4 M) to describe acidity.
Solution 4.82 = – log [H+]
[H+] = 10–4.82 =1.51 10–5 mol/L
EXAMPLE 73 Calculate the pH of a lemon juice solution which is 5 10–3 molar.
Solution pH = – log(5 10–3) = 3 – log 5 2.3
pH < 7.0 |
acidic |
pH = 7.0 |
neutral |
pH > 7.0 |
basic |
|
|
184 |
Algebra 11 |

The intensity levels of sounds that we can hear vary from very loud to very soft. Here are some examples of the decibel levels of some common sounds.
Source of sound |
dB |
Jet takeoff |
140 |
Jackhammer |
130 |
Rock concert |
120 |
Subway |
100 |
Heavy traffic |
80 |
Ordinary traffic |
70 |
Normal conversation |
50 |
Whisper |
30 |
Rustling leaves |
10-20 |
Threshold of hearing |
0 |
3. The Decibel Scale
The human ear is sensitive to an extremely wide range of sound intensities. The loudest sound a healthy person can hear without damage to the eardrum has an intensity 1 trillion (1012) times the intensity of the softest sound a person can hear.
Sound level is measured in decibels. The sound level of a sound of intensity I (measured in watts per square meter) is defined by
=10 log |
I |
decibels, |
|
I |
|||
|
|
||
|
0 |
|
where I0 = 10–12 watts per square meter is the least intense sound that a human ear can detect.
|
74 Find the sound level of a jet engine during takeoff |
|
||||||||
EXAMPLE |
|
|||||||||
|
if the sound intensity is 100 W/m2. |
|
||||||||
Solution Applying the sound level formula, |
|
|||||||||
|
=10 log 100 |
=10 log1014 =140 dB. |
|
|||||||
|
10–12 |
|
|
|
|
|
|
|
||
|
So the sound level is 140 dB. |
|
||||||||
|
75 Determine the sound level of ordinary traffic if it is known that this sound is 100 times more |
|||||||||
EXAMPLE |
||||||||||
|
intense than the sound level of normal conversation (50 dB). |
|||||||||
Solution The sound level of normal conversation is 50 decibels, so we use the sound level formula |
||||||||||
|
50 =10 log |
I |
|
and get |
log |
I |
= 5. |
|
||
|
I |
|
|
|||||||
|
|
|
|
I |
|
|||||
|
0 |
|
|
0 |
|
|
|
|
||
|
A sound 100 times as intense as I has sound level 100I. Thus the loudness of ordinary traffic |
|||||||||
|
is =10 log 100I =10(log100+ log |
I |
)=10(2+ log |
I) = 10 (2 + 5) = 70 dB. |
||||||
|
|
|||||||||
|
|
|
I |
|
|
|
|
I |
I |
|
|
0 |
0 |
|
0 |
||||||
Check Yourself 14
1.Compare the intensities of the Mexican earthquake of 1985 (7.8 on the Richter scale) and the San Francisco earthquake of 1989 (7.1 on the Richter scale).
2.Find the hydrogen ion concentration [H+] of milk, given that its pH is 6.3.
3.The sound level of a moving subway train measured 98 dB. Find its intensity in W/m2.
Answers |
|
|
1. the Mexican earthquake was 5 times stronger |
2. 5 10–7 mol/L |
3. 6 10–3 W/m2 |
Exponential and Logarithmic Functions |
185 |
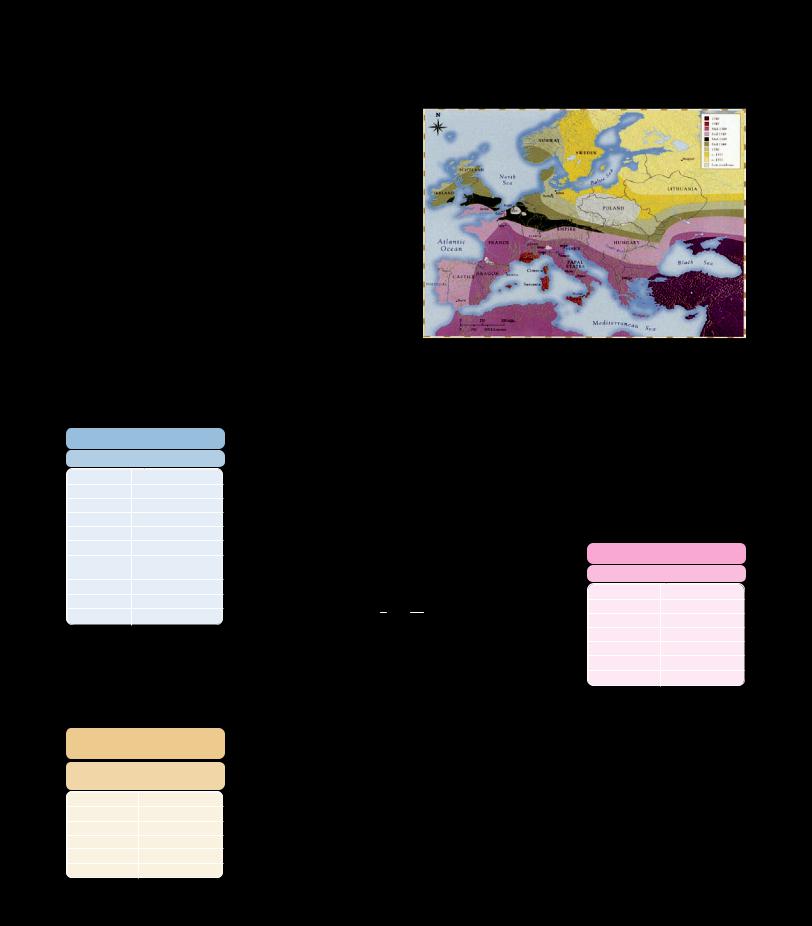
ESTIMATING WORLD POPULATION
Exponential and logarithmic functions are often used by mathematicians to model changes in the real world. One example of such a change is the growth and decline of world population. Mathematicians can use a model to predict the population of our planet at a certain time in the future, or to estimate how different events in history might have affected world population today.
Since the second century, the population of the world has been affected by outbreaks of a disease known as the bubonic plague. During the fourteenth and fifteenth centuries (1348-1405), the greatest bubonic plagues (known as the Black Death) spread in six waves from central Asia through India and North Africa to Europe
and beyond. In these regions, approximately one-third of the population died from the disease. The plague caused a decrease in world population from 470 million people in 1348 to 370 million in 1400.
Estimated World Population
Year |
Population |
|
1200 |
0.35 × 10⁹ |
|
1300 |
0.38 × 10⁹ |
|
1348 |
0.47 × 10⁹ |
|
1400 |
0.37 × 10⁹ |
|
1500 |
0.45 × 10⁹ |
|
1600 |
0.49 × 10⁹ |
|
1700 |
no accurate |
|
estimate available |
||
|
||
1800 |
0.91 × 10⁹ |
|
1900 |
1.60 × 10⁹ |
|
2000 |
6.05 × 10⁹ |
Predicted world population
without Black Death
|
|
Year |
Predicted |
|
|
Population |
|
|
|
|
|
1400 |
0.59 × 10⁹ |
||
1500 |
0.72 × 10⁹ |
||
1600 |
0.78 × 10⁹ |
||
1800 |
1.45 × 10⁹ |
||
|
|
1900 |
2.50 × 10⁹ |
|
|
2000 |
9.45 × 10⁹ |
|
|
|
|
We can use math to investigate what would have happened to world population if the Black Death had not occurred. How many people would there be on Earth now if nobody had died from the disease?
The table on the left shows the estimated world population in the year beginning each century. We can use this information to create a formula which models the
population growth in each century. The formula is P = P0 ert |
where t is the |
||||||
duration of the period, P0 is the initial population of the |
Population Growth Rates |
||||||
period, P is the terminal population of the period and r is |
|||||||
Interval |
|
|
|
||||
the population growth rate. Rewriting this formula in |
|
r |
|
||||
|
|
|
|
||||
1 |
P |
|
1200-1300 |
0.82 |
× 10–3 |
||
|
1300-1348 |
4.40 |
× 10 |
–3 |
|||
terms of r gives us r = t ln P0 |
which is the formula for |
|
|||||
1400-1500 |
1.96 |
× 10–3 |
|||||
the population growth |
rate. Using this formula with |
1500-1600 |
0.85 |
× 10–3 |
|||
|
|
|
1600-1800 |
3.10 |
× 10–3 |
||
periods of 100 years gives us the table on the right. |
1800-1900 |
5.64 |
× 10–3 |
||||
|
|
|
1900-2000 |
13.30 × 10⁻³ |
|||
We can use these growth rates and the population figure
for 1348 to predict the world population now if the Black Death had not occurred. To do this, we assume that all the other events between 1348 and 2000 were the same.
As we can see from the table, if the Black Death had not occurred then in the year 2000 there would have been 9.45 billion people, or twice the world's current population, living on the planet.
Algebra 11
EXERCISES 3.1
A.Logarithm
1.Calculate the logarithms.
a. |
log |
1/ 3 |
1 |
b. |
log |
2 |
1 |
|
|
3 |
|
|
8 |
||
d. log1/8 |
1 |
e. logñ2 |
2 |
||||
g. |
log 1 |
|
h. log(ln e) |
||||
j. |
log |
(9 ln e3) |
k. |
ln(log 10e) |
|||
|
3 |
|
|
|
|
|
|
c.ln e
f. log 5 1000 i. ln 3 e
l. ln(log 10)
2. Solve each equation for x.
|
|
|
|
|
|
x |
a. 3x = 4 |
b. 2x + 1 = 3 |
c. 31– 2 = 2 |
||||
d. ex = 4 |
e. 10x = 5 |
f. 10x – 1 = 2 |
||||
3. Simplify the expressions. |
|
|
|
|||
a. |
eln x |
b. |
10log 3 |
|
c. |
4log2 7 |
d. |
5– log25 2 |
e. |
27log1/ 3 4 |
f. |
(xlog3 5 )log x 3 |
|
g. |
xlogx 3 + ylog1/ y 1/ 3 + zlog z 1/ 3 – tlog1/ t 1/ 3 |
|
||||
h. |
4 |
3 ) |
i. |
16 |
log125 3 |
|
|
|
|||||
– log2(log3 |
(25) |
64 |
|
|||
|
|
|
|
|
|
|
4.Calculate the logarithms, using log 2 = 0.30103 and log 3 = 0.4771.
a. log 18 |
b. log 30 |
c. log |
1 |
|
|
|
5 |
5.Find the number of digits in each number if log 2 = 0.30103 and log 3 = 0.4771.
a. 250 |
b. 910 |
c. 279 |
d. 1820 |
6.Write each expression as a single logarithm.
a.13 log x – log y+ log z2
b.– 21 log x+ 21 log y+ 21 log z
7.Write each expression as the sum or difference of the logarithms of a, b and c.
a. log(a3b2c) |
b. log( 3 a bc) |
8.Evaluate the expressions.
a.log24 4 + log24 6
b.log 8 + log 25 + log 5
c.log1/ 2 1 + log5 625+ log1/ 3 81+ log 49 1 4 7
d. log2 1000 – log2 125
9.Calculate each logarithm in terms of the variable(s) provided, using the given relation(s).
a. |
log2 |
3; log3 2 = a |
b. |
log 25; log 2 = a |
c. |
log7 |
21; log3 7 = p |
d. |
log3 18; log3 12 = a |
e. log12 60; log6 30 = a and log15 24 = b
10.logx y = a is given. Express each logarithm in terms of a.
a. log 3 2 x2 y3 |
b. log |
2 x3 y4 |
x y |
|
x / y |
11.Simplify the expressions.
a.(log3 625 log1/ 5 9)+(log 4 1251 log 1/ 251024)
b.loga2 b3 logb3 c4 log c4 d5 log d5 a
12.Find x in each case.
a.log2 x = 3 – (2 log2 3) + (3 log2 5)
b.log3 x = 2+(3 log 3 5) – (2 log 3 4)
13.Prove each equality.
a. |
log |
x |
x log |
x |
x ... log |
x |
|
x =1 |
||
|
|
2 |
|
|
3 |
n |
1 |
|||
|
|
1 |
|
|
|
2 |
|
|
|
|
|
|
y |
|
z |
|
x |
|
|
|
|
b. |
xlog z |
ylog |
|
zlog y =1 |
|
|
|
|||
x |
|
|
|
|||||||
14. Show that if a2 + b2 = 7ab (a, b 0) then log a +3 b = 21(log a+ log b).
Exponential and Logarithmic Functions |
187 |
B.Logarithmic Functions
15.For which values of x is each logarithm defined?
a. |
log2(x – 2) |
b. |
log 1 (x2 5x – 6) |
||||
|
|
|
|
|
|
3 |
|
c. ln (x2 – 2x + 1) |
d. log 1 | x| |
||||||
|
|
|
|
|
|
3 |
|
e. |
log |
1.5 |
1 x |
f. |
log |
2 |
x (x – 2) |
|
|
x+1 |
|
|
3 – x |
||
g. |
logx2 – 2x+2 e |
h. logx+3(x2 – x) |
|||||
16. State the domain of each function.
a. f(x) = log3(x – 2) |
b. f(x) = log2(x – 1) |
|||||
c. f (x)= log 1(log 1 x) |
d. f(x) = logx(2x – 1) |
|||||
|
3 |
2 |
|
|||
e. |
f (x)= ln |
1– x |
|
f. f (x)= log2 x2 4 |
||
x+2 |
||||||
|
|
|
||||
g. |
f (x)= log |
x2 – x |
h. f(x) = log2 – x (3x – 4) |
|||
i. |
f (x)= log9(log 1(2x+4)) |
|||||
|
|
|
3 |
|
||
j.f(x) = log4(x2 + x – 2)
k.f(x) = log(x – 2) + log(3 – x)
l.f(x) = log2 (log2(1 – x))
17. Sketch each graph by plotting selected points.
a. y = log5 x |
b. y = log 1 |
x |
|
3 |
|
c. y = log x |
d. y = ln x |
|
18. Identify the sign of each function with respect to x. a. f(x) = log3(2x – 1) b. f(x) = ln |x – 1|
19. Write or in each gap to make true statements.
a. |
log3 |
2 ... |
1 |
b. |
log0.13 |
0.14 |
... 0 |
c. |
log4 |
5 ... |
1 |
d. |
log1/2 |
0.3 ... |
2 |
20. Order x, y and z in each case.
a. x = log2 |
3, |
y = log2 |
5, |
z = log2 |
7 |
b. x = log1/2 3, |
y = log1/2 5, |
z = log1/2 7 |
|||
c. x = log2 |
3, |
y = log3 |
4, |
z = log4 |
5 |
21. Find the inverse of each function.
|
x |
|
2 |
x |
a. |
f(x) = 5 |
b. f (x)=( 3) |
|
|
c. |
f(x) = ex |
d. f(x) = 5–x |
|
|
e. |
f(x) = 2x – 1 |
f. |
f(x) = 1 + 32x – 1 |
|
g. |
f(x) = 2 – ex + 1 |
h. |
f(x) = log2(x – 3) |
|
i. |
f(x) = ln(x + 2) |
j. |
f(x) = 3 log(x + 1) |
|
k. |
f(x) = log 10x |
l. |
f(x) = log3(x – 4) |
|
22.Determine whether each function is strictly increasing or decreasing.
a. f(x) = log2(1 – 3x) b. f (x)= log 1 |
(2x+1) |
5 |
|
D.Applications of Logarithmic Functions
23.A scientist measured the intensity of an earthquake to be 120,000 times the reference intensity (minimum intensity). The scientist needs to report a Richter scale reading to a newspaper reporter. Which number should he give to the reporter?
188 |
Algebra 11 |