

Linear Engine / L2V4bGlicmlzL2R0bC9kM18xL2FwYWNoZV9tZWRpYS83MTc1
.pdfCsaba Tóth-Nagy |
Linear Engine Development for Series Hybrid Electric Vehicles |
Figure 1. Hubbert’s idealized oil reserve exploration and oil production predictions [1].
Although Hubbert made his studies for the 48 continental states of the US, they proved valid for the world’s oil reserve explorations as well. Hubbert based his predictions on the fact that the area under the exploration and the production curves must be equal. As the curves show, Hubbert predicted a 100-year period from the beginning of the oil production to the total consumption of the oil reserves. In 1995, Ivanhoe [1] reconsidered the historical oil production data and defined a modified version of Hubbert’s prediction for oil production. Figure 2 shows the idealized curves Hubbert predicted and Ivanhoe’s modified oil production prediction curve. According to Ivanhoe’s predictions the crude oil production will keep at a slight increase until 2010, after that, it will decay and in 2050 the oil production will be at approximately 25% of that of today. Efforts have been made to utilize other hydrocarbon-based fuels such as compressed natural gas (CNG) and liquefied petroleum gas (LPG) [2] but the final result
3

Csaba Tóth-Nagy |
Linear Engine Development for Series Hybrid Electric Vehicles |
will not be altered: the reserves are going to run out. The decreasing fuel production will result in increasing fuel prices forcing human society to be thrifty with oil and to find alternative energy sources eventually. The energy needs will have to be covered from renewable energy source such as hydraulic and wind power plants and solar energy converters.
Figure 2. The idealized oil discovery and production curves for the world as Hubbert predicted it in 1962 and the modified oil production curve as Ivanhoe predicted it in 1995 [1].
1.2 Global warming
Scientist groups have been concerned about the greenhouse effect, and its result, the global climate change of the Earth. The greenhouse effect is a natural process on Earth that keeps the planet at a temperature that supports the present form of life. Greenhouse gases let the heat of the sun radiate into the atmosphere of Earth to warm the surface and, at the same time, greenhouse gases form an insulating layer and keep a large
4

Csaba Tóth-Nagy |
Linear Engine Development for Series Hybrid Electric Vehicles |
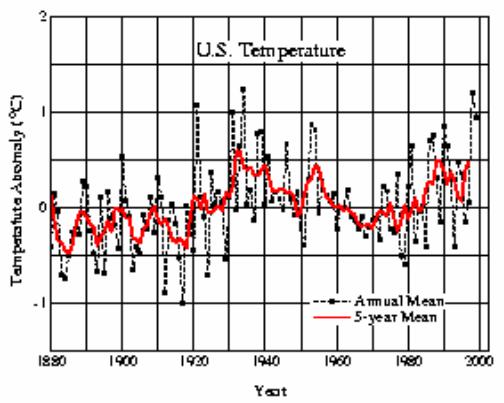
portion of the heat within the atmosphere, just like a greenhouse would do. Although there have been extensive studies conducted on the greenhouse effect, there is no settled agreement on the global warming and its consequences [3-5]. Reference [3] lists a number of sources pro and contra global warming. Figure 3 and Figure 4 show the historical annual-mean surface air temperature data globally and for the US only [5]. The global warming shown in Figure 3 cannot really be seen in Figure 4, which suggests that global warming does not affect the US appreciably. Reference [3] explains this with unreliable sources of data globally. However, error would probably not be consistently increasing year-by-year. This suggests that the global climate change is detectable.
Figure 3. Global annual-mean surface air temperature change derived from the meteorological station network shown for both the annual and 5-year means [5].
5
Csaba Tóth-Nagy |
Linear Engine Development for Series Hybrid Electric Vehicles |
Figure 4. Annual and five-year running mean surface air temperature in the contiguous 48 United States relative to the 1951-1980 mean [5].
Water vapor and carbon dioxide (CO2) are the main contributors to the greenhouse effect. Water vapor is natural in the atmosphere of Earth and quickly changing. The amount of water vapor in the air is not influenced by human activity. The amount of CO2 in the atmosphere, on the other hand, can be, and is, influenced by humans. Figure 5 shows the carbon dioxide concentration as measured in Mauna Loa, Hawaii. The measurements represent the globally mixed concentration, as there is minimal local industrial activity in Hawaii [4]. Seasonal fluctuation that can be seen in the graph is due to the natural plant activity. Plants store CO2 during spring and summer then release it due to rotting during fall and winter.
6

Csaba Tóth-Nagy |
Linear Engine Development for Series Hybrid Electric Vehicles |
Figure 5. Carbon dioxide concentration as measured in Mauna Loa, Hawaii. These measurements represent the globally mixed concentration [4].
The extension of the graph in Figure 5 suggests that CO2 concentration was stable at 280 ppm [4] before the industrial revolution due to natural sources of CO2 such as volcanic activity, rotting swamps, and plant photosynthesis. The graph itself shows 370 ppm today, which presents a 30% increase over the last 2 centuries claimed to be due to human activities [4].
Figure 6 shows the greenhouse effect contribution of CO2, which shows that CO2 is responsible in only 2% of the greenhouse effect. The remaining 98% is due to water vapor. Although human activity is responsible for only 30% of the CO2 production, a treaty, the Kyoto Protocol, was established to decrease the CO2 production from human activity [7]. By 1999, 84 countries signed the Kyoto Protocol and agreed to reduce their CO2 production to the level of that in 1990 or lower [8].
7

Csaba Tóth-Nagy |
Linear Engine Development for Series Hybrid Electric Vehicles |
Figure 6. Greenhouse effect contribution of CO2 and water vapor. CO2 contribution is only 2% [7].
Figure 7. Percent contribution of different sources of man made green house gases to the global green house effect. US CAFE regulated vehicular emissions 1.5% [7].
Figure 7 shows the contribution of different sources of man made green house gases to the global green house effect. Besides the contribution of other greenhouse gas sources the chart shows the contribution of transportation to the greenhouse effect.
Although CO2 and water vapor are the main contributors, there are some other greenhouse gases that cannot be neglected. Lesser greenhouse gases are methane,
8
Csaba Tóth-Nagy |
Linear Engine Development for Series Hybrid Electric Vehicles |
tropospheric ozone, nitrous oxide, chlorofluorocarbons, particulate matter, carbon monoxide and other reactive gases. They occur in the atmosphere of Earth in trace amounts compared to CO2 and water vapor.
1.3 Corporate average fuel economy (CAFE) standards
To decrease total vehicular fuel consumption, the Congress of the United States established the corporate average fuel economy (CAFE) standards that set the standards for passenger car and light duty vehicle fuel economy. (CO2 production was not a subject of concern back then.) The present passenger car CAFE standard was set in 1985 at 27.5 mpg and the light duty vehicle CAFE standard was set in 1996 at 20.7 mpg. CAFE defines a penalty upon an auto manufacturer whose corporate average fuel economy for the entire fleet sold in the US is lower than the CAFE standard value. The penalty is $5 per 0.1 mpg for each vehicle sold by that manufacturer. Table 2 shows the CAFE standards for passenger cars and light duty vehicles for 1978 to 2003 [11].
9

Csaba Tóth-Nagy |
Linear Engine Development for Series Hybrid Electric Vehicles |
Table 2. CAFE standards for 1978 to 2003 [11].
Fuel Economy Standards for Passenger Cars and Light Trucks
Model Years (MY) 1978 through 2003 (in MPG)
|
|
|
|
|
Model |
Passenger |
|
Light Trucks (1) |
|
Year |
Cars |
|
|
|
|
|
Two-wheel |
Four-wheel |
Combined (2), (3) |
|
|
Drive |
Drive |
|
1978 |
18.0 (4) |
... |
... |
... |
1979 |
19.0 (4) |
17.2 |
15.8 |
... |
1980 |
20.0 (4) |
16.0 |
14.0 |
...(5) |
1981 |
22.0 |
16.7(6) |
15.0 |
... (5) |
1982 |
24.0 |
18.0 |
16.0 |
17.5 |
1983 |
26.0 |
19.5 |
17.5 |
19.0 |
1984 |
27.0 |
20.3 |
18.5 |
20.0 |
1985 |
27.5(4) |
19.7(7) |
18.9(7) |
19.5(7) |
1986 |
26.0(8) |
20.5 |
19.5 |
20.0 |
1987 |
26.0(9) |
21.0 |
19.5 |
20.5 |
1988 |
26.0(9) |
21.0 |
19.5 |
20.5 |
1989 |
26.5(10) |
21.5 |
19.0 |
20.5 |
1990 |
27.5(4) |
20.5 |
19.0 |
20.0 |
1991 |
27.5(4) |
20.7 |
19.1 |
20.2 |
1992 |
27.5(4) |
... |
... |
20.2 |
1993 |
27.5(4) |
... |
... |
20.4 |
1994 |
27.5(4) |
... |
... |
20.5 |
1995 |
27.5(4) |
... |
... |
20.6 |
1996 |
27.5(4) |
... |
... |
20.7 |
1997 |
27.5(4) |
... |
... |
20.7 |
1998 |
27.5(4) |
... |
... |
20.7 |
1999 |
27.5(4) |
... |
... |
20.7 |
2000 |
27.5(4) |
... |
... |
20.7 |
2001 |
27.5(4) |
... |
... |
20.7 |
2002 |
27.5(4) |
... |
... |
20.7 |
2003 |
27.5(4) |
... |
... |
20.7 |
1.Standards for MY (model year) 1979 light trucks were established for vehicles with a gross vehicle weight rating (GVWR) of 6,000 pounds or less. Standards for MY 1980 and beyond are for light trucks with a GVWR of 8,500 pounds or less.
2.For MY 1979, light truck manufacturers could comply separately with standards for four-wheel drive, general utility vehicles and all other light trucks, or combine their trucks into a single fleet and comply with the standard of 17.2 mpg.
3.For MYs 1982-1991, manufacturers could comply with the two-wheel and four-wheel drive standards or could combine all light trucks and comply with the combined standard.
4.Established by Congress in Title V of the Motor Vehicle Information and Cost Savings Act.
5.A manufacturer whose light truck fleet was powered exclusively by basic engines which were not also used in passenger cars could meet standards of 14 mpg and 14.5 mpg in MYs 1980 and 1981, respectively.
6.Revised in June 1979 from 18.0 mpg.
7.Revised in October 1984 from 21.6 mpg for two-wheel drive, 19.0 mpg for four-wheel drive, and 21.0 mpg for combined.
8.Revised in October 1985 from 27.5 mpg.
9.Revised in October 1986 from 27.5 mpg.
10.Revised in September 1988 from 27.5 mpg.
10
Csaba Tóth-Nagy |
Linear Engine Development for Series Hybrid Electric Vehicles |
In summary, the pie chart in Figure 6 represents the greenhouse effect contribution of CO2, which shows that CO2 is responsible for the greenhouse effect in only 2%. From Figure 5, it can be concluded that human activity is responsible for 30% of the CO2 present in the atmosphere. Figure 7 shows that those vehicles that are subjected to CAFE in the US produce only 1.5% of the CO2 that is made by man. Putting the pieces together yields: 2% of the greenhouse effect is due to CO2; 30% of that is due to human activity; 1.5% of that is emitted by vehicles regulated by the CAFE standard in the US. It can be concluded that the whole passenger car and light duty vehicle fleet in the US contributes to the greenhouse effect only in 0.009%. This number, however, neglects the greenhouse effect of water vapor generated during combustion.
1.4 EPA emissions standards
The poor air quality in urban areas caused by vehicular emissions, on the other hand, is of concern and affects the whole local population. The smog lingering around major cities represents a serious health hazard to dwellers of metropolitan areas as being a major contributor to asthma, allergies, and other respiratory diseases [9].
To improve air quality in urban areas and, along with this, decrease health hazards, and improve visibility problems originating from vehicular emissions, the Environmental Protection Agency (EPA) established emissions standards that force vehicle manufacturers to produce vehicles that emit less exhaust emissions year by year. The Clean Air Act of 1963 and its amendments set the emissions standards for both light and heavy-duty vehicles sold in the US [10]. The presently regulated emissions are oxides of nitrogen (NOx), carbon monoxide (CO), unburned hydrocarbons (HC), and particulate matter (PM). Figure 8 through Figure 11 show the emission regulations for
11

Csaba Tóth-Nagy |
Linear Engine Development for Series Hybrid Electric Vehicles |
the four regulated exhaust emissions for passenger cars and light duty trucks for years
1963 through 2006.
Figure 8. NOx emissions standards for passenger cars and light duty trucks for years 1963 through 2006 [10].
Figure 9. Unburned HC emissions standards for passenger cars and light duty trucks for years 1963 through 2006 [10].
12