

Linear Engine / L2V4bGlicmlzL2R0bC9kM18xL2FwYWNoZV9tZWRpYS83MTc1
.pdfCsaba Tóth-Nagy |
Linear Engine Development for Series Hybrid Electric Vehicles |
6.5 Scavenging
The engine used loop scavenging performed by pressurized (83 kPa) house air. The air was ducted into the engine housing under the piston and the edge of the piston controlled scavenging just like it would in a two-stroke gasoline engine. A person was operating the valve that controlled the amount of air delivered to the engine. This was needed while starting the engine because over-scavenging the engine prevented combustion during starting, but the engine, once running, was running erratically with the amount of air that starting required. This was due to the fact that the highest compression ratio was achieved with cranking at 20 Hz but the engine operated between 50 and 60 Hz when it was running requiring three times as much air while running compared to starting. Once the engine was running, full airflow was provided to ensure proper scavenging.
6.6 Fuel
Two types of fuel were investigated in the linear engine: diesel fuel and kerosene. The present engine setup was able to operate on kerosene. Experiments were carried out with kerosene only. Although there is no side force on the pistons, two-stroke lubricant was mixed with the fuel in the ratio of 1:50.
Attempts were made to apply diesel fuel as well but the need for a sparking starting aid and the lower volatility of diesel fuel did not allow the engine to run with the present setup. Diesel fuel fouled the sparkplugs before the engine could start and sustain operation.
103
Csaba Tóth-Nagy |
Linear Engine Development for Series Hybrid Electric Vehicles |
6.7 Load
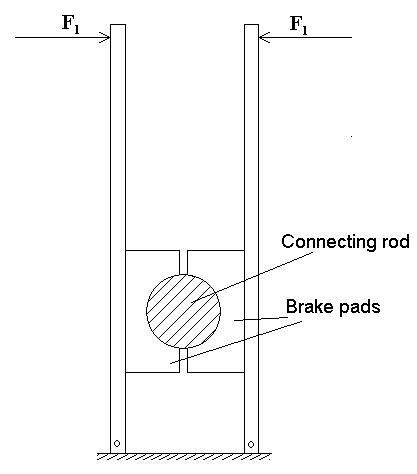
As the alternator was still under construction a friction brake was applied to load the engine. The friction brake acted on the rod that connected the two pistons. Figure 50 shows the load implementation in practice.
Figure 50. The testing dynamometer for the linear engine was a friction brake on the connection rod.
The two arms of the brake were cable-operated and tension force (Fl) in the cable was measured with an Interface load cell (part #: SMT2-450) and recorded by the data acquisition system (DAQ). The friction brake was calibrated with different weights
104
Csaba Tóth-Nagy |
Linear Engine Development for Series Hybrid Electric Vehicles |
applied on the piston-load assembly through a rope and pulley mechanism. Weight and the output voltage of the load cell were recorded.
6.8 Data acquisition system (DAQ)
The data acquisition was accomplished by using a National Instrument DAQ6020E data acquisition card and high-speed data acquisition program applied on a personal computer. The high-speed data acquisition program was written by Pertl [75] WVU. The maximum speed of DAQ-6020E was 500 kilo-samples per second. Data were taken at 4000 samples per second during the initial experiments then later at 10,000 samples per second for increased resolution. The data taken included translator position, cylinder pressure, injector current, sparking signal, cranking current, load, and exhaust pressure.
6.9 Position measurement
A non-contact inductive-potentiometric displacement sensor was used to detect the position of the translator (MICRO-EPSILON, part # VIP-100-ZA-2-SR-1). The sensor rod contained a segmented coil. Current flowing through the coil segments were individually measured. A non-contacting aluminum ring attached to the translator moved on the rod. The current flowing in the coil caused eddy currents in the aluminum ring. The eddy currents in turn influenced the magnetic field and the current flowing in the coil segments. The sensor had a 100 mm measuring range and 0.2% linearity.
Figure 51 shows the placement of the position sensor.
105

Csaba Tóth-Nagy |
Linear Engine Development for Series Hybrid Electric Vehicles |
Figure 51. The position sensor. (part # VIP-100-ZA-2-SR-1)
There was an error introduced in the position measuring method. This error was believed to be due to three factors.
Firstly, because of space limitations, the aluminum ring was mounted on a relatively long and thin aluminum web. The web deflected at sudden speed changes. This effect was the most amplified at the two ends, which caused a longer detected stroke for the engine then its actual stroke was.
Secondly, the connecting rod was a relatively long and thin rod that had changed its length under compression. The strain effect calculations can be seen in Equation 21 Equation 23. The force (F) acting on the half of the rod length is calculated from the
106

Csaba Tóth-Nagy |
Linear Engine Development for Series Hybrid Electric Vehicles |
mass of one piston, half of the rod and the iron slug (m=2 kg) and the acceleration of the translator (a=100,000 m/s2). The acceleration value was obtained from simulation data. The strain (ε) was calculated from the force (F), cross-sectional area of the rod (A=506
mm2), and the modulus of elasticity (E=70 GPa). The change of rod length (∆x), which
is the possible error in position measurement, was calculated from the strain (ε) and the third of the rod length (x=0.25 m). Figure 52 shows the free body diagram of the translator. The weight of the rod and the pistons were neglected for this calculation.
Figure 52. Free body diagram of the translator.
Equation 21
F = ma = 2 *100,000 = 200,000N
Equation 22
ε = |
F |
= |
|
200,000 |
|
=0.00563m |
||
EA |
|
0.0254 |
2 |
*Π*70*10 |
9 |
|||
|
|
|
|
|||||
|
|
|
|
4 |
|
|
|
|
|
|
|
|
|
|
|
|
|
Equation 23
∆x =εx =0.00563*0.25 =0.0014m =1.4mm
It can be seen from the calculations that there would be a maximum of 1.4 mm error introduced into the measurement due to strain.
107
Csaba Tóth-Nagy |
Linear Engine Development for Series Hybrid Electric Vehicles |
And thirdly, the cylinders and their fasteners were also experiencing strain as they provided the reaction force for stopping and returning the translator at the end positions.
These three effects have probably happened in a vibrational form and they added or subtracted from each other variably. This caused an inconsistent and unpredictable error that was probably responsible for the high cycle-to-cycle variation in the gathered position data. The measured maximum position data often were outside of range of stroke of the engine. A representative section of the position data can be seen in Figure 53. It can be concluded that the maximum position data varied between 74 and 78 mm resulting in a 4 mm window of variance. The minimum data ranged from 0 to 1.2 mm resulting in a window of 1.2 mm. This large difference in variance was due to the placement of the iron slug and the placement of the moving element of the position sensor. The moving element of the position sensor was placed at about 200 mm and the slug was placed at about 500 mm on the 830 mm long rod. This uneven placement yielded the fact that the error of the position measuring method affected the measurement of the minimum and the maximum value to a different extent.
108

Csaba Tóth-Nagy |
Linear Engine Development for Series Hybrid Electric Vehicles |
|
80.0 |
|
|
|
|
|
|
|
|
79.0 |
Maximum translator position (mm) |
|
|
|
|
|
|
|
|
|
|
|
0.80 |
|
||
(mm) |
78.0 |
Minimum translator position (mm) |
|
|
|
(mm) |
||
|
|
|
|
|
|
|||
|
|
|
|
|
|
|
||
position |
77.0 |
|
|
|
|
|
|
position |
76.0 |
|
|
|
|
|
0.30 |
||
|
|
|
|
|
|
|||
|
|
|
|
|
|
|
||
translator |
75.0 |
|
|
|
|
|
|
translator |
74.0 |
|
|
|
|
|
-0.20 |
||
|
|
|
|
|
|
|||
|
|
|
|
|
|
|
||
Maximum |
73.0 |
|
|
|
|
|
|
Minimum |
72.0 |
|
|
|
|
|
-0.70 |
||
|
|
|
|
|
|
|
||
|
71.0 |
|
|
|
|
|
|
|
|
70.0 |
|
|
|
|
|
-1.20 |
|
|
0 |
10 |
20 |
30 |
40 |
50 |
60 |
|
Cycles of operation
Figure 53. The maximum and minimum value of translator position.
6.10 Measuring cylinder pressure
The cylinder pressure was measured with piezo-electric pressure sensors (part #: PCB JP 145 A01 SN 212). Each cylinder head was equipped with a piezo-electric sensor. The sensor detected pressure in the output form of electric charge. Then a charge-to-voltage converter converted the signal into a readable format. Then the signal was sent through a voltage amplifier and recorded by the data acquisition system.
An error was introduced into the pressure measurement as the temperature change had an effect on the pressure transducers. As temperature changed the zero calibration of the transducers drifted. A computer program was created to compensate for the temperature drift of the pressure transducers. The computer code applied a smoothing function to the pressure data then calculated the rate of pressure change. If the rate of
109

Csaba Tóth-Nagy |
Linear Engine Development for Series Hybrid Electric Vehicles |
pressure change was less than 1 GPa/sec then the computer decided that that point should be at zero, and moved all the data points from that point forward, inclusive, by the value of the given data point. The value was defined by trial and error. It is clear that this method introduced a certain amount of error in the data sets that probably alters the results of this study but the compensation of the data was unavoidable. The drifting effect of the temperature on the pressure transducers was always present (up to 200% of the maximum peak pressure in some cases) but of course it had less relative effect on pressure data when the rate of pressure change was large. Figure 54 shows a section of the unmodified and compensated pressure data for both cylinders.
Figure 54. Unmodified and compensated pressure data for both cylinders. Run # 14.
110
Csaba Tóth-Nagy |
Linear Engine Development for Series Hybrid Electric Vehicles |
6.11 Conclusions
The prototype linear engine design was presented with a detailed description of the present state of development. Architecture, control, scavenging process, fuel used in the engine, measuring equipment, and data acquisition system were described. The engine also required a sparking starting aid because the starting solenoids were not powerful enough to provide higher than 4:1 compression ratio. After the engine started, the spark was turned off, and the engine continued to operate on compression ignition principles. It can also be concluded that starting the engine must happen in short bursts rather that long period of cranking taking advantage of the overshooting effect to achieve maximum achievable compression ratio.
111
Csaba Tóth-Nagy |
Linear Engine Development for Series Hybrid Electric Vehicles |
7 Experimental results
The linear engine was tested to evaluate the effect of translator weight, amount of fuel injected, fueling timing, stroke length, and intake air pressure on engine behavior. Although the engine showed its ability to run and produce output power, it did not demonstrate high reliability. The initial plan was to examine the engine with fractional factorial experiment design method. However, the engine operated with a very high failure rate that was due to two factors. Firstly, the two-stroke gasoline engine components were under designed for the compression ignition diesel application. Secondly, the vibration of the engine caused an excessive fatigue load on the components. These factors resulted in catastrophic failure of various components. Highpressure forces caused failure in pistons, piston pins, the connecting rod, and head gaskets. The inertial force of the moving mass caused failure in the cylinders and bolts and fasteners. The vibration caused the failure of injectors, bolts, fuel lines, and the position sensor. The engine development was a continuous improving and redesigning process. However, the present version of the engine did not allow for long hours of operation but only short minutes or seconds before a break down. This allowed for only a limited testing and prevented the completion of the test matrix. However, the results of the testing are presented in this chapter. Table 3 shows the summary of results for all the “successful” runs that were performed on the linear engine. The table shows results of runs with varied translator mass, intake pressure, injection timing, and stroke length. Detailed analysis of the data follows in this chapter.
112