

NC-Verilog Simulator Tutorial
Cadence® NC-Verilog® Simulator Tutorial
Loading the Design into the Simulator
After you have compiled and elaborated your design, you can invoke the ncsim simulator. You invoke ncsim with command-line options and the simulation snapshot name. Invoke ncsim with the following command line:
ncsim worklib.test:module -gui
worklib.test:module is the name of the snapshot that you created in the previous step.
The -gui option invokes the simulator with the SimVision analysis environment.
Using the SimVision Analysis Environment
The SimVision analysis environment is a unified graphical debug environment for Cadence simulators. The SimVision environment features advanced debug and analysis tools and innovative high-level design and visualization capabilities. These tools include:
The SimControl window, which lets you interact directly with the simulator. You can single-step, trace signals, set breakpoints, and observe signals to verify your designs. SimControl also provides access to the following debug tools:
The Watch Objects window, which lets you observe the value of selected signals.
The Navigator, which displays the design hierarchy and shows you signal values at any level of the hierarchy.
The Signal Flow Browser, which lets you trace backwards through a design from a signal that has a questionable value to where a signal first diverges from expected behavior.
The Cycle View, which lets you step through the simulation cycle to debug delta cycle bugs in the design.
The Schematic Window, which lets you view RTL models in a schematic form. The Schematic Window can display the schematic for an entire module that you select in the Navigator, or it can display a signal and its connected logic if you select a signal in the Source Browser or other SimControl tool.
In the current release, the Schematic Window is available only for pure Verilog designs. This tool is not available in the Verilog desktop simulator.
Signalscan waves—Lets you display waveforms.
Comparescan—Lets you compare SHM and VCD waveform databases.
December 2000 |
11 |
Product Version 3.2 |

NC-Verilog Simulator Tutorial
Cadence® NC-Verilog® Simulator Tutorial
See the Cadence SimVision Analysis Environment User Guide for full details on the
SimVision analysis environment.
December 2000 |
12 |
Product Version 3.2 |
NC-Verilog Simulator Tutorial
Cadence® NC-Verilog® Simulator Tutorial
The SimControl Window
SimControl is the main SimVision analysis environment window that appears when you invoke the simulator with the -gui option (+gui if you are using single-step invocation).
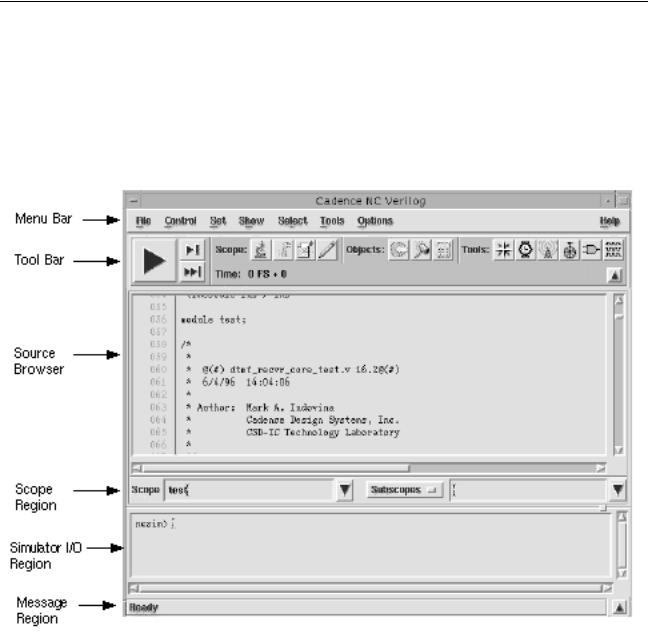
The following figure shows the SimControl window as it appears when you invoke the simulator using the tutorial example:
The different parts of the SimControl window are:
■The Menu Bar, which contains the pulldown menus that let you execute simulator commands.
■The Tool Bar, which contains buttons that give you fast access to commonly used commands and to the other SimVision tools. You can define your own buttons for Tcl commands and add them to the Tool Bar.
■The Source Browser, which displays your source code. You can select scopes, signals, or ports in the Source Browser and operate on them.
December 2000 |
13 |
Product Version 3.2 |

NC-Verilog Simulator Tutorial
Cadence® NC-Verilog® Simulator Tutorial
■The Scope Region, which displays the current scope and lets you quickly set the scope to another level in the hierarchy.
■The Input/Output Region, which displays simulator output and lets you give command-line input to the simulator.
■The Message Region, which displays information about the menu item or button to which the mouse pointer is pointing.
You are now ready to begin the verification of this design. Inserted into the design is a problem that you will find and correct by using some of the debugging options that are provided in the
SimVision analysis environment.
Navigating the Design to Set Watchpoints and Breakpoints and to Set Up Waveforms
Navigating the Design
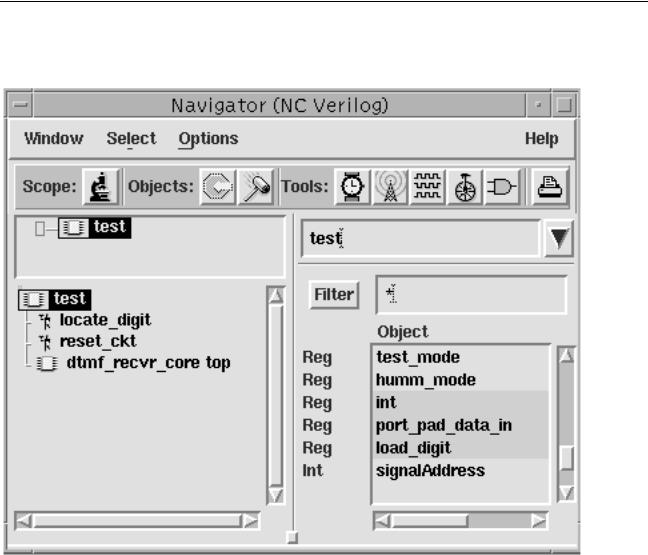
You can navigate the design hierarchy by using the Navigator. In the SimControl window, invoke the Navigator by selecting Tools—Navigator or by clicking on the Navigator button on the Tool Bar.
The Navigator consists of two sides, or panes. On the left is the Scope Tree window, in which you can view your current design hierarchy in a graphical tree representation. To browse the hierarchy, double-click the left mouse button on a node to expand to the lower level. On the right side of the Navigator is the Objects List window, which displays a list of objects with their current simulation values and declarations. A filter controls the signals that are displayed in this window.
Setting Watchpoints
You can use the Watch Window to monitor selected signals in your design.
1.In the Scope Tree window (left pane) of the Navigator, select the component icon called test by clicking the left mouse button.
This displays all of the top-level objects with their values on the right side of the
Navigator.
December 2000 |
14 |
Product Version 3.2 |
NC-Verilog Simulator Tutorial
Cadence® NC-Verilog® Simulator Tutorial
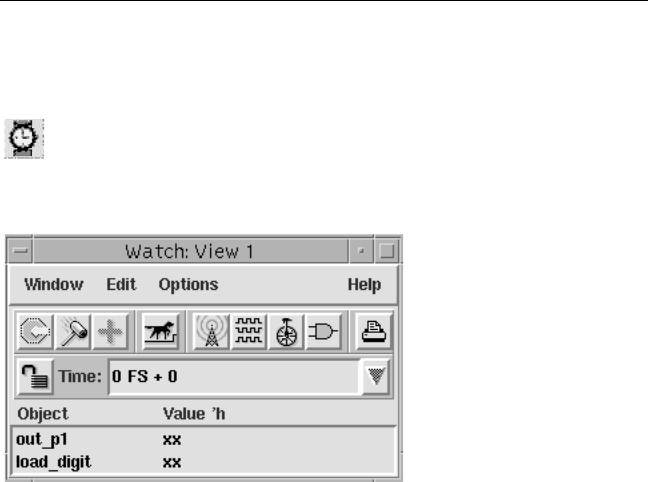
2.Select the net out_p1 and the reg load_digit. Select the first signal with the left mouse button, and then hold down the CONTROL key while selecting the second.
3.Click the Watch Objects button on the Navigator tool bar.
This invokes the Watch Window with the two selected signals displayed. The Watch Window will monitor the values of these two signals during the simulation.
These two signals will indicate whether the circuit computes the proper answer. The signal load_digit represents the encoded value loaded into the circuit. The signal out_p1 is the value that the circuit obtains after decoding, and this should match load_digit. This example simulates the dialing of a 1-800 phone number. The first digit found should correspond to a 1 being dialed.
Setting Up Waveforms
The next step is to probe signals for display in the Signalscan waves waveform viewer.
1. Double-click the left mouse button on the test component icon in the Navigator.
December 2000 |
15 |
Product Version 3.2 |
NC-Verilog Simulator Tutorial
Cadence® NC-Verilog® Simulator Tutorial
This expands the tree and displays the components and tasks contained within this block, as shown in the following figure.
2.Double-click on the instance called top to descend into this component.
Note: If you do not see the instance name top next to the component name dtmf_recvr_core, select Options—Scope Tree to open the Navigator Scope Tree Options form. In the middle section of the form (the section called Formatting), click on the instance name button and then click the OK button.
3.Double-click on the instance name RESULTS_CONV_INST to descend into this component.
You may have to resize the Scope Tree pane to see this instance name. To do this, press and hold the left mouse button on the vertical pane resize button at the bottom of the
Navigator, and drag the button to the right.
December 2000 |
16 |
Product Version 3.2 |

NC-Verilog Simulator Tutorial
Cadence® NC-Verilog® Simulator Tutorial
You should now see the objects for the hierarchical scope test.top.RESULTS_CONV_INST. Note that the SimControl Source Browser automatically changes to show the part of the design displayed in the Navigator.
In the Navigator, notice that the objects consist of PORTS represented by In and Out, internal registers represented by Reg, and nets represented by Net. On Windows, you will notice Parameters displayed with the keyword Param while on UNIX you will have a
... continuation selection at the end of the object list. Selecting this ... will display the Parameters in the UNIX environment.
You will now display all of these signals, except the parameters, in the Signalscan waves waveform viewer.
4.On the Navigator, click on the RESULTS_CONV_INST icon to select it, and then click the Waveform button in the Tool Bar of the Navigator.
This invokes Signalscan waves with all of the selected signals displayed.
Setting an Object Breakpoint
You will now set an object breakpoint on the out_p1 signal. This breakpoint will trigger every time out_p1 changes, so that you can monitor the change in value of this signal.
1.Select the out_p1 signal in the Watch Window.
2.In SimControl, select Set—Breakpoint—Object.
The Set Break form appears. Because out_p1 was preselected, the Object field is seeded with the name of the signal.
3.Click the OK button to create the object breakpoint.
Viewing Results in the SimControl Console Window
Look at the SimControl console window. Each Tcl command that you have executed using the SimVision windows is echoed in the simulator I/O region. The object breakpoint was created with the stop command. A scope command was executed whenever you changed scope. The waveform database was created with the database command, and the signals were added to the waveform database with the probe command.
The simulator records all of these commands in a key file called ncsim.key. You can use this key file to recreate the simulation at a later time.
December 2000 |
17 |
Product Version 3.2 |