

Constr_materials
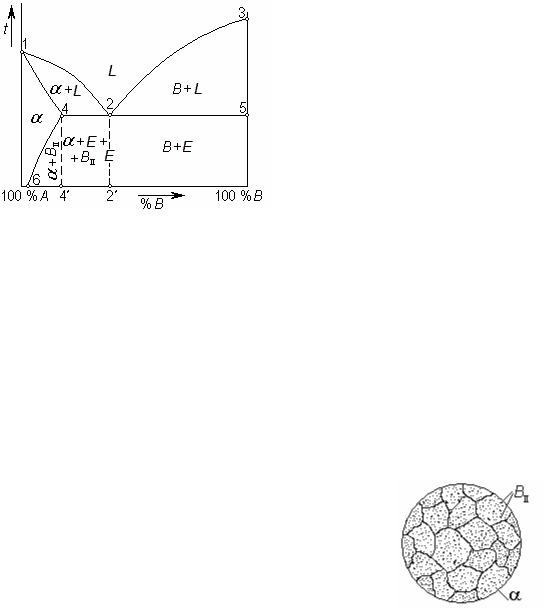
.pdfThe alloy corresponding to 2' composition is called eutectic; alloys to the left from point 2' are called hypoeutectic, and to the right from point 2' – hypereutectic.
It is visible that crystallisation of all alloys of the given system ends with eutectics formation. Eutectics represent a fine-grain structural component of an alloy having fixed mechanical properties. It can be designated by the letter “E”. The structure of eutectic can be written down as E = A + B. It is important to remember that eutectic is a mixture of two phases (not a single phase).
The structure of alloys consists of eutectics and crystals of pure components which formed from melt in the beginning of crystallisation. Hypoeutectic alloys’ structure (alloy I in Figure 8.9) includes crystals A and eutectics (Fig. 8.10, a); hypereutectic alloys’ structure (alloy II in Figure 8.9)
– crystals B and eutectics (Fig. 8.10, b).
These alloys have no phase transformations in a solid state; they always are two-phase and consequently cannot be exposed to strengthening
heat treatment. |
|
|
|
|
|
Castable alloys should have |
|
|
|||
the structure close to eutectics |
|
|
|||
because eutectics, crystallising at |
|
|
|||
constant |
temperature, |
possesses |
|
|
|
the best foundry properties: small |
|
|
|||
shrinkage |
and |
high |
castability. |
|
|
Eutectic alloys are good for |
|
|
|||
solders, |
fuse |
links, |
protective |
a |
b |
devices; they are used |
in friction |
Figure 8.10 Microstructure of alloys: |
|||
bearings as an antifriction layer. |
a – hypoeutectic; b – hypereutectic |
||||
Examples |
of alloys with |
|
|
||
total mutual insolubility of components: Pb – Sb, Pb – Pd, Ca – Mg.
Phase diagram of alloys with limited solubility of components
If alloy components form solid solutions with the limited concentration the phase diagram represents a combination of two previous diagrams (Fig. 8.11).
Let’s take an example when solubility of component B in component A is limited, and component A cannot dissolve in lattice B. Liquidus of the diagrams (the line 1-2-3) has two branches, as well as in previous case. Beneath curve 2-3 crystallisation of component B occurs. Beneath curve 1-2 crystals of solid solution of component B in a lattice A are formed (not pure component A). It is designated as . The limit of solubility for component B in lattice A is equal to segment A-4', where 4' is a projection of a point 4 on
61
Created with novaPDF Printer (www.novaPDF.com). Please register to remove this message.
the axis of concentration. In that case solidus 1-4 of a diagram represents a curve, as well as for the diagram with unlimited solubility. And beyond a solubility limit, more to the right of a point 4, solidus is a straight line, parallel to the axis of composition, as for the diagram with total insolubility of components. At the temperature 4-2-5, the eutectic crystallizes. It consists
of the smallest crystals of a solid solution and component B: E = +
B.
Below the solidus 1-4-2-5 all alloys of the given system are in a solid state, but phase transformations do not come to the end. All solids are compressed upon cooling; interatomic spaces in a crystal lattice decrease. It means that atoms of solute (component B) start to cause the increasing stress in a solvent lattice. Upon very slow, equilibrium cooling these atoms “are pushed out” from crystals of a solid
solution as the system tends to a minimum of free energy, and pressure from “surplus” atoms augments the free energy. Atoms B, leaving a solid solution, form their own crystals. They are very small in comparison with the primary crystals grown directly from the melt (Fig. 8.12).
So, the solubility in cooling decreases; the equilibrium concentration of dissolved component B corresponds to each temperature. Therefore there is line 4-6 in the diagram. It is a line of phase transformation in a solid state termed a line of limited solubility of component B in lattice A, or solvus. Above this line the alloy corresponds a single-phase solid solution , and below the line 4-6 it is a two-phase structure:
+ BII. The subscript “II” means in this case that these crystals of component B are secondary, i. e. they have appeared at decomposition of a solid solution, instead of melt.
If component A had limited solubility in component B there would be a solvus line in the right part of the diagram too.
The important feature of alloys with
concentration of the second component from a point 6 to a point 4': it is possible to subject them to hardening thermal treatment as they have a phase
62
Created with novaPDF Printer (www.novaPDF.com). Please register to remove this message.
transformation in a solid state. At higher cooling rates, atoms B have no time to separate themselves from solid solution. Therefore alloys with variable solubility of the second component may be subject to quenching (heating above the solvus line and fast cooling in order to prevent decomposition of a solid solution) followed by ageing (heating of supersaturated solid solution up to temperatures below critical so that the smallest particles of the second phase will precipitate). After such a heat treatment alloys become much stronger because of hardening by disperse particles of the second phase.
The most alloys have the limited mutual solubility of the components. Examples of alloys with the limited mutual solubility: Al – Cu, Al – Si, Ag – Cu, Pb – Sn.
Phase diagram of alloys with chemical compound of components
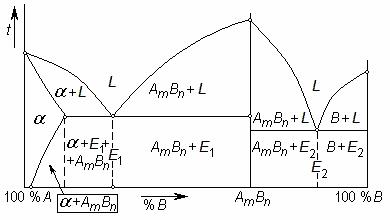
If components of alloy A and B are able to react with each other forming a chemical compound AmBn, the phase diagram is regarded as two separate diagrams; for both of them the chemical compound is one of the components.
The chemical compound is a new complex substance having its own crystal lattice, temperature of fusion and properties. Upon crystallisation of an alloy the chemical compound forms the crystals which can mix up with crystals of original components or dissolve them.
Phase diagrams of such alloys look more difficult than ones considered above, but if to divide mentally the diagram along the line corresponding to a chemical compound the left and right parts of it will appear as well-known simple diagrams.
Figure 8.13 Phase diagram with a chemical compound
In the Figure 8.13 the left part of the diagram (up to chemical compound AmBn) represents a diagram with the limited solubility of components, and the right one – the diagram with a total absence of
63
Created with novaPDF Printer (www.novaPDF.com). Please register to remove this message.

solubility. The eutectic E1 consists of crystals of a solid solution and chemical compound AmBn. is a solid solution of component B in the lattice A. Below the solvus line crystals of chemical compound evolve from a solid solution. In the right part of the diagram, eutectics E2 is formed by crystals of component B and chemical compound AmBn.
Properties of alloys and type of the diagram
If properties of pure components and a type of phase diagram are known it is possible then to predict properties of any alloy of the given system.
In the Figure 8.14 the basic types of diagrams and alteration of properties are shown (hardness of Brinell HB and percent elongation δ).
Unlimited solid solutions have curvilinear property dependence on concentration (Fig. 8.14, а). They can have, for example, higher values of strength as compared to pure components. Curvilinear dependence of electrical resistance is especially pronounced.
а |
b |
c |
d |
Figure 8.14 Changes of alloys’ properties depending on concentration of components
If alloy is a mechanical mix of components, then its properties change linearly and proportionally to concentration (Fig. 8.14, b). In other words, value of any characteristic of alloys will change only within properties of pure components.
In system of alloys with the limited solubility, properties change on curvilinear dependence within the field of a solid solution, and within the field where eutectic is present, the dependence is linear (Figure 8.14, c).
If the chemical compound is formed, then the dependence of alloy properties on composition changes sharply at transition through this point (Fig. 8.14, d).
64
Created with novaPDF Printer (www.novaPDF.com). Please register to remove this message.
Questions and problems
1.What is an alloy?
2.What is an alloy component?
3.What are the types of components interaction in alloys?
4.What are the substitutional solid solutions and interstitial solid solutions?
5.Conditions of solid solutions formation with limited and complete solubility.
6.How do solid solutions look like under the microscope?
7.What is mechanical mixture of crystals? When do they form? How does such an alloy look like under the microscope?
8.When do chemical compounds form in alloys? What do they differ from initial components with?
9.What is a phase equilibrium diagram?
10.What is the method of phase diagrams plotting?
11.What are a phase and a component?
12.What is critical temperature?
13.What are liquidus and solidus?
14.Phase diagram with a total absence of solubility. What are eutectic, hypoeutectic and hypereutectic alloys?
15.Phase diagram with complete solubility. What is liquation and microliquation?
16.Phase diagram with limited solubility. Notion of solubility limit. How does solubility limit change when the temperature changes?
17.How to regard a phase diagram with chemical compound?
18.How do alloys properties depend on phase diagram types?
65
Created with novaPDF Printer (www.novaPDF.com). Please register to remove this message.

9. IRON – CARBON ALLOYS
Ferrous alloys – those of which iron is the prime constituent – are produced in quantities larger than any other metal. They are especially important as engineering construction materials. Their widespread use is accounted for by three factors: (1) iron-containing compounds exist in abundant quantities in the earth’s crust; (2) metallic iron and steel alloys may be produced using relatively economical extraction, refining, alloying, and fabrication techniques; and (3) ferrous alloys are extremely versatile, since they may be tailored to have a wide range of mechanical and physical properties. The principal disadvantage of many ferrous alloys is their susceptibility to corrosion. A classification scheme for the various ferrous alloys is presented in Figure 9.1.
|
|
|
|
|
|
|
|
|
|
|
|
|
|
|
Ferrous alloys |
|
|
|
|
|||
|
|
|
|
|
|
|
|
|
|
|
|
|
|
|
|
|
|
|
|
|
|
|
|
|
|
|
|
|
|
Steels |
|
|
|
|
|
|
|
|
|
Cast irons |
|||||
|
|
|
|
|
|
|
|
|
|
|
|
|
|
|
|
|
|
|
|
|
|
|
|
|
Low |
|
alloy |
|
|
|
|
|
|
Gray |
Ductile |
White |
Malleable |
||||||||
|
|
|
|
|
|
|
||||||||||||||||
|
|
|
|
|
|
|
|
|
|
|
|
|
|
|
|
iron |
(nodular) |
iron |
iron |
|||
|
|
|
|
|
|
|
|
|
|
|
|
|
|
|
High |
alloy |
iron |
|
|
|
||
|
|
|
|
|
|
|
|
|
|
|
|
|
|
|
|
|
|
|||||
|
|
|
|
|
|
|
|
|
|
|
|
|
|
|
|
|
|
|
||||
|
Low-carbon |
|
|
|
|
|
|
|
|
|
|
|
|
|
||||||||
|
Medium-carbon |
High-carbon |
|
|
|
|
|
|
|
|
||||||||||||
|
|
|
|
|
|
|
|
|
|
|
|
|
|
|
|
|||||||
Plain High strength, |
Plain Heat |
Plain Tool |
|
Stainless |
|
|
|
|||||||||||||||
|
|
low alloy |
|
treatable |
|
|
|
|
|
|
|
|
|
|
|
|
|
|||||
Figure 9.1 Classification scheme for the various ferrous alloys
9.1. THE IRON–IRON CARBIDE PHASE DIAGRAM
Components and phases
Components in iron–carbon alloys are a metal iron and non-metal carbon. Iron (Fe) melts at the temperature 1539 ?C. In a solid state it experiences two polymorphic transformations. Major of them is transformation at 911 ?C.
Below this temperature iron has the body-centered cubic lattice (BCC) with parameter a = 0.286 nm (see Fig. 9.2, a). It is referred as α iron (Feα). Above 911 ?C, the γ iron (Feγ) exists as face-centered cubic lattice (FCC) with parameter a = 0.364 nm (see Fig. 9.2, b).
Since α iron is ferromagnetic and high-temperature modification Feγ is paramagnetic, it is easy to identify them using magnetic methods.
High-temperature transformation γ iron to δ iron with BCC lattice influences structure and properties of alloys less, therefore it is not observed further. The designation β iron is given to paramagnetic iron with BCC lattice which exists from the Curie point (768 ?C) to 911 ?C.
66
Created with novaPDF Printer (www.novaPDF.com). Please register to remove this message.

а |
b |
Figure 9.2 Crystal lattice of iron (а) and iron (b)
Carbon (C) exists in the form of graphite with hexagonal layered crystal lattice under normal conditions. Carbon does not melt upon heating; it is sublimated (transfers into a gas phase) at temperature 3800 ?C. It is soft, lowstrength, easily conducts electric current.
What phases may be formed by these so unlike components at interaction?
Carbon can be dissolved in liquid iron and in lattices of both polymorphic modifications; also it forms a chemical compound with iron. Therefore in the alloys following phases can exist: a liquid solution (L), ferrite (F), austenite (A), cementite (C), graphite (G).
Ferrite is an interstitial solid solution of carbon in α iron with limiting solubility 0.02 % wt. C. Carbon atoms are placed in defects of the iron crystal lattice, since pores of BCC lattice are too small for them (Fig. 9.3, a). Ferrite is soft and ductile: σT = 300 MPa, = 40 %, HB = 80-100.
а b
Figure 9.3 Crystal lattice of ferrite (а) and austenite (b)
67
Created with novaPDF Printer (www.novaPDF.com). Please register to remove this message.
Austenite is an interstitial solid solution of carbon in γ iron with limiting solubility 2.14 % wt. C. Carbon atoms take places in the pores of FCC iron lattice (Fig. 9.3, b). Austenite is ductile phase, but it is harder as compared to ferrite: HB = 160-200, depending on concentration of carbon.
Cementite Fe3C is a chemical compound of carbon with iron, i. e. the iron carbide containing 6.69 % wt. C. It has a complex rhombic lattice and is very hard and brittle: its hardness makes approximately 800HB. Cementite decomposes onto iron and carbon under a long heating above 1000 ?C. Being heated fast (by a laser beam) it melts at 1260 ?C.
Graphite is a pure carbon: soft, low-strength, chemical-resistant, wellconducting electric current.
Except for the phases mentioned above, there are two structural constituents in the structure of iron-carbon alloys: such as eutectics and eutectoid. You already know what the eutectic is. In iron–carbon system, eutectic contains 4.3 % wt. C and crystallizes at 1147 ?C. It represents a mechanical mix of austenite and cementite crystals and is called ledeburite (in honour of Austrian scientist-metallurgist Ledebur):
Ledeburite = A + C, or Ledeburite = Feγ + Fe3C.
Eutectoid is a mechanical mix of crystals of two solid phases which is formed while a solid solution decomposes (instead of crystallisation from a liquid as eutectic). In iron–carbon system, eutectoid is a mix of lamellar ferrite and cementite crystals which is formed at the expense of austenite decomposition at the temperature 727 ?C:
A → F + C.
This mix containing 0.8 % wt. C, is called pearlite (because it has appearance of mother of pearl). Pearlite has the most successful combination of mechanical properties from all equilibrium structures existing in the iron–carbon alloys. Structurally pearlite is composed of soft, tough lamellae of ferrite alternating with strong, hard and rigid lamellae of cementite: P = F + C. Such a structure well resists to the various mechanical loadings, possesses high strength and sufficient toughness. Pearlite hardness is in the range 180-220 HB as depends on the grain size.
Phase transformations in iron–carbon alloys
The iron–carbon diagram looks like a combination of state diagrams considered above (see Fig. 9.4). Temperature is plotted along the ordinate, and the abscissa represents the carbon concentration in alloys, in weight percent.
68
Created with novaPDF Printer (www.novaPDF.com). Please register to remove this message.

Composition axis extends only to 6.69 % wt. C that corresponds to formation of a chemical compound – iron carbide, or cementite (Fe3C). More to the right of this concentration, the diagram usually does not extend, since those alloys have no practical application. The diagram in Figure 9.5 is brought with some simplifications in comparison with Figure 9.4 and shows not the equilibrium phases only, but structural constituents in iron–carbon alloys too.
Figure 9.4 The iron–iron carbide phase diagram
Line ACD is the liquidus of the diagram. In the left part, under line AC, austenite crystallizes, and in the right one, under line CD cementite forms. Solidus of the diagram AECF consists of curve line AE on which crystallisation of austenite comes to the end, and horizontal line ECF on which eutectic reaction occurs. Upon cooling, at the temperature 1147 ?C, a liquid phase is transformed into the two solid phases: austenite and cementite. This reaction may be written as follows:
L4.3 → A2.14 + C6.7.
In the alloys located to the left of point C, carbon content in a liquid grows in process of austenite formation, as austenite contains not more than
69
Created with novaPDF Printer (www.novaPDF.com). Please register to remove this message.

2.14 % wt. C. On the contrary, in alloys located to the right of point C, the carbon content in a liquid decreases in process of cementite crystallisation. Upon cooling to the temperature 1147 ?C the liquid solution in any alloy has eutectic concentration: 4.3 % wt. C.
Figure 9.5 The iron–iron carbide phase diagram (simplified version)
But when the crystallisation is over, the phase transformations in iron– carbon alloys do not come to the end. Iron at 911 ?C changes the type of crystal lattice, and solubility of carbon in it decreases sharply. In the field GSP, two solid solutions co-exist: ferrite and austenite. Upon cooling, in the alloys containing less than 0.8 % wt. C, grains of new phase, ferrite, arise in austenite and grow until replacing it completely. Thus the concentration of carbon in austenite grows, as the ferrite almost does not contain carbon. When the temperature 727 ?C is achieved, austenite contains 0.8 % wt. C.
Besides, carbon solubility in austenite is reduced in the process of cooling. In the diagram, it is reflected by line SE: it is a line of limiting solubility, or solvus; below this line carbon precipitates out of γ iron lattice. But active atomic carbon immediately reacts chemically with iron, producing carbide Fe3C. Cementite which precipitates from solid solution is called secondary cementite, instead of primary one which crystallizes from a liquid. In
70
Created with novaPDF Printer (www.novaPDF.com). Please register to remove this message.